INVESTIGATING MICROSTRUCTURAL AND ENVIRONMENTAL EFFECTS ON THE VERY HIGH CYCLE FATIGUE BEHAVIOR OF TI-6242S
by Jason Geathers
A dissertation submitted in partial fulfillment of the requirements for the degree of
Doctor of Philosophy (Mechanical Engineering) in the University of Michigan
2016
Doctoral Committee:
Associate Professor Samantha H. Daly, Co-Chair Professor J. Wayne Jones, Co-Chair
Professor John E. Allison
Associate Professor Vikram Gavini
©
Jason Geathers All Rights Reserved
ii
DEDICATION
iii
ACKNOWLEDGEMENTS
First and foremost, I would like to thank my academic advisors and committee co-chairs, Professor Samantha Daly and Professor J. Wayne Jones, for their support and guidance, without which this thesis would not have been possible. I truly appreciate the tremendous amount of time, advice, and patience that they devoted to my professional and personal development during my time at the University of Michigan. I would also like to thank the rest of my committee members, Professor John Allison, Professor Vikram Gavini, and Dr. Adam Pilchak, for their invaluable insights and careful consideration and critique of my dissertation.
The fatigue experiments presented in this dissertation would have been difficult to conduct without Chris Torbet of the University of California Santa Barbara, who assisted in the designing and building of the in situ ultrasonic fatigue and scanning electron microscopy system. I would also like to thank him for his help in the designing of experiments and continuous technical support. I am also grateful to Dr. John Mansfield, Dr. Emmanuelle Marquis, and Bobby Kerns of the University of Michigan Center for Materials Characterization for their assistance with facilities use and troubleshooting the experimental setup.
I must also thank my numerous colleagues, who provided thoughtful discussions regarding research and other topics, as well as encouragement, assistance, and camaraderie: Dr. Ben Reedlunn, Dr. Kyubum Kim, Dr. Adam Kammers, Dr. Alfred Okello, Dr. Michael Kimiecik, Dr. Jared Tracy, Dr. Jiashi Miao, Dr. Zhe Chen, Dr. Qianying Shi, Dr. Xianfeng Ma, Dr. Luke Rettberg, Dr. Tracy Berman, Sinsar Hsie, Alan Githens, Joyce Gong, Will LePage, Michelle
iv
Harr, Marissa Linne, Aeriel Murphy, Erin Deda, Anna Trump, Vir Nirankari, Jacob Adams, Paul Schrems, Allison Ryan, Emmanuel Nyangweso, and Steve Orloff.
I would also like thank my family, my girlfriend, and friends for their love, support, encouragement, and prayers. All of this would have been impossible without you.
Finally, I gratefully acknowledge the Air Force Office of Scientific Research, Structural Mechanics Program, monitored by Dr. David Stargel (Project No. F031559), for funding the majority of this work. I would also like to acknowledge the Rackham Merit Fellowship Program at the University of Michigan for providing the initial startup funding. A special thank you is extended to my Air Force Research Laboratory collaborators, especially Dr. James M. Larsen, Dr. Sushant Jha, and Dr. Christopher Szczepanski (currently at Special Metals Corp.) for providing the titanium alloy that was used in this dissertation and for their insightful discussions and support.
v TABLE OF CONTENTS DEDICATION ... ii ACKNOWLEDGEMENTS ... iii LIST OF TABLES ... x LIST OF FIGURES ... xi
LIST OF APPENDICES ... xxiii
ABSTRACT ... xxiv
CHAPTER 1 INTRODUCTION ... 1
CHAPTER 2 LITERATURE REVIEW ... 6
2.1 Microstructure of Titanium Alloys ... 6
2.1.1 Physical Metallurgy ... 7
2.1.2 Description of Microstructure ... 11
2.1.3 Thermomechanical Processing ... 12
2.1.4 Mechanical Behavior of Titanium ... 15
2.2 Fatigue of Titanium Alloys – Microstructural Effects ... 20
2.2.1 Fatigue Crack Initiation ... 20
vi
2.2.3 Very High Cycle Fatigue Behavior... 29
2.3 Fatigue of Titanium Alloys – Frequency Effects ... 32
2.3.1 Environmental Effects ... 33
2.4 Oxidation of Titanium and Titanium Alloys ... 47
2.4.1 Oxidation in Air ... 47
2.4.2 Oxidation in Water Vapor ... 48
2.4.3 Oxidation in Oxygen ... 48
2.5 Summary ... 49
CHAPTER 3 MATERIAL AND EXPERIEMENTAL PROCEDURES ... 53
3.1 Material ... 53
3.2 Fatigue Specimens... 55
3.2.1 Specimen Design ... 55
3.2.2 Specimen Preparation ... 57
3.2.3 Fatigue Crack Growth Specimens ... 59
3.3 Ultrasonic Fatigue Testing ... 61
3.3.1 Experimental Setup for Ultrasonic Fatigue Testing in Laboratory Air ... 61
3.3.2 Experimental Setup for Ultrasonic Fatigue Testing in Gaseous Environments ... 65
3.3.3 Fatigue Crack Growth Tests ... 69
3.3.4 Fatigue Crack Initiation Tests ... 72
vii
3.4.1 Metallographic Sample Preparation ... 72
3.4.2 Optical Microscopy ... 73
3.4.3 Scanning Electron Microscopy ... 73
3.4.4 Grain Size and Volume Fraction Measurements ... 74
CHAPTER 4 INVESTIGATION OF MICROSTRUCTURAL AND ENVIRONMENTAL EFFECTS ON SMALL FATIGUE CRACK GROWTH USING COMBINED ULTRASONIC FATIGUE AND SCANNING ELECTRON MICROSCOPY ... 75
4.1 Microstructural Characterization ... 76
4.2 Macroscopic Thermal Characterization of Ultrasonic Fatigue in Vacuum... 79
4.3 Environmental Effects on Small Fatigue Crack Growth Rates ... 83
4.3.1 Fatigue Crack Behavior in Laboratory Air and Vacuum ... 85
4.3.2 Fatigue Crack Growth Behavior in Water Vapor, Oxygen, and Hydrogen ... 87
4.4 Crack Initiation from FIB Micro-notches ... 92
4.4.1 Environmental Effects ... 93
4.4.2 Microstructural Effects ... 93
4.5 Surface Crack Path Observations ... 95
4.5.1 Characterization of Fatigue Crack Growth in Relation to Microstructure ... 95
4.5.2 Effects of Microstructural Barriers on Fatigue Crack Growth ... 101
4.6 Fractographic Analysis of Fatigue Cracks ... 105
viii
4.6.2 Fracture Surface Observations from Water Vapor, Oxygen, and Hydrogen Testing 110
4.6.3 Evidence of Oxide Formation of Fatigue Fracture Surfaces ... 113
4.7 Process of Environmental Effects of Small Fatigue Crack Growth ... 115
4.7.1 The Processes for Environmental Influence on Small Fatigue Crack Growth ... 115
4.7.2 Estimation of Rate Controlling Process of Environmental Effect ... 124
4.8 Summary and Conclusions ... 127
CHAPTER 5 EXAMINING MICROSTRUCTURAL AND ENVIRONMENTAL INFLUENCES ON FATIGUE CRACK INITIATION IN VERY HIGH CYCLE FATIGUE OF TI-6242S ... 130
5.1 Fatigue Lifetime ... 131
5.2 Crack Initiation Locations ... 135
5.3 Fractographic Analysis ... 140
5.4 Types of Fatigue Crack Initiation... 143
5.4.1 Type #1: Fatigue Crack Initiation Along Low Misorientation Grain Boundaries 146 5.4.2 Type #2: Fatigue Crack Initiation by Stroh Mechanism ... 151
5.4.3 Frequency of Occurrence of Type #1 Fatigue Crack Initiation Neighborhoods .. 157
5.5 Summary and Conclusions ... 159
CHAPTER 6 CONCLUSIONS AND FUTURE WORK ... 162
ix
6.2 Recommendations for Future Work ... 163 APPENDICES ... 166 REFERENCES ... 169
x
LIST OF TABLES
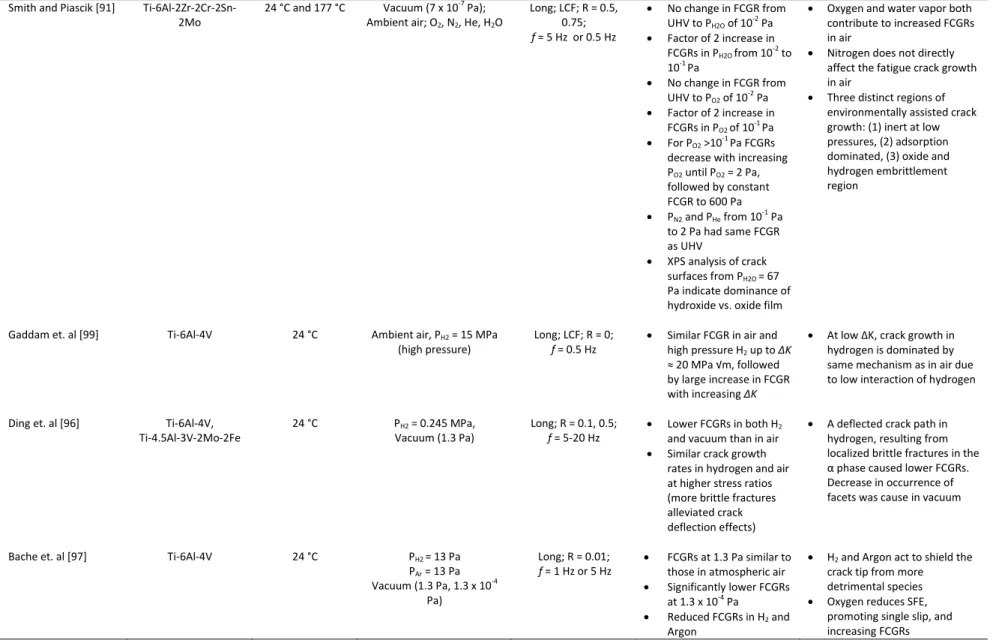
Table 2.1: Summary of prior investigations on environmental effects in titanium alloys ... 39
Table 3.1: Chemical composition of Ti-6242S alloy used in this study ... 54
Table 3.2: Number of fatigue specimens tested in each environment ... 69
Table 4.1: Summary of fatigue crack growth rate data and Paris law parameters ... 85
Table 4.2: Fatigue crack initiation lifetimea ranges from randomly located FIB micro-notches for each test environment. ... 93
Table 4.3: Microstructural characteristics of grains located at micro-notch ends where no cracks initiated. ... 95
Table 5.1: Summary of the number of nascent cracks observed on flat fatigue specimen surfaces ... 137
Table 5.2: Summary of fatigue crack initiation mechanisms observed in fatigue specimens failed in laboratory air and vacuum ... 145
Table 5.3: Criteria used in treatment of EBSD map to identify grains that may form Type #1 fatigue cracks ... 157
xi
LIST OF FIGURES
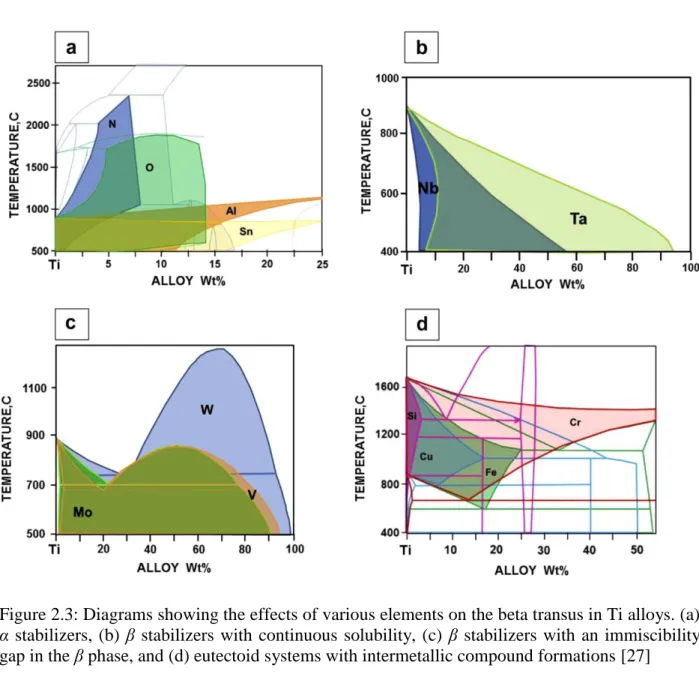
Figure 2.1: Ti-Al binary phase diagram illustrating the α stabilizing effect of aluminum alloying [28] ... 7 Figure 2.2: Micrographs showing the morphologies and length scales of microstructures attainable by control of material composition and thermomechanical processing route [29] ... 8 Figure 2.3: Diagrams showing the effects of various elements on the beta transus in Ti alloys. (a)
α stabilizers, (b) β stabilizers with continuous solubility, (c) β stabilizers with an immiscibility gap in the β phase, and (d) eutectoid systems with intermetallic compound formations [27] ... 10 Figure 2.4: Backscattered electron micrograph of Ti-6242S material as an example of the bimodal, or duplex microstructure which consists of globular primary α grains in a transformed β matrix ... 12 Figure 2.5: Schematic of various processing paths in titanium alloys and the texture developed at key steps [30] ... 14 Figure 2.6: Schematic of the processing route for bi-modal microstructures of Ti alloys [25] ... 14 Figure 2.7: Elastic constants of the α phase in titanium as a function of temperature are shown. The Young’s modulus in the “c” direction was higher than the “a” direction. [31] ... 16 Figure 2.8: Slip systems of α phase titanium, hcp and β phase titanium, bcc are shown. Plastic deformation behavior is controlled by slip on the basal, (0002), prismatic (1010), and pyramidal (1011) crystal planes of the α phase. [25] ... 17
xii
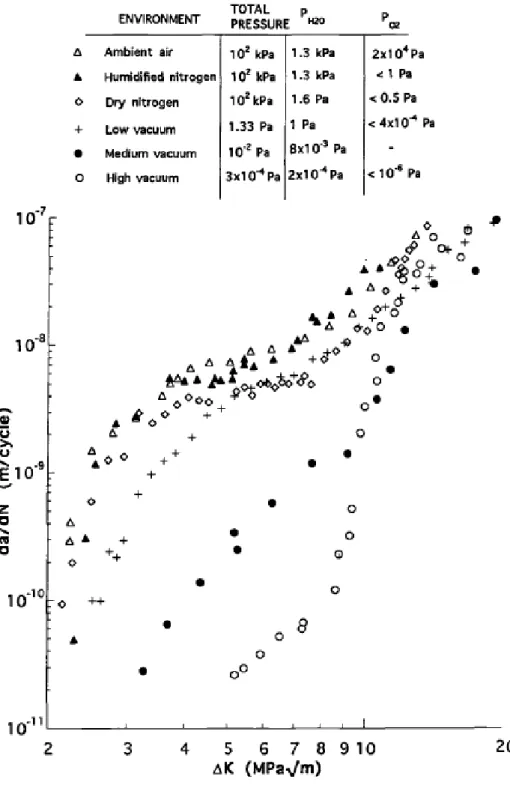
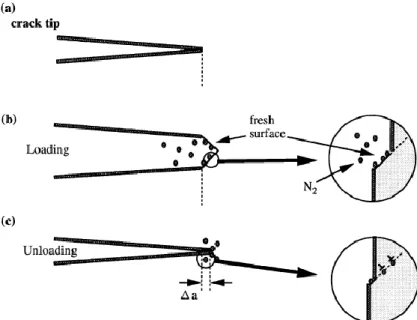
Figure 2.9: CRSS for basal, prism, and <c + a> slip in single crystals of Ti-6.6Al as a function of temperature [36] ... 18 Figure 2.10: Examples of microstructural features that can cause fatigue crack initiation in α + β titanium alloys are shown. (a) αp grains, (b) α colonies, (c) prior β grains, (d) microtextured regions. [42] ... 24 Figure 2.11: Schematic of Stroh model for planar slip leading to fatigue crack initiation [57] ... 25 Figure 2.12: Schematics of examples of neighbor grain configurations for which basal plane facet formation was observed. Hard-soft grain pairs are thought to be the most detrimental to fatigue life. [56] ... 25 Figure 2.13: This schematic shows the small crack effect where the growth rates of small cracks can sometimes be higher than expected based on long fatigue crack growth rates. [70] ... 27 Figure 2.14: S-N data on a high strength steel gathered by Sakai et al. that shows fatigue failures occurred below the fatigue limit at very long lives. The failure also switched from surface to subsurface. [3] ... 31 Figure 2.15: Crack growth rate data from fatigue of Ti-6Al-4V, at R = 0.1 and 35 Hz showing the effects of partial pressures of water vapor and oxygen are shown. [111] ... 42 Figure 2.16: Crack growth rate data from fatigue of Ti-6Al-4V, at R = 0.1 and 35 Hz showing similar fatigue crack growth rates for ambient air and humidified nitrogen [111] ... 43 Figure 2.17: A schematic diagram of the model for nitrogen entry into the plastic zone during fatigue of pure titanium is shown. (a) a fatigue crack-tip, (b) Nitrogen adsorption onto fresh surfaces produced during the loading cycle of the crack-tip, (c) Nitrogen entry during the unloading portion of the cycle [94] ... 44
xiii
Figure 2.18: Dependence of crack growth and estimated hydrogen concentration of water exposure of a cast aluminum alloy at 20 °C. Data is also shown for ultrasonic fatigue at 20 kHz. [114] ... 46 Figure 3.1: Backscattered electron micrograph of Ti-6242S material. The bimodal microstructure consisted of globular primary α grains in a transformed β matrix with an average primary α grain size of 12.5 ± 5.5 µm. The volume fraction of the primary α phase was approximately 30 ± 3%. ... 54 Figure 3.2: Representative plot of the displacement and strain as a function of position along the ultrasonic fatigue specimen axis for Ti-6246. [83] ... 56 Figure 3.3: A schematic of the in-house electropolishing setup ... 58 Figure 3.4: A schematic of FIB micro-notch placement on surface of fatigue specimens ... 60 Figure 3.5: A BSE image of a FIB micro-notch is shown with the corresponding inverse pole figure (IPF) map of the surrounding microstructure. ... 60 Figure 3.6: (a) Laboratory air setup including Navitar 12X Ultrazoom optical system and ultrasonic testing system and (b) a magnified view of the ultrasonic testing system. ... 63 Figure 3.7: Control Unit for ultrasonic fatigue testing ... 64 Figure 3.8: Ultrasonic fatigue scanning electron microscope (UF-SEM) system combining ultrasonic fatigue at 20 kHz with the high resolution imaging capabilities of a SEM. ... 67 Figure 3.9: (a) UF-SEM system using a FEI Quanta 3D E-SEM (b) UF-SEM system using a Tescan Mira-3 FEG/SEM ... 67 Figure 3.10: Experimental setup for characterization of temperature increase from ultrasonic fatigue cycling in vacuum ... 68
xiv
Figure 3.11: Schematic of environmental scanning electron microscope system. The water source is a flask of water heated using a hot plate to keep a steady layer of water vapor above the liquid water in the flask. The nitrogen supply line can be used to input other gases such as oxygen and hydrogen [130] ... 71 Figure 3.12: A schematic of orientation of blank extraction from the parent forging for making specimens for material characterization and fatigue specimens. ... 73 Figure 4.1: Backscattered electron micrograph of Ti-6242S material. The bimodal microstructure consisted of globular primary α grains in a transformed β matrix with an average primary α grain size of 12.5 ± 5.5 µm. The volume fraction of the primary α phase was approximately 30 ± 3%. ... 76 Figure 4.2: Grain size distribution of the αp phase of Ti-6242S ... 77 Figure 4.3: Inverse Pole Figure (IPF) map of 300x500 μm2 area and corresponding pole figure (PF) map indicating low degree of material texture are shown. RD is normal to the image. ... 78 Figure 4.4: IPF of approximately 3 x 3 mm2 area measured by AFRL collaborators that verifies that material has a low degree of texture ... 79 Figure 4.5: Heating curves are shown for a fatigue specimen that was cycled at nominally 20 kHz in vacuum at σa = 400 MPa for 106 cycles. Red and blue points represent two separate tests under the same conditions. The temperature rise measured using a K-type thermocouple was determined to be approximately 7 °C. The specimen took approximately 90 minutes to cool down to ambient temperature after cycling was stopped. ... 81 Figure 4.6: Thermal maps of the gage section of a fatigue specimen at different numbers of cycles that was fatigued in vacuum at σa = 400 MPa, using a duty cycle of 200 ms/3000 ms
xv
pulse/pause are shown. The highest temperatures occurred in the gage section and an increase in temperature of 11 °C was observed after 106 cycles... 82 Figure 4.7: Crack length (c) vs. cycle number (N) for fatigue experiments of the environments studied is shown. Fatigue lifetimes decreased with increasing PH2O and environmentally assisted
crack growth was observed in all gases compared to a vacuum pressure of 1.7 x 10⁻⁴ Pa. ... 84 Figure 4.8: The fatigue crack growth rate (dc/dN) vs. ΔK for all of the environments examined is shown. The highest fatigue crack growth rates were observed in laboratory air and 1330 Pa H2O
vapor. A PH2O of 1330 Pa corresponds to a relative humidity (RH) of ~40% in ambient air at 25
°C and 101 kPa. All tests were conducted using ultrasonic fatigue at 20 kHz and R = -1. ... 84 Figure 4.9: Early crack growth from a FIB micro-notch in a fatigue specimen cycled in vacuum is shown. Cracks in vacuum frequently propagated for only a few micrometers, usually within the first grain, before arresting for 107 cycles or more. The extruded crack debris is most likely a product of fracture surface oxidation and fully reversed loading. ... 87 Figure 4.10: The fatigue crack growth rate (dc/dN) vs. ΔK for each H2O vapor environment
showing that fatigue crack growth rates increased with increasing water vapor pressure, with the lowest fatigue crack growth rates being observed in a vacuum of 1.7 x 10⁻⁴ Pa. ... 88 Figure 4.11: The fatigue crack growth rate (dc/dN) vs. ΔK for water vapor and oxygen at 133 Pa and 1330 Pa. At equivalent pressures, fatigue crack growth rates were higher in water vapor than oxygen. The difference in fatigue crack growth rates was also greater at 1330 Pa than 133 Pa. . 89 Figure 4.12: Fatigue crack growth rates in 133 Pa H2 were lower than in 133 Pa H2O. The growth
xvi
Figure 4.13: Fatigue cracks grown in 1330 Pa H2 environment. All cracks arrested at similar
surface lengths of approximately 150 μm. The fatal crack was naturally initiated in a more favorable microstructural neighborhood for fatigue crack growth. ... 92 Figure 4.14: An OIM map of the local microstructure of a FIB micro-notch where a crack did not initiate from the right side after 3 x 10⁶ cycles in 65 Pa H2O. A diagram of the orientation of the
hcp crystal lattice of the unfavorable αp grain is also shown. Loading direction is vertical. ... 94 Figure 4.15: Small fatigue cracks propagated in a 133 Pa H2O vapor environment from three FIB
micro-notches machined into the same test specimen. The specimen failed at a fatal crack that was initiated and grown from Notch 1. Transgranular, crystallographic crack growth was observed in each case. ... 97 Figure 4.16: A graph of the tendency for the surface crack path to align with slip plane traces of basal, prismatic, and pyramidal planes is shown. In grains where the surface crack path orientation aligned with more than one slip plane trace, it was denoted as <a> type. If no match was observed, the correlation was marked as unknown. A significant preference for cracking along basal planes was observed in αpgrains, while cracking along basal and prismatic planes occurred at similar frequencies in transformed β grains. ... 98 Figure 4.17: Measurements of the relative heights of the fatigue crack path from the centerline of the FIB micro-notch for each PH2O studied are shown. The deviation of the crack path above and
below the micro-notch centerline decreased with decreasing PH2O, indicating the crack
propagation plane preferred being normal to the loading direction regardless of specific crystallographic planes at lower PH2O. ... 101
Figure 4.18: A small fatigue crack was initiated and grown in laboratory air. The right image shows the local microstructure surrounding the notch with the IPF map overlaid, where black
xvii
lines denote basal plane traces. The SEM micrograph on the left shows the fatigue crack propagated along basal planes and arrested at a high angle α/α grain boundary after 3.0 x 10⁴
cycles... 102 Figure 4.19: A small fatigue crack was initiated and grown in 133 Pa H2O vapor. A micrograph
of the local microstructure surrounding the notch and the propagated crack with the IPF map overlaid is shown. The black lines denote basal plane traces. The left side fatigue crack propagated along basal planes in α grains and arrested at the α/α+β phase boundary indicated by the arrow for approximately 105 cycles. ... 103 Figure 4.20: Crack length (c) vs. cycle number (N) for a small fatigue crack initiated in laboratory air and then fatigued in vacuum is shown. The fatigue crack was grown in laboratory air for 105 cycles before the system was placed in vacuum and cycled for an additional 107 cycles. The crack was arrested at the indicated grain boundary and very little crack growth was observed during fatigue in vacuum. After the specimen was returned to the laboratory air environment, the crack grew past the grain boundary and returned to an expected fatigue crack growth rate for laboratory air. It is evident that the efficacy of barriers such as grain boundaries to short fatigue crack propagation may depend significantly on environment. ... 104 Figure 4.21: Comparison of fracture surfaces from vacuum and laboratory air test is shown. More smoother, faceted regions occurred in laboratory air. Significant areas of finer, ductile fracture features occurred in vacuum. ... 106 Figure 4.22: High magnification of ductile fracture in vacuum test. Such regions are not observed in laboratory air. ... 107 Figure 4.23: A fracture surface produced by fatigue in vacuum is shown. Fine, ductile fracture regions are observed similarly to the fracture surface shown in Figure 4.22. High magnification
xviii
images of two facet-like features are also shown. The roughness of these features is more indicative of a slowly advancing crack rather than a fast, cleavage type mechanism. ... 107 Figure 4.24: (a) A similar fine, ductile fracture region from fatigue in vacuum of a Ti-6Al-4V alloy specimen tested by Oguma and Nakamura [133] is shown. (b) A schematic of the mechanism for formation of these regions is illustrated. Cold-welding of fresh crack surfaces at the crack-tip leading to microstructure refinement with repeated cycling is proposed. ... 108 Figure 4.25: SEM micrograph of the fracture surface of a fatal crack propagated in the 133 Pa saturated water vapor environment. The right image is a magnification of the yellow box in the left image, and shows a macroscopically smooth primary α facet with distinct crack growth features indicating that the facet was created by a slowly advancing crack (dc/dN ≈ 1.8 x 10⁻¹⁰ m/cycle) rather than a cleavage mechanism. The crack propagation direction is from bottom to top. ... 109 Figure 4.26: SEM micrographs of the fracture surface of a fatal crack propagated in laboratory air. At right is a magnification of the yellow box in the left image, and shows a macroscopically smooth primary α facet with no striation-like features. The crack propagation direction is from bottom to top (dc/dN ≈ 6.2 x 10⁻¹⁰ m/cycle). ... 110 Figure 4.27: Comparison of fracture surfaces from laboratory air, 1330 Pa H2O vapor, and 1330
Pa O2 test. No significant differences were observed. ... 111
Figure 4.28: Fracture surfaces of fatal cracks for (a) laboratory air, (b) 133 Pa H2O vapor, and (c)
65 Pa H2O vapor. The images on the left show the specimen fracture surface as viewed along the
loading direction. The images on the right show the corresponding fracture surfaces on the left with a BSE image of the adjacent surface microstructure as viewed by a 45° tilt with respect to
xix
the loading direction. Faceted fracturing is observed in each of the test environments in the early stage crack growth region. ... 112 Figure 4.29: SEM micrograph of extruded material from a surface crack of a specimen fatigued in vacuum (3.7 x 10⁻⁴ Pa). The extruded material transitions from a thin feather-like structure in the primary alpha grain to a globular extrusion upon entering the adjacent lamellar region. .... 114 Figure 4.30: High magnification image of material from a surface crack of a specimen fatigued in vacuum. ... 114 Figure 4.31: A schematic illustrating the proposed process of increased fatigue crack growth rates in the presence of water vapor is shown. First, water vapor molecules migrate to the crack-tip. During the loading portion of the fatigue cycle, a fresh fracture surface is created in front of the oxidized fracture surface. The water vapor reacts with the fresh fracture surface, generating a newly oxidized surface and releasing hydrogen atoms that diffuse into the crack-tip plastic zone. The crack growth rate is accelerated by impeded reverse slip due to both the oxide layer and diffused H that can cause hydrogen embrittlement or HELP behavior [106]... 119 Figure 5.1: Fatigue lifetime behavior of Ti-6242S tested in both laboratory air and vacuum with step test runouts and final failures. In general, fatigue lifetimes were shorter in air than in vacuum. The failure lifetimes of three specimens that were cycled in vacuum for 108 cycles at 450 MPa, followed by cycling in air until failure are also shown. The failure lifetimes of these samples are similar to the failure lifetimes of virgin samples failed in laboratory air. ... 134 Figure 5.2: A 2.75 x 2.75 mm2 backscattered electron micrograph of a portion of a fatigue specimen gage section after 2.5 x 10⁷ cycles in vacuum at σa = 450 MPa is shown. Four images were captured along the flat gage section on both sides of the specimen at various numbers of
xx
cycles in order to check for the initiation of fatigue cracks, such as the two shown in the magnified images at right... 135 Figure 5.3: Two examples of nascent cracks initiated in a fatigue specimen tested at σa = 450 MPa in vacuum. Corresponding OIM maps of the local grain orientation and prismatic Schmid factor are also provided. The extruded material at the crack was also observed in small crack growth from FIB notches and is discussed in Section 4.6.3. ... 138 Figure 5.4: Examples of nascent cracks initiated in vacuum (a) and laboratory air (b) are shown. Nascent cracks in vacuum typically spanned one αp grain, while nascent cracks formed in laboratory air would frequently propagate into neighboring grains. ... 139 Figure 5.5: A histogram of the length of nascent cracks initiated in laboratory air and vacuum is shown. The average length of nascent cracks in vacuum and laboratory air was 8.5 ± 3.1 μm and 13.0 ± 7.8 μm, respectively. ... 139 Figure 5.6: Fracture surface of fatigue specimen failed in laboratory air, σa = 425 MPa, Nf = 6.24 x 10⁶ cycles. Higher magnification images of the fatigue crack initiation site (A) and other fracture surface regions B and C at various crack lengths are shown. The fracture surface created by breaking the specimen in half after the fatigue test was stopped is shown in D. ... 142 Figure 5.7: Examples of fracture surfaces produced by fatigue in (a) laboratory air and (b) vacuum are shown. Smooth facet-like features were seen in both the vacuum and laboratory air fracture surfaces, but rougher, small-scale ductile fracture regions were only observed on fracture surfaces of specimens tested in vacuum. ... 143 Figure 5.8: A schematic of (a) Type #1 and (b) Type #2 fatigue crack initiation processes. Type #1 fatigue cracks were the most frequently observed for both environments. ... 145
xxi
Figure 5.9: An example of a Type #1 nascent fatigue crack initiated in vacuum is shown. Grain A and Grain B initiated a crack at their low misorientation grain boundary of approximately 13°. Basal and prismatic Schmid factor maps of the microstructural neighborhood are also shown. The two αp grains can be classified as hard compared to the surrounding soft microstructure. . 146 Figure 5.10: An IPF map of the orientations of grains leading to Type #1 fatigue cracks in laboratory air and vacuum testing. Iso-curves of the basal Schmid factor are also plotted. The orientations of grains were similar in laboratory air and vacuum, with basal Schmid factors ranging from 0.27 to 0.50. ... 148 Figure 5.11: Distributions of basal, prismatic, and pyramidal Schmid factors of αp grains leading to Type #1 fatigue cracks. No significant differences in range or distribution are observed for cracks initiated in vacuum compared to laboratory air. ... 149 Figure 5.12: A distribution of the angle between the basal plane normal and the loading axis (θ) is shown for grains where Type #1 cracks initiated. The average angle in laboratory air was approximately 36° and the average angle in vacuum was approximately 34°. ... 150 Figure 5.13: An example of a nascent crack that initiated from a high misorientation grain boundary (65°) between a soft (Grain A) and hard (Grain B) αp grain. The crack was likely initiated on or near the basal plane Grain B. A slip band parallel to the prismatic plane trace of the soft grain is also visible. ... 152 Figure 5.14: IPF maps showing the orientations of the hard and soft αp grains that led to Type #2 cracks being initiated in vacuum tests. The hard grain had a low prismatic Schmid factor and moderate to high basal Schmid factor simultaneously. The soft grain had a high prismatic Schmid factor and a low to moderate basal Schmid factor. A prismatic slip band, consistent with the modified Stroh mechanism, was also produced within the soft grain, as shown. ... 153
xxii
Figure 5.15: SEM-DIC strain maps at N = 2 x 10⁶ cycles are shown for a Type #2 nascent fatigue crack that was initiated in vacuum at σa = 450 MPa. (a) A micrograph showing the specimen surface and crack after the speckle pattern was removed is shown. The crack initiated along a basal plane trace. (b) A BSE image of the patterned surface with the grain boundary locations overlaid in black and the crack highlighted within the speckle pattern is shown. The εyy strain map in (c) shows that Grain B, the hard grain, had less accumulated axial strain than its neighborhood. The shear strain map in (d) indicates that Grain B also had a higher degree of shear strain accumulated than Grain A, the soft grain, and the surrounding microstructure. This is in agreement with the hard – soft grain crack initiation mechanism proposed for Type #2 fatigue cracks. ... 156 Figure 5.16: An example of some criteria for Type #1 fatigue crack initiation neighborhoods being applied to the (a) large EBSD map is shown. The circled grains produced a Type #1 fatigue crack during cycling in vacuum and should remain after treatment of the data. Plot (b) shows the grains that meet the basal and prismatic Schmid factor requirements. Plot (c) shows the grains that meet the Schmid factor requirement for the hard αp grains and the soft neighborhood criterion. Plot (d) reduces these grains to only pairings that have a low misorientation grain boundary, in this case < 20°. ... 158
xxiii
LIST OF APPENDICES
Appendix A Ultrasonic Fatigue Specimen Drawing ... 166 Appendix B Ultrasonic Fatigue Testing Principle ... 167
xxiv ABSTRACT
INVESTIGATING MICROSTRUCTURAL AND ENVIRONMENTAL EFFECTS ON THE VERY HIGH CYCLE FATIGUE BEHAVIOR OF TI-6242S
by Jason Geathers Chairs: Samantha Daly, J. Wayne Jones
Extending the service lifetimes of existing components, and designing new mechanical systems capable of withstanding longer lifetimes, is critically important for applications in the aerospace, energy generation, and transportation sectors. These applications require an understanding of the coupled interactions between local microstructure and environmental effects. Towards this end, the effects of microstructure and environment on fatigue damage accumulation behavior in the VHCF regime were investigated in the near alpha titanium alloy Ti-6Al-2Sn-4Zr-2Mo-0.1Si (Ti-6242S). The influence of microstructure and environment on fatigue crack initiation from micro-notches, and on early crack growth behavior, was characterized using ultrasonic fatigue. Fatigue crack growth was studied in laboratory air, high vacuum (1.7 x 10⁻⁴ Pa), and in various pressures of water vapor, high purity oxygen, and hydrogen gas.
A new experimental methodology was developed that combines ultrasonic fatigue at 20 kHz and environmental scanning electron microscopy to examine small crack growth behavior as a function of the local microstructure, in situ. Ultrasonic fatigue techniques enabled the acquisition
xxv
of large numbers of cycles in significantly shorter timeframes than conventional testing techniques. Incorporating fatigue testing directly into an environmental scanning electron microscope (ESEM) enabled very high spatial resolution imaging (≈ 5 nm) of localized damage accumulation at the micro-scale and early crack initiation and growth observations.
A number of findings have resulted from these experiments and analyses, which have provided new insights in fatigue mechanisms in the VHCF regime. Natural fatigue crack initiation occurred at or very near grain boundaries between two similarly oriented primary alpha grains that were not favorably oriented for slip. Small fatigue cracks took longer to initiate from micronotches in vacuum than in laboratory air or low pressure water vapor environments (65 Pa – 665 Pa). Water vapor was also found to be significantly more deleterious to fatigue life than either pure hydrogen or pure oxygen at equivalent pressures. Similar fatigue crack growth rates were obtained for cracks grown in ambient air and 1330 Pa water vapor environments (corresponding to a relative humidity of 40%-60%), suggesting a dominance of water vapor effects in ambient air as well. Fatigue crack growth rates were found to significantly increase with increasing water vapor pressure in both the primary α phase and the lamellar α + β microstructure. Increased fatigue crack growth rates in water vapor and oxygen were determined to be due to adsorption-assisted crack propagation, which stems from atoms or molecules being adsorbed onto fresh surfaces at the crack-tip causing increased irreversibility. A striking change in the fatigue crack growth rate of an arrested crack with a change in environment indicated an associated loss of effectiveness of grain boundaries as barriers to short crack propagation.
1
CHAPTER 1 INTRODUCTION
The annual cost of high cycle fatigue to the military has been estimated to be over $400 million [1]. Additionally, there has been increased interest in the design of components to handle increasingly longer lifetimes (>107 cycles), and it is critically important to be able to accurately predict when these components will fail. Increasing the service lifetimes of components into the very high cycle fatigue (VHCF) regime, in which components are loaded to >107 cycles, requires an understanding of the interactions between the intrinsic material properties and the operating environment.
There is a growing need to extend the service life of systems and components well beyond the traditional fatigue design limits of 107 cycles, into the VHCF regime. Researchers have conventionally assumed the existence of a fatigue limit, or threshold stress amplitude below which fatigue life is infinite [2]. This assumption is historically linked to fatigue studies of ferrous metals in the high cycle fatigue (HCF) regime, a fatigue life range of 104 to 107 cycles [3]. However, recent studies conducted at 30-100 Hz [4, 5] and at ultrasonic frequencies [6, 7] reveal that this assumption may not be a valid design approach for materials operating in the VHCF regime. Even at applied stresses well below the conventional fatigue threshold and at nominally elastic strains characteristic of VHCF, damage accumulation at the microstructural length scale can lead to crack initiation and fatigue failure [8-11]. Furthermore, fatigue life in
2
this regime is dominated by crack initiation and the growth of microstructurally small cracks. Thus, a significant portion of the fatigue life involves micro-scale mechanistic responses to cyclic stresses [12]. The sensitivity of cyclic deformation mechanisms to microstructural influences adds complexity and uncertainty to lifetime predictions.
Fatigue in the VHCF regime poses additional challenges in component design when considering the significant influence of microstructural variability and environmental effects. One practice is to extrapolate test data from the high cycle fatigue regime to higher numbers of cycles. This can lead to non-conservative fatigue life estimates in some materials, such as titanium alloys with a duplex microstructure, due to the occurrence of fatigue life failures well below the mean life behavior. Another method is to interrogate the VHCF regime directly. This is typically done using ultrasonic fatigue techniques that operate most commonly at 20 kHz that enable investigating VHCF behavior in a time-efficient manner. The use of ultrasonic fatigue testing systems is typically carried out in laboratory air, with little discussion of environmental effects. A substantial knowledge gap remains in high frequency, long life testing and the environmental processes that may be operative in this regime. In evaluating the environmental mechanisms responsible for diminished fatigue lifetimes and increased fatigue crack growth rates at ultrasonic fatigue frequencies, the following questions remain:
1. Are the mechanisms for enhanced fatigue crack growth with increased environmental activity that are proposed for short lifetime, low frequency testing relevant in the VHCF regime at ultrasonic frequencies?
2. What factors or dependencies govern the mechanisms for environmentally assisted fatigue crack growth during ultrasonic fatigue, and how do they compare to lower frequency testing?
3
3. What insights can be gathered from environmental testing using ultrasonic fatigue to help develop a better understanding of the surface vs. sub-surface fatigue crack initiation competition observed in many materials at longer lifetimes at ultrasonic frequencies? The present work focused on addressing these questions regarding environmental effects on the fatigue behavior of near-alpha titanium alloys using a direct, experimental approach. This new experimental methodology combines ultrasonic fatigue testing capabilities at 20 kHz with an environmental scanning electron microscope (ESEM).
Ultrasonic fatigue testing has been used since the early 1950s [13, 14] to provide a powerful and time-effective means for interrogating VHCF of a wide range of materials including cast aluminum alloys [15, 16], nickel-base superalloys [8, 17], titanium alloys [11], and high strength steels [18, 19]. Over the past forty years the technique has been extended to enable VHCF studies under various environmental conditions [8, 20], in crack growth studies [21-23], and in conjunction with other techniques such as synchrotron x-ray imaging [17]. However, the data acquired from ultrasonic fatigue testing largely remains limited to determination of total fatigue life, crack growth rates, and deformation processes that are inferred from fractography and surface microscopy. Observations regarding crack initiation and ultimate failure are linked to microstructure in a before-and-after methodology through grain mapping techniques, mainly by electron backscatter diffraction, with limited in situ observations. Efforts have been made to track the evolution of deformation and formation of early fatigue damage, such as slip bands, by using methods that probe the damage micro-mechanisms taking place as a function of the number of cycles. For example, replication is a common technique used to obtain surface fatigue damage history as a function of applied cycles [22]. In another approach, Stanzl-Tschegg et al. [24] used a combination of high resolution SEM and atomic force microscopy (AFM) to
4
investigate fatigue damage in copper polycrystals in the VHCF regime. This technique was ex situ and required a significant amount of time, but provided useful information regarding the progression of fatigue damage at even 50% below the persistent slip band (PSB) threshold. In order to advance the understanding of fatigue crack initiation and early crack growth in VHCF, new experimental techniques are needed that enable the in situ study of damage accumulation mechanisms as a function of microstructure and environment.
The overall aim of this dissertation research was to develop a fundamental understanding of environmental and microstructural influences on fatigue damage mechanisms in titanium alloys in the VHCF regime, thereby advancing accurate life prediction models and increasing the efficiency and reliability of aerospace components.
The specific objectives of this thesis work were to:
1. Develop and validate a new experimental methodology that combines ultrasonic fatigue testing techniques at 20 kHz with (environmental) scanning electron microscopy;
2. Determine the effects of laboratory air, water vapor, oxygen, hydrogen, and vacuum environments on small fatigue crack growth rates in Ti-6242S;
3. Characterize the processes responsible for environmental effects on small fatigue crack growth in Ti-6242S in ultrasonic fatigue;
4. Identify the microstructural features responsible for fatigue damage accumulation and add to our understanding of the mechanisms of fatigue crack initiation in the VHCF of Ti-6242S, which represents an important class of near-α titanium alloys used in aerospace applications.
5
Chapter 2 provides a review of the literature that is relevant to the present work, including previous studies of microstructural and environmental effects on fatigue behavior of titanium alloys. A review of investigations of environmental influences of fatigue of various materials at an ultrasonic frequency of 20 kHz will also be discussed. In Chapter 3, the experimental methods for VHCF studies in air and other environments is described, along with details of instrumentation developed for in situ SEM studies. A detailed description of the influence of microstructure and environment on small fatigue crack growth behavior in Ti-6242S at 20 kHz with respect to the processes responsible for this behavior is presented in Chapter 4. The results of very high cycle fatigue crack initiation experiments of Ti-6242S in both laboratory air and vacuum is presented in Chapter 5. Finally, conclusions and recommendations for future work are detailed in Chapter 6.
6
CHAPTER 2 LITERATURE REVIEW
In this chapter, a review of the literature relevant to understanding the objectives, the approach, and the results of this dissertation is presented. Section 2.1 describes the physical and mechanical metallurgy of alpha and near-alpha titanium alloys, and includes discussion of the relevant processing routes and deformation processes of titanium alloys. A review of work aimed at understanding fatigue behavior in titanium alloys in relation to microstructural effects is described in Section 2.2. Section 2.3 summarizes the findings of studies regarding frequency and environmental effects in fatigue of titanium alloys. Section 2.4 focuses on the oxidation behavior of titanium and titanium alloys in the presence of various gaseous environments, which is critical as it relates to processes that govern environmental effects in fatigue of titanium alloys. Finally, Section 2.5 provides a summary of this literature review, including an identification of open questions, and states the objectives and the approach taken to meet them.
2.1 Microstructure of Titanium Alloys
The physical and mechanical properties of pure titanium and titanium alloys have been studied extensively and many published review papers and books are available which summarize these investigations. This literature review was completed using information from the books
Titanium 2nd Edition by Lutjering and Williams [25] and Titanium and Titanium Alloys by Leyens and Peters [26]. A recent review paper on scientific studies regarding titanium by Banerjee and Williams [27] provided a detailed examination of the current state of titanium research and was a useful resource in the completion of this chapter as well.
7 2.1.1 Physical Metallurgy
As shown in the Ti-Al binary phase diagram in Figure 2.1, pure titanium undergoes an allotropic phase transformation at 882 °C from a hexagonal close-packed phase (α) to a body centered cubic phase (β). The equilibrium phase at room temperature is the α phase and at temperatures above 882 °C the β phase is stable. The temperature of the transformation is called the beta transus (Tβ) and is determined by the alloy composition. By varying the alloy composition and the processing route, it is possible to control the morphology of the microstructure and the volume fractions of the α and β phases. In addition to composition, the mechanical properties of titanium alloys are largely determined by thermomechanical processing and heat treatment. The wide range of microstructures that can be obtained through alloying and thermomechanical processing are generally classified as α, α + β, or β titanium alloys. Figure 2.2 shows examples of different types of titanium alloy microstructures.
Figure 2.1: Ti-Al binary phase diagram illustrating the α stabilizing effect of aluminum alloying [28]
8
Figure 2.2: Micrographs showing the morphologies and length scales of microstructures attainable by control of material composition and thermomechanical processing route [29]
9
The material used in the present study is the near-alpha titanium alloy Ti-6242S with a nominal composition of wt.%. 6Al, 2Sn, 4Zr, 2Mo, 0.1Si, and Ti (balance). Aluminum is a well-known α-stabilizer that raises the Tβ temperature as its concentration is increased. High aluminum content also increases slip planarity. Precipitation of the brittle Ti3Al phase occurs at
concentrations just above 6% aluminum equivalent. Thus, in applications where damage tolerance is a design criterion, titanium alloys having less than 6% aluminum are used. Tin and zirconium are thermodynamically neutral, but preferentially segregate to the α phase and increase the strength of the α phase by solid solution strengthening. Molybdenum is a β-stabilizer that preferentially segregates to the β phase and increases the strength of the β phase by solid solution strengthening. Silicon is also a β stabilizer that forms intermetallic compounds through a eutectoid reaction. Silicon also increases the creep resistance of titanium alloys used in high temperature applications. Interstitial additions of oxygen, nitrogen, and carbon are also possible and strengthen the α phase. However, they are susceptible to forming hard alpha and their concentrations are carefully controlled. Titanium has extensive solubility for oxygen and nitrogen. Because of this titanium alloys do not contain oxide or nitride inclusions that commonly initiate fatigue failure in other structural materials. Hydrogen stabilizes the β phase and forms eutectoids. A review of the effects of different elements on α and β phase stability is shown in Figure 2.3.
The microstructural morphologies that form mainly due to thermomechanical processing are commonly classified as equiaxed α, lamellar α, equiaxed α + transformed β, and Widmanstätten. There are numerous thermomechanical steps needed to form each of these microstructures, but the remainder of this section will focus only on the material properties and mechanical behavior of the equiaxed α + transformed β microstructure, which is the type of microstructure used in the
10
material in this dissertation work. This class of microstructure is also the most widely used in titanium alloys that possess a good balance of strength and toughness.
Figure 2.3: Diagrams showing the effects of various elements on the beta transus in Ti alloys. (a)
α stabilizers, (b) β stabilizers with continuous solubility, (c) β stabilizers with an immiscibility gap in the β phase, and (d) eutectoid systems with intermetallic compound formations [27]
11 2.1.2 Description of Microstructure
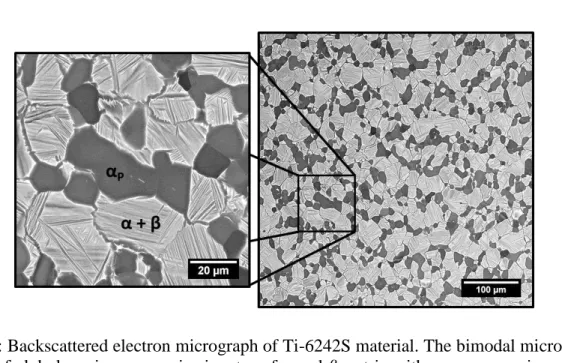
Figure 2.4 shows a high magnification backscattered electron micrograph of the Ti-6242S material used in this work and serves as an example of the bi-modal, or duplex microstructure commonly observed in titanium alloys composed of an equiaxed primary alpha (αp) phase and a transformed β matrix phase. As shown in Figure 2.4, the microstructure consists of several different features ranging in size and shape. Each of these features form in response to the thermomechanical processing steps. The lath α forms in the β phase through an allotropic phase transformation. The orientation of this phase is determined by the Burgers orientation relationship (BOR) between the two phases: {110}β//(0001)α; <11̅1>β//<112̅0>α. This requires that the close packed planes of the hcp α phase are aligned with the close packed planes of the bcc β phase. Because of this, slip is often continuous across the lath α regions. The globular, equiaxed αp grains evolve from the α laths by a spherodization process. The αp phase does not necessarily maintain the Burgers orientation relationship, and as a result slip transfer is not necessarily continuous between αp grains and the β matrix. The main source of strength, strain incompatibility, and stress inhomogeneity in titanium alloys comes from the barrier to dislocation motion represented by α/β interfaces. Because of this, controlling the size, morphology, and volume fraction of the alpha phase in structural titanium alloys is critical to enhancement of mechanical properties [26]. Much of this control is achieved by the thermomechanical processing route, which is discussed in the next section.
12
Figure 2.4: Backscattered electron micrograph of Ti-6242S material as an example of the bimodal, or duplex microstructure which consists of globular primary α grains in a transformed β matrix
2.1.3 Thermomechanical Processing
The exact processing route used to form the material studied in this dissertation is proprietary. However, the general processing route for the production of titanium alloys having a duplex, or bi-modal microstructure is discussed in this section. The titanium alloy used in this dissertation work was processed to minimize microtexture, but it should be mentioned that the relationship between microstructure evolution and microtexture has gained significant interest in recent years. The presence of large microtextured regions, or macrozones of similarly oriented grains, can cause early fatigue failures and more work is needed in understanding the origin of these regions and their influences on cyclic and dwell fatigue behavior. The schematic of various processing paths and the texture developed at key steps is shown in Figure 2.5.
The initial process used in the production of the titanium alloy used in this dissertation is a vacuum arc remelting (VAR) process applied to an ingot several times to homogenize the material and remove impurities. Rotor grade VAR ingots are typically triple melted and often
13
given a homogenization anneal in the β phase field prior to hot working. The times and temperatures vary with alloy, but are typically 200-450 °C above the β- transus (Tβ) for 20-30 hours. Regardless of whether or not a homogenization process is done, the ingot is conditioned by grinding or lathe turning before forging. Once conditioned, the material would have been forged in the β phase field at approximately 150° C above Tβ and then cooled, with the cooling rate determining the width of the α lamellae. A schematic of the processing route for bi-modal microstructures beginning with this step is shown in Figure 2.6. Reheating to a temperature below Tβ and further hot working refines the microstructure. The deformation from this step can lead to crystallographic textures that can strongly influence mechanical properties. A low, or weak texture, such as observed in the material of this study, is obtained by performing this deformation step at a moderate temperature in the α + β phase field. A recrystallization step in the α + β phase field follows this step and has little effect on the crystallographic texture formed in the previous step. Finally, annealing at a moderate temperature in the α + β phase field completes the process.
14
Figure 2.5: Schematic of various processing paths in titanium alloys and the texture developed at key steps [30]
15 2.1.4 Mechanical Behavior of Titanium
There have been numerous studies on the monotonic deformation behavior of pure titanium and titanium alloys to determine the effects of composition, temperature, and microstructure on the inherent strength of the material and the critical resolved shear stress (CRSS) for the various slip planes. Ogi et al. have investigated the elastic moduli of alpha titanium with temperature and the findings are reported in Figure 2.7 [31]. The Young’s modulus of the “c” direction was higher than the “a” direction and all of the elastic constants decreased with increasing temperature.
In α and near-α titanium alloys plastic deformation is extremely anisotropic [32-34]. Plastic deformation behavior is controlled by slip on the basal (0002), prismatic (101̅0), and pyramidal (101̅1) crystal planes as shown in Figure 2.8. Slip generally occurs on these planes in the <a> type directions <112̅0>. These represent four independent slip systems. Satisfaction of the Von Mises criterion for plastic deformation requires five independent slip systems and is obtained by activation of slip that may occur along the c-axis in the <112̅3> direction by <c + a> slip or by deformation twinning. Numerous studies have reported that CRSS for both basal and pyramidal slip are higher than the CRSS for prismatic slip in pure titanium and Ti-Al alloys [25, 35]. Figure 2.9 shows a plot of CRSS of the slip systems versus temperature in single crystals of Ti-6.6Al. It should be noted that slip in α grains still tends to occur by basal or prismatic slip even when well oriented for pyramidal slip.
16
Figure 2.7: Elastic constants of the α phase in titanium as a function of temperature are shown. The Young’s modulus in the “c” direction was higher than the “a” direction. [31]
17
Figure 2.8: Slip systems of α phase titanium, hcp and β phase titanium, bcc are shown. Plastic deformation behavior is controlled by slip on the basal, (0002), prismatic (101̅0), and pyramidal (101̅1) crystal planes of the α phase. [25]
18
Figure 2.9: CRSS for basal, prism, and <c + a> slip in single crystals of Ti-6.6Al as a function of temperature [36]
2.1.4.1 Slip in Ti-Al systems
The CRSS for prismatic slip in Ti-Al alloys has been observed to increase with increasing aluminum composition [37], while the CRSS for basal slip remained constant. The CRSS for basal and prismatic slip was also reported to be equal at 6.6wt% aluminum. This is attributed to the fact that α-stabilizing substitutional elements, such as aluminum and oxygen, increase the atomic packing fraction on basal planes relative to prism planes. Williams et al. [25] also investigated the effect of aluminum on deformation in Ti-Al single crystals with compositions ranging from 1.4 to 6.6% Al in the temperature range 300-1000 K. Similarly, they concluded that the CRSS for basal and prism slip become the same at higher Al concentrations and temperatures. The CRSS for <c + a> slip on the (1122) plane was also reported to be much higher than that for basal or prism slip. Work by Tanaka and Conrad [38] on titanium single crystals also showed that the ratio of CRSS on the basal and pyramidal planes to the prismatic plane decreases with increasing interstitial and aluminum content.
19
Twinning is suppressed and planar slip occurs in titanium alloys that have moderate to high aluminum and oxygen compositions [39, 40]. The decrease in the frequency of the occurrence of twinning is compensated for by the activation of non-basal <c + a> slip. Since <c + a> slip has a significantly higher CRSS than both basal and prism slip (Figure 2.9), crystals loaded parallel or near parallel to their c-axis will have increased strength. The cause of slip planarity in response to Al content is believed to be slip plane softening as a result of a destruction of short range order (SRO). Ordering of oxygen at interstitial sites may also affect slip on basal and prismatic planes [41]. Similar to precipitation hardened systems, regions with SRO provide increased tensile strength at the expense of ductility. Regions with SRO are also theorized to promote slip localization during cyclic loading. A study performed on Ti-7Al indicated that homogenous slip generally led to longer lives under dwell fatigue conditions. In general, fracture surfaces in SRO materials support the existence of greater slip planarity due to particle shearing. Planar slip intensifies in the presence of both Al and O, but the exact processes for how these elements affect slip behavior is not well understood. Planar slip on basal planes has been associated with faceted fatigue crack initiation in many titanium alloys and is discussed in Section 2.2.
2.1.4.2 Summary of Deformation Mechanisms
Titanium alloys plastically deform by slip on basal, prismatic, and pyramidal planes in <a> type directions. In grains that are poorly oriented for <a> slip, plastic deformation can occur by twinning or <c + a> slip. However, twinning is suppressed in titanium alloys that have high concentrations of the interstitial and substitutional elements oxygen and aluminum, respectively. The CRSS for <c + a> slip is also higher than both basal and prism slip, with prism slip often having the lowest CRSS.
20
Slip transfer in the bi-modal microstructure consisting of equiaxed α in a transformed β matrix is a complex process that is not well understood. It has been shown that slip initiates in the equiaxed α phase consistent with Schmid’s law at the surface. In fact, the transformed β regions are believed to contribute only slightly to the yield strength of the material for this reason. Because the deformation is controlled by the αp phase, the focus of most investigations, as well as this dissertation, has been on understanding the mechanisms that govern strain localization, crack initiation, and crack growth as it relates to this phase.
2.2 Fatigue of Titanium Alloys – Microstructural Effects
Several investigations have been conducted in order to develop a better understanding of the fatigue behavior of titanium and titanium alloys [26]. This work has spanned the low cycle to the very high cycle fatigue regimes. However, this section will focus on a review of findings regarding high cycle and very high cycle fatigue behavior of titanium alloys. A discussion of observed mechanisms and processes for strain accumulation, fatigue crack initiation, and early crack propagation as a function of microstructure is detailed. The effects of frequency and environment will be described in the next section.
2.2.1 Fatigue Crack Initiation
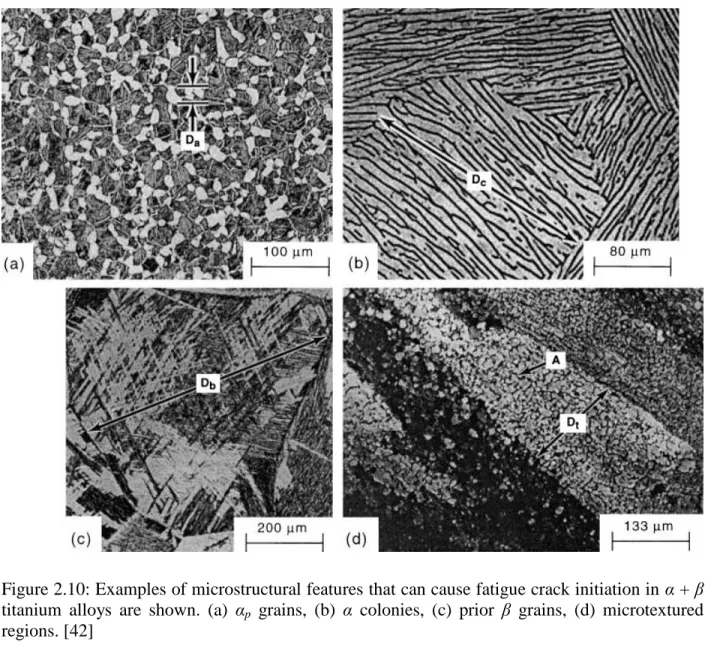
Determination of when a fatigue crack has initiated remains a debated topic and is often characterized by the detection limits of the experimental technique. For example, in the case of scanning electron microscopy this equates to the resolution of the SEM system being used. Another methodology is to define the number of cycles for crack initiation based on when the crack begins to behave as a propagating crack. By this definition, crack initiation will be determined by the scale of the microstructure, which can range from individual α laths to large α colonies. Hall defines these fatigue critical microstructures as crack-like discontinuities (CLD),
21
or the minimum feature size at which the accumulated fatigue damage starts to behave as a fatigue crack [42]. Examples of these features in titanium alloys includes αp grains, α colonies, prior β grains, and macrozones as illustrated in Figure 2.10. In general, the type of microstructure responsible for fatigue crack initiation is determined by both the microstructure and the nature of the fatigue loading.
In materials absent of inclusions and porosity, fatigue cracks will initiate in locations where the local microstructure promotes the accumulation of irreversible slip. A review of the literature on fatigue crack initiation in α and near-α titanium alloys establishes that fatigue damage typically accumulates in the αp phase [43-47]. This is reasonable given that the α phase accounts for the largest phase by volume and has a higher propensity for strain localization than the β phase, which is usually harder due to precipitation strengthening.
The mechanisms responsible for fatigue crack initiation in titanium alloys have been classified as slip band formation in α grains, α/β strain incompatibility, strain incompatibility between adjacent α grains, and damage accumulation across microtextured regions. In the case of the duplex microstructure, the fatigue cracks predominantly nucleated on or near the basal plane of αp grains [44, 48]. However, fatigue crack initiation has been observed to occur on prism planes as well [48]. Additionally, investigators have shown that both basal and prism slip can be activated in the crack initiation region.
The fatigue crack initiation mechanism also varies with stress. At higher stresses, slip bands leading to cracks are formed within the αpgrains or across α colonies, while at lower stresses the
α/β interface is often reported as the initiation site. This is reasonable given that at low stresses it is expected that the required amount of damage needed to initiate a crack may not be attainable within a single microstructural element. Because of this, it is expected that barriers to slip
22
activity such as grain or colony boundaries may play a critical role in the crack nucleation process by causing strain localization, or dislocation pile-ups at these boundaries. Regardless, the damage accumulation within the α phase leads to the eventual fatigue crack initiation.
The presence of facets at the fatigue crack initiation site has been reported by many researchers [43, 49-52]. The plane normals of these fatigue facets are nearly parallel to the loading direction. For example, Slavik et al. examined the orientation of fatigue fracture facets in Ti-6246 using a combination of tilt fractography and EBSD [53]. They showed that facets near the fatigue crack initiation site tended to have facet normals nearly parallel to the loading axis under both cycle and dwell fatigue conditions. The facets occurred on near-basal planes with their c-axis within 15° of the loading direction, especially in the case of fully reversed loading conditions. However, specimens failed under monotonic tension mostly had facets with facet normals oriented 40°- 50° from the loading axis. This behavior was explained using a modified Stroh model first proposed by Neal and Blenkinsop [54] to account for fatigue cracks that were observed to initiate from facets that formed in α grains or colonies with their basal plane normals oriented to the loading axis. Stroh originally proposed this model as a fracture mechanism in the case of monotonic loading of metals [55]. In the modified model for fatigue, hard-soft grain pairs are theorized to be preferential sites of fatigue crack nucleation. Grains that are favorably oriented for prismatic slip, termed “soft”, develop shear stresses in an adjacent grain that has no easy slip systems, or a “hard” grain. Primary α grains with basal plane normals oriented parallel to the loading axis are prime candidates to serve as hard grains for load shedding from the soft neighbor grain by dislocation pileup. Eventually, the stresses become high enough in the hard grain to cause slip or cracking by operation of a pseudo cleavage mechanism. This modified form of the Stroh mechanism to account for cyclic loading is shown in Figure 2.11. Work by
23
Bantounas et al. on fatigue crack initiation behavior in Ti-6Al-4V supported this model [52]. Faceted fatigue crack initiation failure was associated with grains having their c-axis orientations near (15° - 40°) the loading axis direction. Recently, work by Brandes et al. [56] which investigated fatigue behavior in Ti-7Al reported that facet formation on basal planes did not require the presence of a hard-soft grain pair. Soft-soft grain pairs were also shown to result in faceted fracture. A summary of the pairings for which facet formation was observed is shown in Figure 2.12. These “defects” represent examples of how fatigue cracks initiate from a neighborhood effect rather than from an individual grain. However, it is important to recognize that much of our understanding of fatigue crack initiation mechanisms is linked to surface observations. Tools and methodologies that enable subsurface examination of the critical microstructural features for fatigue crack initiation are becoming more widely utilized.
24
Figure 2.10: Examples of microstructural features that can cause fatigue crack initiation in α + β titanium alloys are shown. (a) αp grains, (b) α colonies, (c) prior β grains, (d) microtextured regions. [42]
25
Figure 2.11: Schematic of Stroh model for planar slip leading to fatigue crack initiation [57]
Figure 2.12: Schematics of examples of neighbor grain configurations for which basal plane facet formation was observed. Hard-soft grain pairs are thought to be the most detrimental to fatigue life. [56]
26 2.2.2 Small Crack Growth Behavior
The phenomenon of small or short fatigue cracks was first studied by Pearson [58]. It was observed that short crack growth rates and long crack growth rates did not correlate using linear elastic fracture mechanics. Since then, many researchers have studied small crack growth behavior and fatigue life prediction based on fracture mechanics [59-64]. It is commonly accepted that small cracks grow at higher crack growth rates than long cracks under the same nominal driving force, and can grow at stress intensity factors below the long crack threshold (“the small crack effect”). In general small cracks are defined in one of the following ways [62].
(1) Microstructurally small cracks: Cracks small compared to microstructural dimensions (2) Mechanically small cracks: Cracks small compared to the scale of local plasticity (3) Physically small cracks: Cracks are simply physically small (< 1mm)
(4) Chemically small cracks: Cracks can be up to 10 mm long, depending on the crack-tip environment
In this dissertation work, as in much of the literature, the terms “small” and “short” are used synonymously. A schematic fatigue crack growth rate dc/dN vs. ΔK plot that highlights the problem of small cracks is shown in Figure 2.13.
The cause of the small crack effect is not well understood. Suggested causes for the observed faster crack growth rates compared to longer cracks are the absence of crack closure effects and a breakdown of microstructure similitude. The significant variability of crack growth rates for small cracks growing in the near threshold regime is generally attributed to microstructure dissimilitude, characterized by a situation in which the crack front does not sample enough grains to be indicative of the average material properties. In such cases, the properties of the individual grain in which the crack is growing become critical to crack growth behavior.
![Figure 2.5: Schematic of various processing paths in titanium alloys and the texture developed at key steps [30]](https://thumb-us.123doks.com/thumbv2/123dok_us/1404961.2688080/40.918.145.776.110.578/figure-schematic-various-processing-titanium-alloys-texture-developed.webp)
![Figure 2.9: CRSS for basal, prism, and <c + a> slip in single crystals of Ti-6.6Al as a function of temperature [36]](https://thumb-us.123doks.com/thumbv2/123dok_us/1404961.2688080/44.918.241.633.109.437/figure-crss-basal-prism-single-crystals-function-temperature.webp)
![Figure 2.11: Schematic of Stroh model for planar slip leading to fatigue crack initiation [57]](https://thumb-us.123doks.com/thumbv2/123dok_us/1404961.2688080/51.918.230.699.108.978/figure-schematic-stroh-model-planar-leading-fatigue-initiation.webp)