Multitemporal assessment of crop parameters
using multisensorial flying platforms
Dissertation
zur
Erlangung des Doktorgrades (Dr. rer. Nat.)
der
Mathematisch-Naturwissenschaftlichen Fakultät
der
Rheinischen Friedrich-Wilhelms-Universität Bonn
vorgelegt von
Dipl.Biol. Andreas Burkart
aus
Düsseldorf
2 Angefertigt mit Genehmigung der Mathematisch-Naturwissenschaftlichen Fakultät der
Rheinischen Friedrich-Wilhelms-Universität Bonn 1. Gutachter: Prof. Gunter Menz
2. Gutachter: Prof. Uwe Rascher Tag der Promotion: 21.09.2015 Erscheinungsjahr: 2016
3
Abstract
Agriculture is the source of food for mankind. The increase of yield and the efficient use of resources are key elements for a sustainable food production. This increase is essential to fulfill the demand of the earth´s growing population. In the present study we investigated the opportunities and challenges of unmanned aerial vehicle (UAV) based measurement systems that can provide detailed data on agricultural crops. This novel way of rapid data acquisition with high spatial resolution opens up new possibilities in precision farming and management of huge breeding experiments. In total 4 studies were carried out which investigated key elements for the retrieval of valid remote sensing data from optical UAV sensors. A spectrometer was developed to be carried by an octocopter UAV and its calibration and quality assessment are presented. Over a spectral range from 350 nm to 800 nm, the UAV spectrometer has shown excellent correlation with ground based reference instruments (r² > 0.99), while having a 6 time smaller standard deviation.
In a second experiment four different UAV sensors suitable for precision farming (Sony NEX-5n RGB camera; Canon Powershot modified to infrared sensitivity; MCA6 Tetracam; UAV spectrometer) were compared over differently treated grassland. The high resolution infrared and RGB camera allows spatial analysis of vegetation cover while the UAV spectrometer enables detailed analysis of spectral reflectance at single points. The high spatial and six-band spectral resolution of the MCA6 combines the opportunities of spatial and spectral analysis, but requires huge calibration efforts to acquire reliable data. All investigated systems were able to provide useful information in different distinct research areas of interest in the spatial or spectral domain.
The UAV spectrometer was further used to assess multiangular reflectance patterns of wheat. By flying the UAV in a hemispherical path and directing the spectrometer towards the center of this hemisphere, the system acts like a large goniometer. Other than ground based goniometers, this novel method allows huge diameters without any need for infrastructures on the ground. Our experimental results shows good agreement with models and other goniometers, proving the approach valid.
UAVs are capable of providing airborne data with a high spatial and temporal resolution due to their flexible and easy use. This was demonstrated in a two year survey a high resolution RGB camera was flown every week over experimental plots of barley. From the RGB imagery a time series of the barley development was created using the color values. From this analysis we could track differences in the growth of multiple seeding densities and identify events of plant development such as ear pushing. These results lead towards promising practical applications that could be used in breeding for the phenotyping of crop varieties or in the scope of precision farming. With the advent of high endurance UAVs such as airships and the development of better light weight sensors, an exciting future for remote sensing from UAV in agriculture is expected.
4
Content
Abstract ... 3
Introduction ... 5
Methods and Instruments ... 8
The UAV Platform ... 8
The UAV sensors and their calibration ... 10
RGB Camera ... 10
UAV spectrometer ... 12
Field sites and experimental setup... 14
Comparison of UAV sensors experiment ... 14
Multiangular experiment ... 15
UAV image time series of barley ... 16
Results and discussion ... 18
Comparison of UAV sensors ... 18
Multiangular effects on optical UAV data ... 20
UAV image time series of barley ... 22
Outlook on UAV based sensors for precision farming and phenotyping ... 24
Conclusion ... 26
Acknowledgements ... 27
References ... 28
Appendix
A1: A novel UAV-based ultra-light weight spectrometer for field spectroscopy
A2: Deploying four optical UAV-based sensors over grassland: challenges and limitations
A3: Angular dependency of hyperspectral measurements over wheat characterized by a novel UAV based goniometer
A4: Author´s additional scientific work Peer reviewed paper
5
Introduction
The ultimate goal of agricultural research is the sustainable provision of food to mankind for now and in the future. As the population continues its exponential growth, agriculture has to face the huge task of feeding 9 billion until the middle of this century (Godfray et al. 2010). In history, more crop output was achieved by transforming wilderness into farmland. By applying crop rotation, fertilizer and pesticides, the productivity of the available area was further enhanced leadi g to the g ee e olutio (Cassman 1999; Evenson and Gollin 2003). In recent decades the huge potential of breeding and genetic engineering has generated another gain in yield (Tester and Langridge 2010; Fischer and Edmeades 2010). But the capabilities of traditional techniques to increase agricultural production are reaching their limits and must be complemented by new methods to sustain the steady gain in yield (Jain 1986; Reilly and Fuglie 1998). But as improving the yield is converging the limit and environmental issues arise from the extensive use of fertilizers and herbicides, the optimization of the use of resources is coming into the focus of the farm management. So new approaches can be identified to further optimize the overall efficiency of agricultural food production.
In this context two recent approaches are promising to complement the work of crop breeders and farmers.
1) Precision farming makes use of precise and current knowledge about spatial heterogeneity of the farmlands as well as the current state of crop development. By the adaptive use of fertilizers and pesticides, the farmer applies only the necessary amount. This strategy has a huge potential for saving valuable resources (McBratney et al. 2005). However, the farmers are in need for accurate sensing technologies which support the decision making by detailed spatial and temporal information about the plants development (Auernhammer 2001). These methods must be available on short notice and must be able to cover large areas within short times, to deliver the necessary data to the decision makers in almost real time.
2) Phenotyping characterizes the development of a plant under different environmental conditions. While the genotype of a crop is fixed as a variety, the phenotype of a crop can show extreme variations as a result of its surrounding parameters such as soil, fertilizer, pathogens and weather (Araus and Cairns 2014). The phenotype is the main driver for plant productivity. So breeders are finally interested in optimizing phenotypes for specific conditions, rather than genotypes that may react in unpredictable ways under changing environments. The problem is, that the amount of possible phenotypes of a plant is very numerous, as the permutation of environmental conditions are endless. To encounter this challenge high throughput phenotyping methods are necessary, that can screen thousands of plants and identify relevant breeding traits (Fiorani and Schurr 2013). Using phenotyping the impact on the plants of the relevant environmental conditions, which define the present ecosystem or will be occurring throughout the global climate change can be assessed. Phenotyping efforts go from lab, to greenhouse and finally to field level. To survey large agricultural phenotyping fields, devices and sensors are required, that deliver detailed temporal and spatial information on the planted phenotypes on a regular base.
The recent development of Unmanned Aerial Vehicles (UAV) provides platforms, which allow to place light weight sensors over agricultural fields. By changing the perspective to view of a whole field from above, new insights become possible. This opens the door for a whole new information technology that is going to change the way farmland is managed in the future. The development of high powered and light weight batteries, together with miniature attitude sensors, coupled with high efficiency electric motors and data
6 processing devices enabled the construction of a new class of flying vehicles. So called multicopters have from 3 to 16 rotors delivering vertical thrust to lift the vehicle in the air. At the same time, by accurately controlling each single motor, the UAV can perform directional maneuvers and allows defined positioning in the 3D space. The ability to hover over a fixed position is the main difference to airplanes that on the other hand have longer endurance and can cover larger areas (J. A. J. Berni et al. 2008). Both concepts are widely used in science and first steps are undergoing towards commercial use (Anderson and Gaston 2013).
The UAV only acts as a platform, in other words it is a versatile tripod that enables the positioning of a sensor almost everywhere over agricultural fields. By observing areas of interest from a nadir perspective, comparison of spatially distributed plant traits is straight forward, compared to an oblique view. While common RGB cameras already enable outstanding insights, if positioned above agricultural fields (Sakamoto et al. 2012; Juliane Bendig et al. 2014), other sensor types allow complementing analyses. The technical development towards small high performance electronics recently allowed the production of thermal cameras that can be carried by UAVs to detect water stress (P. J. J. Zarco-Tejada, González-Dugo, and Berni 2011). Furthermore, multispectral cameras allow the detection of distinct spectral bands that bear information on various plant parameters (Kelcey and Lucieer 2012). Exceeding a few multispectral bands, spectroradiometers look at the full spectrum of reflected light. Just recently spectrometers became available, which are both, highly accurate and light weight, which makes them suitable for the use on UAVs. These devices allow the deepening of insights into the plant´s structure and biochemistry (Milton et al. 2009) via collecting hyperspectral reflectance measurements of plants.
In remote sensing, the concept of reflectance is used to describe the measurable interaction of incident light with the land cover. For top of canopy measurements, the formula for reflectance is the quotient of upwelling reflected radiance by incident irradiance (eq.1).
. � � ��� = � � ����� ���
When observing vegetation, reflection is strongly associated with the plant´s architecture, biochemistry and growth state (Knipling 1970; Sims and Gamon 2002; Asner 1998). By using cameras or spectrometers, the reflectance can be investigated in the visible or near-infrared (NIR) spectral range. In addition, the thermal range can be observed using thermal cameras. The visible light, however, is the driver for photosynthesis. Thus, a vast amount of relevant information about the plants can be derived from the visible range of light (wavelength range 400 nm – 700 nm) (Peñuelas and Filella 1998). The continuous spectrum of a plant´s reflectance has distinct spectral regions that are known to represent information about the plant´s condition. These regions are commonly exploited using so called Vegetatio I di es (VI), which rely on two or more single bands of the continuous spectrum. The most prominent VI is the normalized differentiated vegetation index (NDVI), which is based on comparing the red and NIR range of reflection (Blackburn 1998). An increasing number of VIs has been developed which correlate to different plant traits (Bannari et al. 1995) or plant diseases (Mahlein et al. 2013). But reflectance mirrors not only the plant´s properties, it is also dependent on variations of the measurement setup, such as sensor-illumination geometry. The so called Bidirectional Reflection Distribution Function (BRDF) is the theoretical base to describe the effects of the geometry of the measurement setup in relation to the investigated surface (Nicodemus 1965; Schaepman-Strub et al. 2006). The angular reflection properties of a surface covered with plants is largely dependent on the structure of the plants and the illumination conditions.
7 The Influence of such effects must be understood to eliminate their impact on the actual plant parameter that could be estimated from the reflectance measurement.
The retrieval of small differences in the reflectance of the plants is necessary to detect relevant differences in traits. But to identify these small differences the quality of the measurements must allow such discrimination. However, field measurements under outdoor conditions are prone to a large variety of undesired influences, which increase uncertainty. These can be divided in three categories which have to be addressed separately to achieve a high quality of data acquisition:
1) Environmental factors such as changes in light conditions by clouds, different sun elevations or strong wind, can alter the reflection signal of plants.
2) Instrumental characteristics are the limiting factors in data retrieval. Depending on the type of sensor a full quality assessment has to be performed that delivers spatial and spectral accuracy as well as a quantification of instrumental errors. A well characterized sensor produces data with known quality and uncertainty which is the essential base for the estimation of plant parameters. 3) Measurement protocols that are suited to the given environmental factors and instruments characteristics need to be developed to insure consistent data quality. By intelligent design these protocols can eliminate issues of the sensors that would otherwise appear in the data.
Additional awareness has to be given to metadata. All acquired sensor data is worthless without an adequate context. For phenotyping experiments as well as observational studies of agricultural fields, the measurements must be adapted to the given circumstances. Experimental treatments and meteorological conditions must be known. Only proper knowledge about the actual condition of the plant at ground level leads to meaningful analysis of any airborne sensor data. In this study, the new field of UAV-based remote sensing of agricultural crops and its opportunities are explored. But as outlined in the introduction a couple of challenges stand between the plants, the UAV based method and the desired results. This leads to the main task of this study:
Ide tifi atio of ke ele e ts fo the et ie al of alid e ote se si g data f o opti al UAV se so s. Along with this question we carried out different studies: 1) a UAV platform for agricultural research was introduced and heavily tested. It is based on a commercially available octocopter and was used throughout the three years of this study; 2) different optical sensors such as a RGB camera or a spectrometer were calibrated and tested to retrieve meaningful results from the raw data; 3) a novel UAV-based spectrometer was developed and tested. This first small UAV based flying spectrometer was intensively calibrated and its performance was assessed compared to ground based standard instruments; 4) the influence of angular effects on hyperspectral data was investigated to contribute to the efforts of understanding the impact of such effects on vegetation. The novel method presented in this study was based on an UAV spectrometer and allows the coverage of larger areas as compared to common ground based tools for angular measurements; 5) time series of UAV imagery of an agricultural experiment were analyzed over two vegetation periods. With this dataset it was possible to track the development of crops with high spatial and temporal resolution and to extract meaningful parameters referring to growth-stages. In summary, we give an outlook on future scientific opportunities and possible applications in this rapidly developing field of plant science and remote sensing.
8
Methods and Instruments
The UAV Platform
In this study, it was intended to acquire a mature flying platform that enables the user to focus on sensors and the scientific work itself, rather than design and build an UAV from scratch. So the various flying systems that are currently available on the market (Anderson and Gaston 2013) were compared and evaluated after their suitability for the present work. The following key parameters should be fulfilled by the UAV: 1) a payload of more than 500 g; 2) simple handling, which includes fast setup and a small form factor for the ease of transportation; 3) autonomous control of a stable and reliable flight, which relieves the operator from stressful piloting work; 4) low risk for injuries for the operator and third persons; 5) hover over a point and vertical take-off capability. Following this list of requirements, we decided to acquire the Falcon-8 UAV (Ascending Technologies, Krailing, Germany). Furthermore this UAV has a good reputation in the scientific community and was successfully used in various previous studies (Israel 2012; Eisenbeiss and Sauerbier 2011; Wefelscheid, Hänsch, and Hellwich 2012).
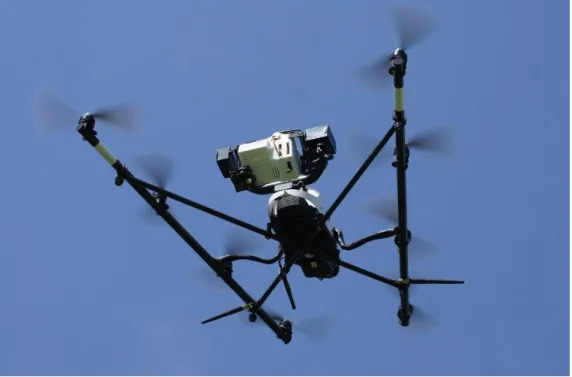
Fig. 1 Falcon-8 UAV used within the present study, during flight, equipped with the UAV spectrometer.
Design and Handling – The Falcon-8 (Fig. 1) is a rotary wing copter with 8 propellers that weighs approximately 1.8 kg including payload. The unique V-shaped motor arrangement allows the sensors to look down, as well as forward or upwards, without components of the UAV inside the field of view. This feature enabled the ultia gula e pe i e t [A3]. The UAV has an actively stabilized gimbal to correct the orientation of the sensor against the UAVs movements. This gimbal can be exchanged quickly to mount different sensors, facilitating the o pa iso of UAV se so s [A2]. The sophisticated flight stabilization system lets the UAV fly almost autonomously, which makes flying an easy job that can be done by anyone with little training. This allows, the operator to focus on scientific work. In contrast to various earlier studies (P. J. J. Zarco-Tejada, González-Dugo, and Berni 2011; Mitchell et al. 2012), the Falcon-8 and its sensors could be controlled by a single person. The system performed well during three years of operation and several hundred flight hours. The compact design allows to store the UAV in a case, which fits in the back of a car and is suitable for air-mail. By this, we could use the UAV at various sites in Germany as well
9 as throughout Europe (France, Spain, Portugal, Italy) and New Zealand. A software package for waypoint planning is included with the UAV, that enables semi-autonomous flight of the device, as well as sensor triggering.
Accuracy – For precision farming and phenotyping, an accurate positioning of the UAV and a proper pointing of the optical sensor are critical to investigate the area of interest. The positioning of the UAV during autonomous waypoint flight is based on GPS data and is commonly given within 10 m deviation from the actual desired position. During the study [A3] we tested the positioning and pointing accuracy of the UAV, using a 3D reconstruction approach (Structure from motion, Agisoft Photoscan, St. Petersburg, Russia), based on multiple images of the same scene shot by the UAV´s high resolution RGB camera. Using this, the error in waypoint flights could be assessed and is given in Tab. 1.
Deviation of: Heading [°] Camera Tilt [°] Altitude [m] Position X [m] Position Y [m] Average 0.11 6.07 0.03 -1.15 -2.22
SD 8.67 1.22 0.70 0.68 0.82
Max 26.20 9.74 1.44 0.67 -0.39
Min -17.99 3.68 -1.09 -2.79 -4.60
Tab. 1 Accuracy of the UAV pointing and positioning calculated by structure from motion using 75 high resolution RGB images.
Robustness– The UAV was extensively used during the three years of this study and often performed multiple flights per day. No hardware related critical failure was observed in this period. One serious crash, due to the operator, who ignored battery warnings happened with structural damage to the UAV itself, but without harm to the payload. An in-field repair using tape and wire could restore flying capability to complete the ongoing experiment. The UAV was sent for maintenance and calibration to the manufacturer once a year.
Legal issues– Within Germany a couple of legal issues had to be solved for scientific/commercial use of small flying platforms that are below 5 kg of take-off weight. The operator has to prove experience in the handling of remotely controlled aircrafts. An insurance that covers eventual damage of third parties has to be filed as well. With this prerequisites, an official license can be requested from the Deze at Luft e keh , Bezi ks egie u g Düsseldo f , which allows the use of the specific UAV in flying altitudes of up to 100 m above ground level. The landowner, however, has to agree with the flying activities on his property. Flying above persons is strictly forbidden, as well as flying at night. Each mission has to be logged in a flight book.
Efficiency– The flying time is one of the major limitations of rotary wing UAVs. As compared to planes or airships, their extremely inefficient way of flying, requires huge amounts of energy. This electrical power is stored in batteries, which are heavy and thus again decrease the flight time. With the Falcon-8 flight times of up to 16 minutes were achieved, depending on the payload. But for safety reasons we limited the mission time to 10 minutes, since a depleted battery is the main risk for crashes. Within the work with the UAV up to 9 additional batteries were acquired that could be exchanged in seconds after landing of the UAV. This way multiple sequential flights could be performed. The coverage of large areas (bigger than 1 km²), however, is an extremely big effort with the Falcon-8 and for these purposes fixed wing UAVs (planes) are preferable.
10
The UAV sensors and their calibration
RGB Camera
The sensor that is most often used in current UAV studies is a common consumer RGB digital camera. These cameras are light-weight, have a high resolution of multiple megapixels, are equipped with a SD card to save images and have a built-in battery. These cameras are designed to capture similar information as the human eye does. This is achieved by employing the three channels red, green and blue for each pixel, by inserting a so called Bayer-Matrix (Bayer 1976) filter in front of a monochrome Charged Coupled Device (CCD). The spectral transmittance of the Bayer-Matrix mimics the sensitivity of the receptor cells for red, green and blue light in the retina of the human eye. This implies that from a RGB picture, in theory, all information can be derived that can be derived by human vision. Installing a camera on a UAV enhances the human vision by flying it towards points and perspectives of interest that are otherwise hard to reach. For agriculture, with a focus on phenotyping and precision farming, this means rather than walking through never ending fields with countless plots, a single picture taken from above describes the whole experiment. A RGB camera can give information about spatial distribution of plants, their color and by employing post-processing methods 3D information can be derived (Juliane Bendig et al. 2014). To use a camera on an UAV for scientific purposes to generate meaningful data, a couple of modifications, calibrations and in-field preparations are necessary. This is essential to finally transform the raw imagery of the camera into useful values of reflectance which represents information about the plant state.
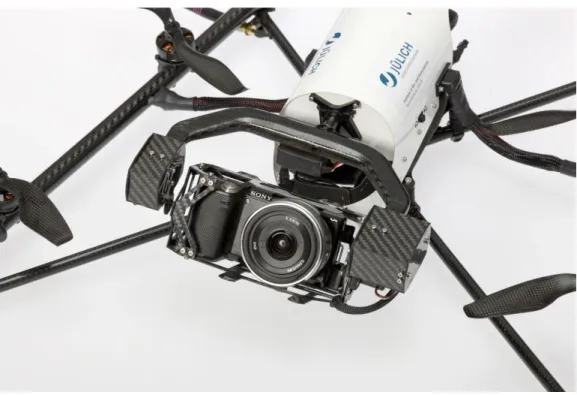
Fig. 2 Sony NEX-5n camera attached to the Falcon-8 UAV. Image provided by Ralf-Uwe Limbach.
UAV Integration– In this study, we use a Sony NEX-5n (Sony Cooperation Inc.) with a 16 mm fixed lens. The camera features 4912 x 3264 pixels. The field view is 73° x 53°, which leads to an observation area of approximately 150 m by 100 m from a flying altitude of 100 m over ground. At the same altitude a spatial
11 resolution for a single pixel of 30 mm by 29 mm, is achieved in theory. This resolution is often not reached in the image due to the quality of the optical path, and largely depends on the environmental parameters such as illumination conditions and wind. This camera was modified by Ascending Technologies, to be integrated into the Falcon-8. The LCD display on the back of the camera was removed and the image is directly streamed to the ground control station. The operator has a life-view of the camera and can assess shutter speed or ISO from the ground. Triggering of the camera is done either manually by a button on the remote control, or by the UAV itself, whenever it reaches a waypoint. The vertical pitch angle is accurately defined within one degree of precision by the operator during flight, or can be set in a preprogrammed waypoint flight.
Calibration– Depending on the further use of the acquired UAV imagery, the camera must be properly calibrated in the lab and with additional in-field methods [A2]. In this study we use the RGB camera for 1) color analysis and 2) 3D scene reconstruction. To derive valid color analysis from JPG images that are captured with automatic camera settings (eg. automatic shutter speed, ISO or white balance), the camera must be characterized for vignetting effects and color references must be present in each image (Lebourgeois et al. 2008). The vignetting effect appears in an image with darker edges compared to the center. This is dependent on the quality of the lens and can have a large impact on the derived color values. To correct for the vignetting effect, we employed an averaging approach. By averaging more than thousand fully different images of various scenes, the only information that remains is the lens dependent vignetting effect. By applying the inverse of this averaged vignetting image (Fig. 3) to the images of interest, the effect of the vignetting is removed.
Fig. 3 RGB image averaged from >1000 different images. The image represents the vignetting pattern of the Sony NEX-5n 16 mm lens camera setup. The corners and edges appear slightly darker than the center of the image.
To solve the problem of different illumination conditions (cloudy, sunny) and the cameras automatic white balance, colored targets on the ground were used (Sakamoto et al. 2012). These targets, which consist of colored squares of different reflectivity, which remain rather stable over the years. Using their colors as
12 reference, influence of illumination on the images of interest can be corrected, as long as the references are visible in the images.
To derive 3D models via structure from motion, we used the software Agisoft Photoscan. This is an enhanced processing tool that incorporates the calibration of the optical path of a camera, based on the images that are processed. In other words, all calibration procedures are performed by the software and the user just supplies multiple images of the ROI from different positions. The software then calculates the 3D scene including camera positions and the structure of the surface. This is used in an increasing number of scientific studies for a variety of surfaces from landfills to agricultural fields (Juliane Bendig et al. 2014; Siebert and Teizer 2014).
UAV spectrometer
At the time of this study, no spectrometer has been deployed on a small rotary wing UAV. As field spectroscopy using hand carried spectrometers (Milton 1987), as well as plane based airborne systems (Birk and McCord 1994) are frequently used with good results, the approach of mounting a spectrometer on a UAV system was highly promising. A UAV based spectrometer would not only facilitate speed of measurements compared to hand spectrometers, but it would also enable the spectrometer to be flown over hardly accessable areas and without disturbing eventual ground cover. To measure reflectance, several prerequisites have to be fulfilled: 1) the spectrometer needs a controller, that triggers via remote connection or at waypoints; 2) a reference must be available that allows to calculate the irradiance, while the flying spectrometer measures the upwelling reflected irradiance; 3) the whole system must be properly calibrated with a focus on influences that might arise from the implementation on an UAV; 4) accurate georeferencing must be available by the flying platform or an attached inertial measurement units (IMU). Latter is essential to allocate the field of view of the spectrometer to the actual measured spot in the field.
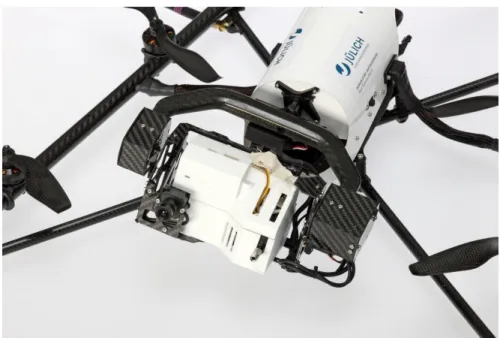
Fig. 4 UAV spectrometer Version 1, attached to the Falcon-8 using an active gimbal that stabilizes the viewing direction against the movement of the flying platform. Image provided by Ralf-Uwe Limbach.
13
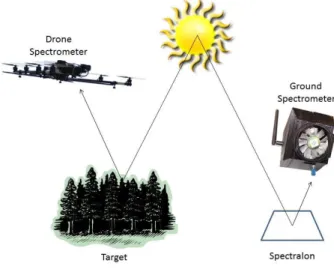
Design – The development of the UAV spectrometer (Fig. 4) as well as practical testing and calibration is described in [A1]. In the following, an overview about the critical parts of the work with the UAV spectrometer is given, which serves as base for the later comparison to the other optical UAV sensors [A2] and the multiangular experiment [A3]. The limiting parameter for an UAV based sensor is weight. The Falcon-8, used for this instrument cannot lift anything that exceeds 500 g. At the time of the study, the Ocean Optics STS micro spectrometer (STS) became available. This device weighs only 68 g. It has up to 1024 spectral bands in the wavelength range from 300 nm to 800 nm and a field of view of about 12°. It provides a performance in spectral resolution and signal to noise similar to larger units, so we decided to base the UAV spectrometer on this unique device. The STS, however, does not provide the capability of saving spectra, nor has a battery for autonomous operation. To solve this problem, we designed a small control unit based on an open source Arduino microcontroller (Banzi 2008). This control unit provides data storage for spectral data on micro SD card and triggers the spectrometer. Via a wireless remote connection, the user can set the integration time and receive a draft of the last acquired spectrum. Spectrometer and control unit are both powered by a 1.000 mAh 3.7 V lithium polymer battery, which keeps the system running for about 4 hours. Thereby, the UAV spectrometer is fully independent from the UAVs electrical system. We further integrated the option to automatically trigger the spectrometer when the UAV reaches a predefined waypoint. Using the UAVs waypoint planning software, a fully automatic operation of the spectrometer on board of the Falcon-8 could be achieved. To measure reflectance, a second spectrometer is placed on the ground, which measures the incident radiance over a white reference, at the same time, the UAV spectrometer is triggered (Fig.5). Thereby, the impact of changing illumination conditions during flight can be eliminated. By this measurement protocol, the spectrometer system is also almost independent from atmospheric influence, as the UAV´s flying altitude is usually between 10 m and 30 m. Both spectrometers, however, must be thoroughly inter-calibrated to warrant high data quality.
Fig. 5 reflectance measurements conducted with an airborne spectrometer over forest and a ground based device over a white reference, both wirelessly synchronized to adapt to changing light conditions.
Calibration –Additionally to common calibration efforts that must be addressed in every spectrometer (Schaepman and Dangel 2000), a technique after Kuusk (J. Kuusk 2011) was applied, to remove the influence of dark current (DC) from the raw data. The DC is an underlying noise that is introduced by electrical effects in the linear CCD which converts incident light quants into electrical current. Commonly
14 the DC is measured and subtracted by closing the spectrometer´s optics to characterize its DC excluding light. But the light weight STS has no internal shutter, nor is it possible to cover the optics during flight. The noise is largely dependent on the temperature of the device and integration time (IT). By measuring the DC with different IT and raising temperature, a model was developed that estimates the DC of every single pixel depending on actual IT and temperature. Thereby, we could eliminate the effects of DC for each spectrum, even though environmental conditions might affect the temperature of the device. Because we rely on two spectrometer units, both must be inter-calibrated, because they have slightly different responses in spectral shift and sensitivity. The spectral shift is a mismatch of wavelengths and was corrected by using the software SPECCAL (Busetto et al. 2011), which exploits the defined positions of Fraunhofer lines in the solar spectrum. The different sensitivities of the two spectrometers were assessed by measuring the same lambertian reflectance targets (Spectralon) under equal illumination conditions. A correction factor that accounts for this linear difference is then applied in the post-processing.
Test– To check the practical use of the instrument and its performance compared to ground based field spectrometers, a field experiment was conducted. The same agricultural areas were measured at approximately the same time of the day with an ASD field spectrometer and the UAV-based spectrometer. The measurements were performed in a way that the same areas were covered. After post-processing, the results were compared [A1].
Field sites and experimental setup
Comparison of UAV sensors experiment
A variety of optical sensors that are suitable for UAVs are available on the market. These sensors range from simple consumer RGB cameras towards more complex multispectral systems to expensive hyperspectral line scanners or snapshot cameras. However, most of these sensors, are novel and poorly characterized. To evaluate, which sensor is most applicable for specific research questions, we chose 4 different devices, which were available at the time of the study, for an in-field comparison experiment. In [A2] the Sony NEX-5n, a converted Canon Powershot sensible to infrared, a MCA 6 Tetracam (Tetracam Inc., Chatsworth, USA) multispectral camera and one UAV spectrometer [A1] were inter-compared over different types of grassland. In the following section we will focus on the Sony-NEX-5n RGB camera and the UAV spectrometer, as they were the primary sensors used in the other presented studies of this work.
Setup – The study site was a dairy farm of the Massey University in Palmerston North, New Zealand (lat. - 40.376, long. 175.606). Flights were performed in February 2013 around noon at a clear blue sky day. The RGB camera and the UAV spectrometer were flown on board of the Falcon-8 by exchanging gimbal and sensor straight after landing. We chose 8 waypoints which were resembling different grassland conditions from dry to irrigated. Along with the UAV sensors, a handheld spectrometer (ASD handheld 2, ASD. Inc) was used to characterize the spectral signature of the observed WPs with a standard method. The UAV spectrometer was used with its ground reference as described in [A1]. To refer the RGB images of the camera to reflectance, big colored tarps were put in the field of view. Using the handheld measurements of reflectance over the reference targets, the RGB images could be converted into
15 estimates of actual reflectance, using the empirical line method (Smith and Milton 1999). Both sensors, RGB camera and UAV spectrometer were calibrated as described before. The reflectance values as derived from the two sensors and postprocessing chains, were compared and their correlation over the eight waypoints was assessed. As a spectral 3 band, but high spatial resolution RGB camera is compared to a single point hyperspectral radiometer, fully different scientific analyses can be performed. These possible applications were identified, according to the sensors capabilities.
Multiangular experiment
Angular effects that are the result of the trigonometry in the illumination-surface-sensor setup are an intensively studied field of remote sensing (Liang et al. 2000). Various earlier studies have performed ground-, plane- and satellite based research that led to an understanding of angular effects on the macro (Comar et al. 2012) or landscape scale (Verrelst et al. 2008). But vegetation canopies are subject to continuous change, thus a high temporal resolution of angular measurements is necessary to understand the underlying effects. At the same time the small spots that can be assessed by ground based angular measurement instruments are often too small to represent the whole canopy. This is why we developed the novel approach of an UAV based goniometer. Goniometers are devices that allow to characterize the angular reflectance properties of a surface by changing the angle of view of the sensor around a fixed center point of interest. For homogeneous surfaces such as snow or sand, small goniometers are suitable (Bourgeois et al. 2006). But for more structured surfaces such as vegetation, larger fields of view are necessary, as the angular effects arise from the complex 3D structure of the canopy. Common ground based goniometers are limited in size and thus in their field of view. With the UAV based approach, the goniometer is replaced by a distinct flight pattern. This flight pattern along with the viewing angle of the spectrometer enables the investigation of a center point from different directions, as shown in Fig. 6.
Fig. 6 exemplary path as flown by the UAV over an agricultural area to act as a goniometer. On each nook of the flight pattern, the UAV stops and points and triggers the spectrometer towards the center of the hemisphere, described by the path.
16 The experiment was performed over a wheat field at Merzenhausen, Germany (lat. 50.93039, long, 6.29689), at a clear sky day in June 2013. The center point of the multiangular flight pattern was placed according to high resolution UAV imagery in a homogenous part of the wheat field. A pattern with 25 waypoints covering 8 different heading angles (45° steps) and 4 different vertical tilt angles (20°; 43°; 60°; 90°), was programmed for the UAV. The pattern was flown at 12:43 and 14:47 local time, to compare two different time points around solar noon. At each of the 25 waypoints, the spectrometer was triggered 3 times, to assess the reproducibility of the spectral measurements at a single waypoint. A ground reference measured a white reference each time the airborne spectrometer was triggered. Using this dataset, a variety of angular effects in the spectral range could be investigated. Among a variety of analyses that were described in [A3], we investigated the effects of the sun angle on vegetation indices such as the NDVI or the red edge inflection point (REIP).
UAV image time series of barley
For precision farming and phenotyping, not single snapshots of the plants development are important, but an overview of the whole growth cycle. Only by the use of time series, the reaction of the plant to environmental parameters can be investigated. This is a huge effort in large field experiments, because each of hundreds of plots, has to be observed manually. By the use of satellite imagery agricultural fields can be assessed on low spatial resolution. But in general, satellite imagery is available only once per month. So the dynamic plant growth that can happen in days, cannot be tracked. This lack of survey capability was addressed in this study with a UAV, carrying a high resolution RGB camera. To this end an experimental barley field was observed from 100 m altitude with a weekly frequency, covering the whole growth period.
Year 2013 Year 2014 9-May-2013 27-Mar-2014 14-May-2013 3-Apr-2014 23-May-2013 10-Apr-2014 5-Jun-2013 16-Apr-2014 11-Jun-2013 22-Apr-2014 19-Jun-2013 5-May-2014 26-Jun-2013 15-May-2014 30-Jun-2013 21-May-2014 6-Jul-2013 22-May-2014 1-Aug-2013 26-May-2014 31-May-2014 5-Jun-2014 10-Jun-2014 18-Jun-2014 24-Jun-2014 3-Jul-2014 18-Jul-2014
Tab. 2 dates of UAV flights over the barley density experiment at the campus Klein-Altendorf. In 2013 a total of 10 surveys were performed and in 2014 we flew 17 times.
17
Setup– A density experiment with 2 barley varieties (Scarlett, Barke) was planted in 2013 and 2014 at the campus Klein-Altendorf next to Bonn. Ten different seeding densities ranging from 24 to 340 grains per m² were sown in plots of 16 x 1.5 m in 5 randomly spread repeats. The whole experiment was arranged in a rectangular field with paths between the plots. The UAV was flown at the dates given in Tab. 2 over the experiment in an altitude of 100 m to make a single image of the current growth state of the whole experiment. Colored references were placed in the center of the image to correct for different illumination conditions. Ground based plant scoring was performed along with the flights, whenever time allowed.
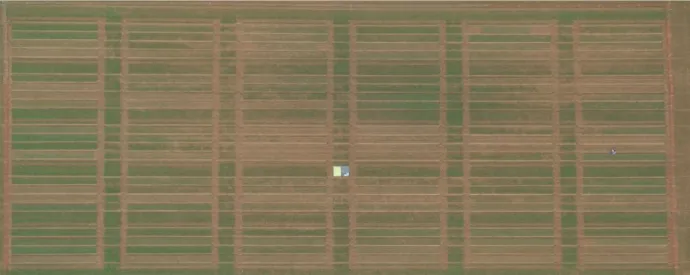
Fig. 7 rectified and vignetting corrected image of the density experiment as photographed with the UAV at the 22th of April 2014. In the center of the image the color references are visible.
Image processing– Images were corrected for vignetting and rectified towards a base image using ENVI (Fig. 7). Regions of interest were defined for each seeding density and variety, covering all 5 repeats. The average RGB values for each point in time and region of interest were extracted and corrected against the color reference. Using the green red vegetation index GRVI (eq. 2), a relative greenness was calculated (Motohka et al. 2010).
. ���� = � � − � � � + �
With this value we assessed the development of each plot over time. The processed image data was compared to ground based coverage of the experiment to check its relevance for the description of the plants development.
Results and discussion
Comparison of UAV sensors
Throughout the experiments of this study, the two main UAV sensors RGB Camera and UAV spectrometer were used intensively for different applications. In the following, the differences between the two sensors is described and afterwards the performance of each single instrument in their specific application is discussed. Both sensors are observing the optical domain of the electromagnetic spectrum. While the RGB camera has a high spatial resolution of 4912 x 3264 pixels (16 megapixels), it separates only 3 spectral
18 bands with the broadly defined bands red, green and blue. The UAV spectrometer on the other hand has a high spectral resolution of up to 1024 bands with a very narrow bandwidth. It covers the spectral range from 300 to 800 nm, but has only a single spatial pixel. While these are the main differences of the two sensors, there are other parameters that preclude the RGB camera from accurate reflectance measurements, while the spectrometer suits well for the retrieval of reflectance. Nowadays RGB cameras have a huge variety of automation, which is intended to create visually appealing images. This, however, is in conflict with the accurate quantification of light in specific bands. For this kind of measurements, the UAV spectrometer is suitable, because it reacts almost linear to the amount of the incident light and can be calibrated radiometrically. The camera on the other hand captures detailed spatial information in an image which can be used to generate detailed 3D models (J. Bendig et al. 2013). The UAV spectrometer, in contrast, allows the calculation of narrow band spectral Vis, that are highly useful for plant research. We tested the retrieval of reflectance from both sensors over the same areas, to assess how the retrieved values differ. The correlation over the 8 waypoints for three comparable bands (R,G,B) of the both sensors was R² = 0.681 (Tab. 3). The reason for this rather low correlation is mainly found in the non-linear radiometric response of the RGB camera. The JPG compression, as well as non-linear adaptions to light, decrease the accurate retrieval of reflectance values from RGB imagery. Scientific grade cameras or RAW imagery could enhance the quality of this data compared to the presented approach (Lebourgeois et al. 2008).
R² RGB IR MCA6 UAV Spec
RGB 1
IR 0.9136 (16) 1
MCA6 0.3773 (16) 0.9452 (16) 1
OO UAV 0.6807 (24) 0.8906 (24) 0.8259 (48) 1
ASD 0.6736 (24) 0.6474 (24) 0.9242 (48) 0.9777 (3856)
Tab. 3 Correlation of reflectance, retrieved from different UAV sensors measuring over the same eight grassland targets. In brackets the number of measurements n is given. RGB = Sony NEX-5n, IR = Canon Powershot modified to near-infrared
sensitivity, MCA6 = 6 band Tetracam, UAV Spec = STS spectrometer, enhanced for mounting on an UAV.
Another limitation of the RGB camera, compared to the UAV spectrometer is the low dynamical range. While the UAV spectrometer has a 14-bit response range, the JPG compression of the RGB camera saves only 8-bit per color channel. The spatial resolution, however, gives a useful insight in the grassland heterogeneity and allows fast assessment of clearly visible features, such as dry vs. healthy vegetation. Within [A2] two additional UAV sensors were tested for the use in vegetation monitoring. The third sensor was a Canon PowerShot consumer camera that was modified towards extended sensitivity in the near infrared. It was easy to use and provided high resolution (4000 by 3000 pixels) imagery, but had the same shortcomings as the RGB camera. The infrared sensitivity is not only affecting the red pixels, but also the blue and green. This leads to rather unseparated bands and thus decreases the value of the retrieved information (Sakamoto et al. 2012). The fourth sensor was a MCA6 Tetracam. The MCA6 has six bands that can be adjusted by selectable filters with a bandwith of about 10 nm. Further it is a scientific grade sensor
19 that features a 10-bit dynamical range and a resolution of 1280 by 1024 pixels. The camera, however, required extraordinary calibration efforts (Kelcey and Lucieer 2012). But after applying the calibration procedures, the correlation to the UAV spectrometer was satisfying (R² = 0.826). In contrary to the other three sensors, the MCA6 is a rather heavy sensor that exceeded the payload of the Falcon-8 and was lifted by another copter. Within [A2] we could show that four different optical UAV sensors deliver comparable results, but each should be used for a specific range of measurement topics. The recent technological development in the camera sector has produced a rapid advance in miniaturization and quality. This trend has an impact on scientific devices and several of manufacturers are now providing multi- and hyperspectral cameras suitable for UAVs (Tab. 4).
Name Manufacturer Weight [g] Bands
Rikola Hyper. Rikola Ltd. 600 adjustable UHD 185 Firefly Cubert GmbH 840 125 Nano-Hyperspec Headwall Photonics Inc. 700 270
OXI-VNIR-40 Gamaya SA 100 40
MCA6 Tetracam Inc. 700 6
Tab. 4 List of manufacturers for multi- and hyperspectral camera systems that are suitable for integration in UAV platforms. The list is a snapshot of devices available in early 2015. All cameras work with fundamentally different principles of the optical path
and thus have huge varieties in how to perform measurements and post-processing.
These cameras are closing the gap between single point spectrometers and high spatial but low spectral resolution cameras. Once the calibration and validation issues are mastered, these cameras will provide the sensing capabilities, needed for accurate determination of valid plant parameters. Recent studies with such cameras on board of UAVs point towards the retrieval of highly relevant data allowing the identification of drought stress, nitrogen deficit or upcoming plant diseases (Quemada, Gabriel, and Zarco-Tejada 2014; P J Zarco-Zarco-Tejada et al. 2009; Baluja et al. 2012; Mitchell et al. 2012). Other studies work towards combining 3D information with hyperspectral data to increase the informative value of the data (Juliane Bendig et al. 2014; Aasen et al. 2014). Even very small, but highly meaningful signals like the chlorophyll fluorescence (Meroni and Colombo 2006; Porcar-Castell et al. 2014), could be measured from UAV based sensors (P. J. J. Zarco-Tejada, González-Dugo, and Berni 2011; P.J. Zarco-Tejada et al. 2009). This opens up new possibilities for insights into plant biochemistry from remote sensing data.
Multiangular effects on optical UAV data
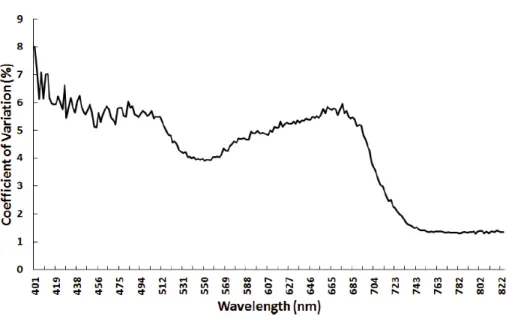
Not only sensors are a limiting aspect of the optical remote sensing of plant parameters. The setting of the investigated vegetation, illumination or sensor angle have an effect as well. We have investigated this effect using a novel setup, based on the UAV spectrometer. In the multiangular study [A3] we first checked the accuracy of the approach. Our data revealed that the positioning and pointing accuracy were acceptable (Tab. 1), although they were worse than ground based devices. The reproducibility of spectra, taken at the same waypoint, however, was satisfying (Fig. 8).
20
Fig. 8 The spectrometer of the UAV goniometer was triggered three times at each waypoint. The overall variation of these three reflectance spectra for all waypoints is shown over the whole spectrum.
We then investigated the impact of the observation angle to the NDVI and REIP. The difference in the NDVI ranged from 0.83 to 0.95 with a nadir value of 0.89. In the REIP the values ranged from 729 nm to 735 nm with a nadir value at approximately 733 nm (Fig. 9). The multiangular data, derived in this experiment, however, is in line with earlier studies with ground based goniometers or satellite approaches (A. Kuusk 1991; Verrelst et al. 2008; A. Kuusk, Kuusk, and Lang 2014). In this experiment extreme sensor tilt angles down to 20° were investigated, but even at 66° a significant difference is observed.
Fig. 9 Values of NDVI and REIP in nm at all waypoi ts show as a ir ular graph, or polar plot. Ea h sli e represe ts a heading while each ring represents a sensor tilt angle. The indices magnitude is color coded from low values of light blue, to high
values in bright red. The angular position of the sun is depicted by the sun-symbol. In this figure no interpolation between waypoints is performed.
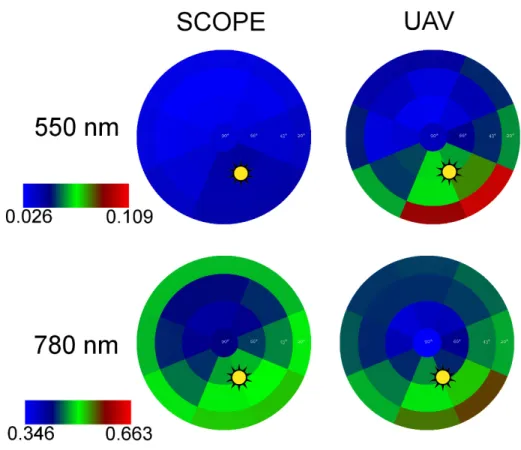
21 This difference is driven by the position of the sun. This was confirmed by comparing a measurement before and one after noon. The pattern of the angular reflectance difference changes with the position of the sun, which is seen in the data as hot spot, with higher reflectance values. This impact of surface and sensor illumination geometry, also known as BRDF effects (Nicodemus 1965), is a frequently discussed topic in the remote sensing technology (Schaepman-Strub et al. 2006). Up to now huge efforts have been conducted to address this issue and various steps towards good BRDF corrections have been performed (Bourgeois et al. 2006; Hautecoeur and Leroy 1996; Schlapfer, Richter, and Feingersh 2015; Sandmeier and Itten 1999; Meggio et al. 2014). For heterogeneous surfaces such as vegetation, which is also affected by continuous changes throughout the year, the BRDF effects are not yet fully understood, nor characterized. With the presented UAV spectrometer, used as goniometer, we have introduced a method for fast and easy retrieval of the multiangular parameters of vegetation. The huge advantage of the system is its independence from ground based structures. This also enables the UAV goniometer to be used over surfaces that are difficult to access by foot. An approach towards convenient correction of BRDF effects are mathematical models, which are optimized to estimate the angular influences depending on vegetation structure and sun/observer position. Using the SCOPE model (Soil Canopy Observation Photochemistry and Energy fluxes) (Tol et al. 2009), we have found good correlation of modelled angular reflection to measured data in angles close to nadir (Fig. 10). At lower tilt angles, however, the correlations are worse. This shows that using novel sensor-platform combinations, like the UAV goniometer, models can be trained and evaluated to further enhance the knowledge about angular effects of vegetation. Once these effects are understood in detail, the opposite way of using angular measurements to derive information about vegetation, will become feasible.
Fig. 10 Comparison of modeled angular reflectance calculated by SCOPE with the values measured by the UAV goniometer. Shown are two exemplary wavelengths, which are scaled to the present range of values.
22
UAV image time series of barley
To get relevant insights into the development of agricultural crops, not snapshots, but continuous monitoring by time series is necessary. The acquisition of time series of RGB imagery, monitoring the growth of barley on a whole field by using an UAV was tested in this experiment. In the first part the feasibility of the method was investigated within two years of practical work. Acquiring an image of the large 100 plot experiment, required a flying altitude of 100 m, using a wide angle lens with 16 mm focal length. We decided to capture only one image describing the whole experiment. This reduces effects of changing illumination conditions that arise when capturing multiple images and later stitching them together. We further placed color references in the center of the experiment to track differences in light composition or camera parameters over different measurement days. The overall working time for setting up the UAV, the targets and the photography flight itself was 20 minutes. It required only one trained person to perform all the tasks. Overall, the method was simple and no technical problems were encountered over the whole period of two years of measurement flights.
The image quality was assessed in different ways. We first checked the actual resolution that could be achieved from the 16 megapixel camera with the fixed lens. In theory a pixel, from 100 m altitude, has a ground resolution of 3.5 by 2.8 cm. Practically, this resolution is a function of the lens quality and the given illumination conditions that affect ISO and aperture size of the camera. To eliminate motion blur that would otherwise arise from vibration and movements of the UAV, pictures were taken with short shutter times (1/640 s). The camera automatically adapted aperture and ISO to values that ensure a good exposure of the image. If the amount of environmental light is low, the aperture opens up and ISO values become higher. High ISO values mean a binning of multiple pixels to suppress noise and increase sensitivity. Thus, an open aperture lets more light in, but leads to a less accurate focus on individual pixels. Both effects lead to worse images. The majority of images was shot with an aperture of F4 or higher and an ISO of 100. The worst ISO value was at 400. Under favorable conditions, the influence of neighboring pixels is noticeable within two pixels away. Under the worst conditions, present during the images taken in 2014, the pixel blur over 3 neighboring pixels as shown in Fig. 11.
Fig. 11 zoomed images of the color reference targets used in the survey campaign in 2014. The reference targets have six different colors (white, grey, black, red, green, blue) on a 40 cm by 60 cm panel. The UAV imagery was taken from an altitude of
23
conditions ( Aperture F5.6, ISO 100). Spreading of color information to neighboring pixels is made visible by the yellow raster, that represents the assumed real shape of the 6 color squares on the reference panel.
Due to the optical path, the overall imaging quality is best in the center of the image and worse in the edges, where vignetting effects and chromatic aberration have the largest impact. In the further analyses we eliminated most of the optical effects by averaging over all pixels of the five repeats of an experimental treatment. As these five plots are randomly spread over the whole experiment and the image, this also minimizes angular effects. These would otherwise change color values retrieved on the edges of the image as compared to the center due to the viewing angle. By applying the GRVI, we further reduced the impact of illumination effects as it mathematically normalizes the overall illumination variation of a scene. We then tested, how the phenological development of the barley experiment is tracked by the GRVI analysis of the UAV image time series. In Fig. 12 the development of 2 different seeding densities is shown, normalized in time to the day after seeding.
Fig. 12 Development of two different seeding densities (High = green, Medium = orange) as tracked by the GRVI in 2013 (dotted) and 2014 (solid).
The pattern of the GRVI is similar for both years and all densities and genotypes. Plots with low seeding density, however, develop slower compared to the high seeding density. Around day 64, the GRVI plots show a sharp decrease in both years and all treatments. By comparing ground based plant scoring, we identified the event of ear pushing in the plant development that happens at this period of time. We conclude, that a shift of colors induced by ear pushing was the reason for this sudden change in GRVI.
24 While in 2013 and 2014 different environmental conditions lead to changes in the development of the plants as reflected in the GRVI figures, the day of ear pushing seems to be genetically fixed.
With these first results of our analyses, we could show, that relevant traits of crops can be identified using time series of UAV RGB imagery. With this novel method we achieved a high frequency of images and high spatial resolution, as compared to satellite imagery. We conclude that further analyses of the image data such as heterogeneity distribution, single plant identification, 3D processing using multiple images and detailed color analyses will potentially add relevant results that can be referred to other plant traits. In our example, we investigated barley, but it is likely that similar time series over other crop types, will provide valid information as well. Further work must be done to relate the data of the aerial coverage to the actual processes on the ground and inside the plants.
Outlook on UAV based sensors for precision farming and phenotyping
In the present study, we have adapted a technically mature UAV platform and deployed it as sensor carrier for specific agricultural research questions. Study A1-A3 have shown that placing a sensor above an experimental field, using a flying platform, has become a simple task. Problems, however, arise when information about the plants needs to be derived from the sensors raw data. This led to the main question of the present thesis Ide tifi atio of ke ele e ts fo the et ie al of alid e ote se si g data f o opti al UAV se so s. We ha e i estigated diffe e t aspe ts of deplo i g opti al UAV se so s o e vegetation. In A1 we have placed a spectrometer on an UAV and have optimized the calibration of this flying device. This first copter-based spectrometer with ground reference station, was then used in the following studies as a precise scientific sensor. As different optical sensor equipment may vary in their results, we compared the retrieval of reflectance data by the UAV spectrometer and an RGB camera in [A2]. We have found both sensors to be practical in their specific application. This is spatial analysis with the RGB camera and spectral analysis with the spectrometer. In [A3] we investigated the impact of angular effects on UAV based sensors and have found large influence due to sun to sensor position. We then analyzed a time series of UAV imagery and found good relationships to ground based assessment of plant development. Within this thesis we have shown that most of the practical problems of UAV based sensors can be solved and their usage for agricultural research is feasible. Based on these experiments and the work of other authors, the following description provides an outlook on practical cases for the future of UAVs in precision farming and phenotyping.The recent development of RGB cameras has led to various possible application scenarios on UAVs. A large number of studies use hundreds of high resolution images, that cover an agricultural field and create a 3D representation of its surface (J. Bendig et al. 2013; Juliane Bendig et al. 2014; Turner, Lucieer, and Watson 2011). This technique is performed rather simple in the field and neither the stability of the UAV nor the quality of the camera must be extremely high to reach a good level of accuracy. The most significant part of the work is done by applying post-processing algorithms that are dependent on different observation positions. This approach provides good correlation between biomass estimation and plant height measurements in barley (Juliane Bendig et al. 2014) and even for orchards (P.J. Zarco-Tejada et al. 2014). These methods have great potential in phenotyping to quickly derive the plant height from UAV generated data. In agriculture this technique can be used to generate input data for plant growth models. These could
25 characterize the current developmental stage with high spatial resolution, which would then serve for a spatially adapted fertilization plan.
Fig. 13 Storm damage in this experimental field of barley is visible in the top right corner of the image. The stem of the plant might be broken and in this case the harvest of this patch is lost. Due to the lying plant, the reflectance largely changes and is
easily discriminated in the picture.
With the same approach of collecting multiple images, a so called ortho-mosaic can be generated. This ortho-mosaic shows the whole field as one single image. Analysis of such an image, however, faces various problems, which were addressed in our studies. Analyzing color values of an ortho-mosaic may produces wrong estimates, as the illumination conditions might change during a flight (Hakala et al. 2013). This can be addressed by either using only one image of the whole area or by placing color references inside the flight path of the UAV. This way the image might be corrected later. Nevertheless, ignoring the color information of a high resolution image, object or path identification can be used for identifying plant traits or disturbances in the field (Herwitz et al. 2004). Counting of single plants have been performed from aerial imagery and sophisticated image analysis (Peña Barragán et al. 2014). Storm damage in barley can be quantified easily by discriminating patches of broken plants against the healthy fields as shown in Fig. 13. But the color of the plants holds far more useful information. The color or reflectance is a representation of the state of the plant and may be altered by infections, drought or other stress (Jackson 1986). Once all problems with sensor calibration, illumination and angular effects are solved, in a way that reproducible measurements can be achieved, meaningful plant traits can be derived. This is further enhanced by using the whole spectrum of the visible and near infrared light by either spectrometer or multispectral frame cameras (Tab. 4). By analyzing narrow spectral bands, detailed information about specific plant traits, can be detected. This way recent studies have used UAV based sensors to directly measure PRI, chlorophyll content, water and nitrogen content (P. J. J. Zarco-Tejada, González-Dugo, and Berni 2011; Baluja et al. 2012; Meggio et al. 2014; J. Berni et al. 2009). However, in most cases the derived signal is a mixture of different plant´s parameters. To untangle this complex mixture of biophysical processes, which are represented in the plants reflection spectrum, two possible ways are currently in the focus. 1) By comparing ground data and airborne data, vegetation indices are identified that have the maximum relation to a single specific plant parameter, but at the same time are not affected by other plant parameters. 2) By modelling the reflectance of plants using known input parameters, the spectral
26 signature can be calculated. On the other hand, the model can inversely predict the plant´s parameter, using the reflectance spectrum as input. This has been done in SCOPE (Tol et al. 2009) [A3] and highly interesting results from this method are foreseen.
With the steady improvement of spectrometers, it can be expected, that even tiny signals, such as the Sun Induced Fluorescence (SIF) will be measurable from UAVs. Various efforts are undertaken in this direction (P.J. Zarco-Tejada et al. 2009; Malenovsky et al. 2013), but until now the large external influences from sensor, flying platform and scenery, have left the absolute results and their accuracy questionable. With the advent of active SIF references (Burkart et al. 2015), that mimic the emission of SIF, more accurate measurements are expectable.
The development of the flying platforms themselves will go different ways. The so called copters are easy to deploy and a great option for the scientific use over small areas. But their limited payload and endurance largely excludes them from professional use. If a farmer needs timely information about all his fields, a fixed wing UAV with decent speed and endurance is more practical to operate the chosen sensor over a large area. However planes are still limited in payload and endurance and need a runway. A look in the near future raises the need for the continuous survey of agricultural areas, to provide timely information with high temporal and spatial resolution. Satellites are struggling to provide these data, as they are costly, have a limited ground resolution and are highly affected by cloud cover or low overpass frequency. A possible solution for this demand is an UAV at about 1 km altitude that remains airborne for weeks or months. This could be achieved by a helium filled aerostat or zeppelin, which charges itself via solar power and continuously scans the agricultural surface.
The remaining problem is the conversion of sensor data in meaningful products that can finally be delivered to the farmer or breeder. This mainly is a software based problem that must by approached by both, aerial and ground based data. It also must include metadata such as soil and weather conditions, as well as seeding time to correct the plant growth model. The crop model APSIM (Keating et al. 2003) could be used for example to generate the plant parameters that feed the SCOPE radiative transfer model, which then calculates the expected reflectance of a specific crop and growth stage. If a UAV based reflectance sensor measures deviations of the expected reflectance, stress or other factors that influence the growth are detected. The farmer then can adapt its actions accordingly. Once the steps are working in an automated manner, the way is open for a more resource efficient agriculture that only applies what the plant really needs (McBratney et al. 2005).
Conclusion
UAV based sensors are a highly promising tool for the acquisition of relevant data in agriculture. But challenges remain in how to retrieve meaningful results from the sensors, scanning the crops. This led to the p i a task of this stud Ide tifi atio of ke ele e ts fo the et ie al of alid e ote se si g data from optical UAV se so s. Th oughout this o k pa ts of this la ge halle ge e e add essed a d e worked out possible solution.
An easy to use octocopter platform (Falcon-8) was introduced. We then developed and implemented a spectrometer system on the UAV to accurately measure reflectance. The correlation of this UAV spectrometer to three other UAV sensors (Sony NEX-5n RGB camera, Canon Powershot modified to infrared sensitivity, MCA6 Tetracam) was investigated. In the spectral domain, the correlation of reflection was moderate between the 4 sensors. But the high spatial resolution of the cameras is beneficial for detailed image analysis of land-cover. The more quality is expected from vegetation measurements, the