The wider economic
impacts of transport
investments
SUMMARY
WIDER ECONOMIC IMPACTS OF TRANSPORT INVESTMENTS
The development of transport infrastructure engenders economic growth. Several studies have demonstrated that investments in transport capital re-duce the costs of transport and production, and thus contribute to economic growth and productivity. In addition to these long run impacts during the operation phase, there are more immediate economic impacts during the construction phase.
The economic impacts of new and improved transport capacity are complex and often indirect. Transport infrastructure investments will not improve the economic vitality of a region unless it has sufficient economic capacity and the labour, land-use, housing and economic development policies, for example, supporting the positive economic development. Investments in ca-pacity are often necessary but they may not create conditions sufficient for economic growth.
Transport infrastructure investments require public financing. Feasibility assessment is needed to ensure reasonable and acceptable allocation of al-lowances. Relevant economic, environmental and social impacts should be considered.
There is an increasing awareness within the transport sector, that decisions concerning transport system development are associated with scale effects and externalities that produce more than just travel costs savings. The plan-ners and decision-makers need to know more about the wider economic impacts regarding individual infrastructure projects and also more general-ly concerning transport policies.
AVAILABLE TOOLS FOR ECONOMIC IMPACT ASSESSMENT
Transport sector has a long tradition of using the principles of practical cost benefit analysis (CBA) in transport project appraisal that analyses the pri-mary impacts of transport project proposals. The standard transport project assessment is necessary but not sufficient for the estimation of the wider economic impacts.
There are several analytical techniques for the estimation of the economic development impacts, varying from simple case studies and surveys to complex economic simulation modelling. However, there is no single analyt-ical tool that is equally useful to all of the information needs in the planning and decision making. The purpose and level of desired sophistication of the analysis varies.
Computable General Equilibrium models (CGE) can be considered powerful tools to be used in the assessment of economic impacts of infrastructure in-vestments. In this project, RegFinDyn and RegSweDyn CGE-models have been defined to be used in the assessment of rail investments in Finland and in Sweden. The use of these models is, however, rather expensive and re-quires specific skills and knowledge.
This project has aimed to tackle the contradicting needs for a complex CGE-modelling and the desired easiness and flexibility of the analysis: A spread-sheet tool with a streamlined interface that uses the results of a large num-ber of previously made CGE-model simulations.
NEW PLANNING TOOLS WEBRAILSWE AND WEBRAILFIN
The development of the tool led to twin tools that were named WebRailSwe and WebRailFin. The tools are made for a quantitative approximation of the wider economic impacts of large rail investments in the national areas of Sweden or Finland. The wider economic impacts calculated by this tool are supplementary to the results of a standard project assessment (CBA). The tools use generalised results of RegSweDyn and RegFinDyn CGE-modelling. The Swedish tool covers 8 areas (Nuts 2) and is based on gener-alised results of 128 scenario simulations. The Finnish tool covers 4 areas (Nuts 2 except Åland) and is based on a total of 200 scenario simulations. Both tools contain four main parts: 1) Basic calculation where the user en-ters the input parameen-ters and receives the main results of the calculation, 2) Base scenario 2013–2040, that defines the reference alternative for the in-vestment under investigation, 3) calculation of the inin-vestment shock and 4) calculation of the productivity shock. The four economic indicators calculat-ed by the tools are real GDP, real household consumption, employment and population.
The basic case of using the tools is to calculate the wider economic impacts of a particular rail investment. The tools can also be used to compare the economic impacts of similar investment in various national areas. In addi-tion, the projections of the regional Base scenarios may be useful as such. The tools can calculate only at Nuts 2 level, but the relative results may be used to approximate economic impacts at Nuts 3 level, too.
CONCLUSIONS
It has been proved that it is possible to have a tool that is relatively simple to use but gives results that are based on comprehensive CGE-modelling. This can be considered a promising start for a wider use of advanced model-ling of economic impacts in the transport sector. However, the results of this project, WebRailSwe and WebRailFin, are only applicable to rather large rail investments, and the results are calculated and presented on a spatial reso-lution that is rather coarse. Further work is needed to define similar tools for road investments and other forms of transport improvements, and to de-fine the spatial resolution of the tools.
FOREWORD
The Bothnian Green Logistic Corridor (BGLC) is an international project working to develop the infrastructure on the Corridor and its connections. The Bothnian Corridor transport network connects northern Europe and its rich natural resources to the most densely populated areas in Europe. The Bothnian Corridor is a strategically significant artery for securing efficient raw material transport and sustainable economic growth in Northern Europe. The pro-ject brings together public authorities and private stakeholders to cooperate for future transnational transport poli-cies and actions.
Work Package 5 of the BGLC-project aims to increase the knowledge and understanding of the economic impacts of infrastructure development on industrial development and new potential, on their value chains, and on regional economy. This project ‘Wider economic impacts of transport investments’ is Activity 5.3 of the Work Package 5. The objectives for the project in hand were to elaborate the concepts and mechanisms of the wider economic im-pacts of transport investments and, to develop a tool to assess those imim-pacts. This report of the economic imim-pacts of transport investment is the first deliverables of this project. The other deliverables are two assessment tools devel-oped in the Microsoft Excel environment to calculate the economic development impacts of large rail infrastructure investments in Sweden (WebRailSwe2014.xlsx) and in Finland (WebRailFin2014.xlsx). The tools are presented and demonstrated in this report.
The methodological challenge with the tools has been the idea to combine complex computable general equilibrium (CGE) modelling with a need to have a flexible and “simple” tool. This project proves that such tool is possible to make. However, further work is needed to define similar tools for road investments and other forms of transport improvements. The spatial resolution should then be defined to Nuts 3, too.
The Steering Group of this study included the following representatives Jukka Lindfors, Council of Tampere Region
Pentti Hämäläinen, Council of Tampere Region Hannu Siitonen, Uusimaa Regional Council Erkki Vähätörmä, Uusimaa Regional Council
The visiting representatives of the Uusimaa Regional Council in the Steering Group meetings during the project have been Ilona Mansikka, Markku Hyypiä and Olli-Pekka Hatanpää.
This study was conducted by a following consultant team: Heikki Metsäranta, Strafica ltd, project manager
Professor Hannu Törmä, University of Helsinki, Ruralia Institute, RegFinDyn and RegSweDyn modelling Jouko Kinnunen, Statistics and Research Åland, development of the WebRailFin and WebRailSwe tools
Seppo Laakso, Urban Research TA ltd, the theoretical framework of economic development impacts (Chapter 3) Urszula Zimoch the University of Helsinki Ruralia Institute, the economic modelling tools (Chapter 4).
CONTENT
1 INTRODUCTION ... 6
2 THE ECONOMIC IMPACTS OF TRANSPORT INVESTMENTS – AN OVERVIEW ... 7
2.1 ECONOMIC IMPACTS IN TRANSPORT DECISION MAKING ... 7
2.2 THE DIRECT ECONOMIC IMPACTS OF TRANSPORT INVESTMENTS ... 7
2.3 TYPES AND MECHANISMS OF ECONOMIC DEVELOPMENT IMPACTS ... 8
2.4 ARE WIDER ECONOMIC IMPACTS ADDITIONAL TO DIRECT TRANSPORT BENEFITS? ... 9
2.5 THE SPATIAL SCOPE ... 10
3 THE ECONOMIC DEVELOPMENT IMPACTS OF TRANSPORT INVESTMENTS... 11
3.1 IMPACTS ON ECONOMIC GROWTH AND EMPLOYMENT ... 11
3.2 IMPACTS ON AGGLOMERATION, COMPETITION AND LABOUR SUPPLY ... 12
3.3 IMPACTS ON LAND USE AND PROPERTY VALUES ... 13
3.4 POTENTIAL FOR WIDER DEVELOPMENT OF LAND USE ... 14
4 TOOLS FOR ECONOMIC DEVELOPMENT IMPACT ASSESSMENT ... 16
4.1 TRANSPORT PROJECT ASSESSMENT (COST BENEFIT ANALYSIS CBA) ... 16
4.2 SURVEYS, INTERVIEWS AND MARKET STUDIES ... 17
4.2.1 Interviews and surveys ...17
4.2.2 Market studies ...18
4.3 COMPARATIVE ANALYSIS –CASE STUDIES ... 18
4.4 LAND-USE–TRANSPORT INTERACTION SIMULATION MODELS ... 19
4.5 ECONOMIC MULTIPLIER –INPUT –OUTPUT (IO) MODELS ... 19
4.6 AN OVERVIEW OF COMPUTABLE GENERAL EQUILIBRIUM (CGE) MODELS ... 20
4.7 THE REGFINDYN MODEL ... 22
4.8 INTEGRATED CGE– TRANSPORT MODELS ... 24
4.9 CONCLUSIONS ... 24
5 A PLANNINGTOOL FOR ECONOMIC IMPACT ASSESSMENT ... 26
5.1 INTRODUCTION TO THE METHODOLOGY ... 26
5.2 REQUIRED BACKGROUND INFORMATION AND PREPARATORY WORK ... 27
5.2.1 The basic calculation ...27
5.2.2 Additional options ...29
5.3 THE RESULTS ... 29
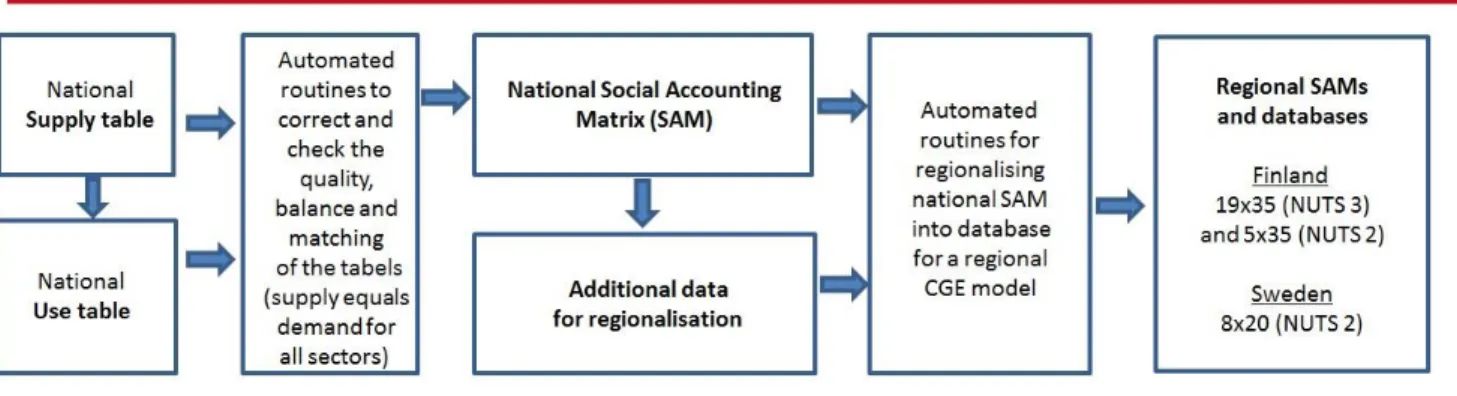
5.4 THE CGE-MODELLING TO CREATE THE RESULT DATA BANKS FOR THE PLANNING TOOLS ... 30
5.4.1 Data sources and dimensions ...30
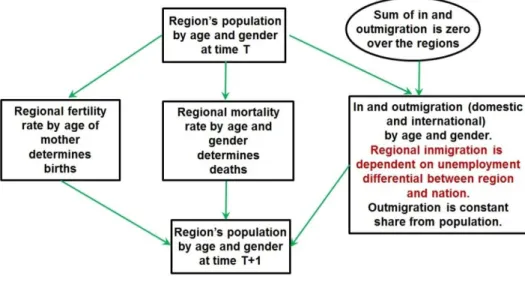
5.4.2 Population dynamics ...32
6 DEMONSTRATION OF THE TOOL ... 33
6.1 EXPLORING THE WIDER ECONOMIC IMPACTS OF A MAJOR RAIL INVESTMENT ... 33
6.1.1 Norrbotniabanan ...33
6.1.2 Seinäjoki–Oulu ...36
6.2 EXPLORING THE REGIONAL DIFFERENCES OF WIDER ECONOMIC IMPACTS ... 40
6.2.1 Comparing similar investments in different national areas of Sweden ...40
6.2.2 Comparing similar investments in different national areas of Finland ...41
6.3 EXPLORING THE BASE SCENARIO FOR REGIONAL PROJECTIONS ... 43
6.3.1 Sweden ...43
6.3.2 Finland ...44
7 FINAL CONCLUSIONS AND RECOMMENDATIONS ... 46
1
INTRODUCTION
This study focuses on the economic development impacts of infrastructure investments in the context of Both-nian Green Logistic Corridor. The main focus is on the development of rail transport. The development of both efficient and environmentally friendly transport solutions is important for the following reasons:
More capacity is needed to respond to the expected increase of freight transports during the next dec-ades
The competitiveness of the central and northern regions of Scandinavia requires efficient transport connections to the European and global markets, which in turn need the availability of the natural re-sources and products of the Northern regions
The economic growth must be environmentally sustainable, too.
The role of public authorities in this context is to ensure sufficient operating environment for the private firms to engage in profitable business. Transport infrastructure is an integral part of the economic process. The local and national authorities and governments have the power to decide, how to develop (or not to develop) the transport infrastructure in the Bothnian Corridor. The decisions they make will have impacts on the economy. Therefore it is important, that the decision-making is provided with sufficient and reliable information about the economic impacts.
The two main tasks of this study have been (1) a literature review of the wider economic impacts of transport investments and (2) development of an evaluation tool to quantify those impacts. The previously set context for the study has been the development of the railway infrastructure within the Bothnian corridor.
The literature review was carried out on the wider economic impacts of transport investments (Chapters 2 and 3), and the methodologies to assess those impacts (Chapter 4). Both qualitative and quantitative approaches were concerned, as well as existing tools and models. The review builds an understanding of the wide range of wider economic impacts that can follow transport improvements, and the potential methods for quantifying these. Finally, the review compares the computable general equilibrium (CGE) models with other methods in the estimation of the wider economic impacts.
An assessment tool was developed in the Microsoft Excel environment to calculate and present the wider eco-nomic impacts of rail infrastructure investments within the spatial scope of Finland and Sweden (Chapter 5). The core of the evaluation tool has been built by using RegFinDyn and RegSweDyn CGE-models to compute sev-eral investment and impact scenarios of two actual investment projects, Seinäjoki–Oulu in Finland and Norrbot-niabanan in Sweden. These two projects were used also in the demonstration of the tool (Chapter 6).
2
THE ECONOMIC IMPACTS OF TRANSPORT INVESTMENTS – AN OVERVIEW
2.1 Economic impacts in transport decision making
Transport connects people, businesses and resources. The demand for transport is derived demand reflecting the economic activities of firms, households and individuals. Changes in the transport system, in turn, have im-pacts on the economic development, that can be defined by society’s strategic economic goals and objectives (Littman 2010) concerning e.g. income, employment, competitiveness, business activity, property values, af-fordability, tax revenues, equity. These objectives have local, regional and national dimensions.
Investment decisions are key decisions in every long term development strategy. The main underlying reason to use economic resources now is to gain economic benefits in the future. Decisions concerning transport infra-structure are made by public agencies and governments, and are expected to support the public good. Therefore, project appraisal is used to investigate and reason the consequences of the decisions to assist the decision-makers to reach informed and rational choices.
Generally speaking, transport investments generate two categories of benefits (Berechman 2009): Direct, pri-mary benefits within the transport system and secondary, externality benefits in the other sectors of society and the economy. The primary impacts of transport investments concern accessibility, traffic safety and transport related costs both internal and external. Environmental and other restrictions and impacts are taken into ac-count and may in some cases be of great importance and interest. However, the main motivation for transport investments comes down to economic goals and objectives.
Transport authorities in most countries have a long tradition of using the principles of practical cost benefit analysis (CBA) in transport project appraisal. The theoretical framework for such an analysis is broad, and therefore there are International (e.g. World Bank), European (EU) and nationally harmonised guidelines for transport project assessment. The CBA provides the decision-making with tools to analyse the primary impacts of transport project proposals.
There is an increasing awareness within the transport sector, that decisions concerning transport system devel-opment are associated with scale effects and externalities that produce more than just travel costs savings. There can be wider economic effects following the investment money spent on the region and the transport cost reductions. These benefits may include, for example, employment generation, increased productivity and avail-ability of labour, changes in land and property values. The concern in this respect is that without due recogni-tion of the broader impacts in the transport decision-making framework, the decisions may lead to undesired allocation of investment funds.
Since transport investments affect economic growth and welfare, it is of importance in the decision-making to get a wide view of the economic impacts. Direct, indirect and induced effects together provide the total econom-ic impact of transport investments.
2.2 The direct economic impacts of transport investments
The direct economic impacts of a transport investment include investment and maintenance costs, operating costs of transport operators and the time costs for business travel and freight. Further, the costs of traffic acci-dents and pollution include potentially relevant cost items.
The principal economic impact of a transport improvement is the time savings to freight drivers and business travellers. The value placed on travel time savings is the opportunity cost of the lost time that is often measured as gross hourly labour cost (as is in Finland and in Sweden). Time savings in business travel have direct implica-tions on the productivity of the employees. It should be noted, however, that there are possibilities to use the
travel time productively. This phenomenon may be tackled by using different values of time for different modes of transport and different trip purposes.
For freight movements there can be additional gains from reducing the time goods are held up in transport. In particular for higher-value goods, time savings could mean economic efficiency gains. Improved reliability of transport, on the other hand, may lead to tighter scheduling and thus improved productivity. (Kernohan and Rognlien 2011.)
From the transport operator point of view, there are usually direct economic impacts concerning fuel or electric-ity consumption, vehicle rotation (vehicle hours or vehicle days) and working time of drivers and other person-nel. These impacts affect the productivity and quality of service of transport operators.
In addition, traffic accidents have four kinds of economic impacts: costs of medical treatment, loss of production and consumption, material costs and administrative costs.
2.3 Types and mechanisms of economic development impacts
The economic impacts of transport investments are commonly divided into short- and long-run economic de-velopment effects. The effects in the short-run or in the long-run are associated with investment multiplier ef-fects and regional economic growth efef-fects, respectively (Berechman 2009):
Short-run multiplier effects: The value of economic activity following the money spent on construction and purchases during the investment period. The multiplier effects of large investments are generally quite high in terms of changes of personal income, jobs and gross regional product. Thus, these impacts are of interest especially among local decision-making.
Long-run effects on regional economic development: The changes in the economic development following the primary transport effects (time and cost changes). The development effects are structural changes in the impacted markets that materialise in a long period of time. The value of economic development impacts is quite low compared with the short run multiplier impacts. It is also a challenge to separate the impact of a particular transport investment from all other land-use, economic, demographic and other transport system developments taking place in the region during the following decades.
Economic development impact types can generally be categorized as follows:
Impacts relating to overall area economy; economic output, gross regional product, value added, personal income, employment
Impacts relating to specific economic development such as productivity, capital investment, property appre-ciation and fiscal impacts including both public revenues and expenditure
The development impacts may occur as a direct consequence of the investment. The most interesting impacts, however, are the indirect, induced and dynamic development impacts:
Direct mechanism: The most significant impact is the reduction of transport costs. Businesses of the region are offered improved accessibility to markets and resources (labour, materials and equipment) and, the benefits of reduced costs of transport and thus enhanced productivity. Direct impacts of construction on wealth and job creation.
Indirect mechanism: “Secondary” entities such as local businesses supplying inputs to directly affected busi-nesses.
Induced mechanism: Increased income leads to increased spending and thus to increased demand.
Dynamic mechanism: Long-term changes in economic development; business location patterns, work force, labour costs, prices, land-use changes, that in turn affect the wealth in the region.
Figure 1. Types and mechanisms of economic development impacts (figure based on an original by Sinha & Labi 2007)
2.4 Are wider economic impacts additional to direct transport benefits?
Many of the development impacts of an infrastructure investment are in fact capitalised direct impacts. There-fore, it is a widely applied rule that the wider economic impacts of an investment project are not to be added to the direct (transport economic) benefits. The estimates of the wider economic impacts will, however, be of great interest in the decision-making process.
There may also be external economic impacts to transport cost reductions. Kernohan and Rognlien (2011) im-plicates that an infrastructure investment can produce benefits through the following mechanisms of effects that are additional to the standard approach of evaluation:
Agglomeration impacts: Improved accessibility and the decrease of transport costs may lead to firms to relocate closer to their intermediate suppliers to enjoy lower upstream (buying) and downstream (supplying) costs. The outcome of this process is intensified regional industrial clustering i.e. agglomer-ation. This may also facilitate specialisation of economic activities enabling increased efficiency from economies of scale. Further, the improved accessibility increases interaction between economic actors and better transfer of knowledge (=> productivity). The increased agglomeration – as well as the in-duced impacts – has effects on the prices in the region involved.
Imperfect market impacts: CBA measures the value of time saving as a saving in gross labour cost as-suming perfect competition. There are, however, price-cost margins caused by e.g. taxation and imper-fect competition. The improved accessibility and trade between spatial markets. If there are persistent
externalities in other markets that are affected by a transport scheme, a reduction or increase in output can diminish or augment the cost of these externalities.
Labour supply and job relocation impacts: The improved accessibility affects labour markets in two ways. The higher commuting speed increases the labour accessibility from current locations, and attracts more jobs to locate in the region (to benefit from the agglomeration).
According to Graham (2012), there is a strong theoretical case for extending conventional transport appraisal to cover wider economic impacts. Agglomeration economies form the largest component of these wider impacts, and there are differences between different kinds of transport projects in different regions. Therefore, the ex-pansion of the transport project assessment to cover also the wider economic impacts in of significance in the decision-making. Agglomeration impacts can arise from small scheme as well as large schemes, and across dif-ferent modes of investment. Further, the agglomeration benefits do not only arise in urbanised areas but any lo-cation may benefit from improvements in accessibility.
2.5 The spatial scope
According to U.S. Department of Transportation (2006), there are three categories of economic impacts that should be taken into account while assessing economic benefits and costs of any infrastructure investments:
Evaluation of national level first-order and second-order infrastructure efficiency benefits (e.g., reduced costs to goods transport operators and customers, relocation of logistic activities)
Evaluation of national-level economic growth or productivity (e.g., GDP, exports)
Evaluations of local and regional economic impacts for local and regional funding decisions (e.g., em-ployment, Gross Regional Product, household income).
The spatial scope is of great relevance in the assessment of economic impacts. At a national level, the changes in the economy will probably be seen as “internal redistributions”. At a regional level the changes may be per-ceived as “new activities”. The best level to capture impacts on economic development is the regional one. The size, structure and maturity of the economies and the transport system may vary greatly between the regions. The size and nature of the economic impacts varies, too. At a local level the spill over effects might be negative for some municipalities (for example an exit of a logistic centre due to the increased accessibility). On the other hand, there are municipalities that will win and receive new business via the agglomeration effects.
Berechman (2009) points out that the economic development consequences in a region are further affected by spatial policies, too. The predicted economic development benefits of an investment may not fully transpire, if they are not accompanied by supporting land-use, housing and industrial policies.
3
THE ECONOMIC DEVELOPMENT IMPACTS OF TRANSPORT INVESTMENTS
3.1 Impacts on economic growth and employment
In addition to the direct and indirect effects of a transport investment and the operation of the improved system, the changes in transport environment may cause changes in the regional economic structures and shifts of eco-nomic activities between regions in the long run.
The economic impacts of a transport investment are to a large extent based on the effects the investment has on accessibility. Faster train connections and increased supply and quality of transport services lower the costs of personal mobility and goods transport. This makes the trade of goods and services more profitable and the communication and interaction between people easier. Improved accessibility makes it possible for enterprises to enhance their geographical market areas (if the size of the market area depends on accessibility). This may increase competition in some locations but at the same time it makes it possible to deeper specialization which increases productivity. Accessibility improvements may also make the labour market areas larger because job centres can be reached from longer distances within reasonable time. This tends to increase commuting and it causes an improvement in the balance of labour demand and supply. The more polarised and specialised are the labour markets the more beneficial it is to enhance the labour market areas.
The connection between accessibility and the regional economy is described in Figure 3.
Figure 3. The process of impacts of accessibility improvements in a labour market area.
As long as business transport is a factor in the production function of the firm faster and better quality business mobility (meetings etc.) has a direct effect on the cost and productivity of firms. Especially communication in-tensive firms, typically business services, can get competitiveness advantage and can enhance their business to neighbour regions. This supports the growth potential of firms in the region and may attract new firms to the
region. This may have an impact on the demand for labour in the growing region and at the same time the sup-ply of labour may increase due to the enhancement of the labour market area. Improvement of accessibility af-fects also the availability of various services and leisure mobility. Finally, the increase of the overall attractive-ness of the region may lead to increases in-migration and population growth.
As a whole, the improvement of accessibility may lead to growth by two different processes: widening of the functional labour market area and inward growth via jobs and population. However, the growth may take place, at least partly, at the cost of the firms in other regions.
3.2 Impacts on agglomeration, competition and labour supply
Significant improvements in accessibility may cause a strong growth impulse for a region. This is especially pos-sible if new connections are created or two or more transport modes are developed simultaneously (e.g. fast railway and highway) for a region with growth potential but previously underdeveloped transport system (World Bank 2009). In this case the accessibility improvements function as a catalyst for growth but in the long run the larger size makes it possible for the region to create agglomeration benefits for firms and households which may lead to further growth.
Agglomeration benefits refer to positive externalities by which economic actors (firms and households) benefit from the closeness of other economic actors and of the increasing number of them and output growth created by them. Agglomeration benefits can be divided to localization benefits and urbanization benefits (e.g. Laakso & Loikkanen 2004).
Localization benefits are based on the big size of a certain sector in the region. This makes it possible to exploit scale benefits in the input markets and logistics and supports the creation and distribution of innovations within the region. Urbanization benefits are based on the large size and diversification of the whole urban region. For firms urbanization means more competition, wider goods variation, better possibilities for specialization and cooperation. For households urbanization means a wider range of consumption possibilities. For labor markets large size of the urban region means better match of the demand for and supply of work. An important factor is the possibility to spreading of knowledge, innovations and technologies between the sectors.
There is a lot of research evidence about the benefits to firms of the location near other firms of same industries or other industries. Agglomeration benefits the economic and social interaction between firms and their em-ployees. This increases the probability of innovations and flow of knowledge between firms. In addition growing urban areas provide urbanization benefits, like the benefits of the large market area, well working labour mar-kets and benefits from the diversification of industries. At the same time, agglomeration can increase price level and congestion (Laakso & Loikkanen 2004; Laakso & Moilanen 2011).
Industries differ from each other with respect to the significance of the various dimensions of accessibility and the sensitivity to the changes in accessibility. According to Graham (2007; 2012) the productivity of firms in-crease with respect to the accessibility to a major economic centre but the elasticity varies between industries. The elasticity is higher in services than in manufacturing or construction. The highest effect1 is in business ser-vices, finance, telecommunication and transport while in retail trade and accommodation and catering it is low-er but still highlow-er than in manufacturing.
This explains to the large extent the fact that in Finland more than three quarters of the jobs of business services, finance and telecommunication are located in the 10 largest urban areas with the biggest local market for their services and best accessibility to other concentrations. (Laakso & Moilanen 2011)
1 According to estimation results from UK the elasticity is 0,2–0,25 in most accessibility sensitive industries while it is below 0,1 in manufacturing and construction.
Figure 3 shows that the intensity of business communication between enterprises in different regions depends both on the characteristics of the transport system and on the industry structure and specialization. The density and efficiency of the transport system determines the accessibility of other regions. On the other hand, the in-dustrial specialization based on competitiveness benefits of regions influence the potential of business commu-nication between firms from different regions. In general, good accessibility of a region tends to attract firms with large market areas and much need for business communication in a large geographical area.
Figure 4. The process of market area enhancement of firms
Empirical studies from Jönköping region (Andersson et al 2005) are based on the framework of the impact of accessibility on the business contacts and enhancement of market areas. According to their estimation results the intensity of business trips increases extremely fast between the transport distances from 60 min (1h) to 180 min (3h). This means that the fastening of transport connection especially within this time frame increases sig-nificantly business communication based on face to face contacts.
The SAMLOK model (Anderstig et al 2007) is based on the hypothesis that an improvement in the accessibility affects the labour market from two directions. First, the number of potential workers for which job concentra-tions are reasonably well accessible increases. Second, the number of potential jobs which are reasonably well accessible from housing locations of the residents who are active in labour market increases. In addition, there are other influencing factors, like the supply of housing and characteristics of residential areas and supply of jobs and the characteristics of job areas which influence the realization of the functional labour market area. The key concepts of the model are “market potential for jobs” and “market potential for labour”. The estimation results of Anderstig et al indicate that both aspects of market potential are deeply interlinked. According to the results based on regional panel data show that more than half of labour (population) change can be explained by the change of the market potential for jobs.
3.3 Impacts on land use and property values
In urban areas transport investment may affect the land use and property values in the long run. The potential for the change concentrates first of all in the vicinity of new or improved transport links, like railway stations (railway investments), road junctions (road investments) and airports (airport investments) but the effects may also influence a wider area or the whole urban region if the investments acts as a catalyst for a process based on agglomeration effects. In the following we concentrate on the potential land use effects of railway investments improving person transport.
The accessibility improvements caused by rail investments make the locations near the old or new railway sta-tions more attractive for firms and households. Firms benefit from improved access by rail especially to other regions but also within the same region. This makes the business to business contacts easier improving the communication accessibility for firms. This is most important for communication intensive firms, like business services. It also improves the possibility for firms to get labor due to faster and better quality commuting from a
larger area. The increased passenger flows in the surroundings of the stations make the location more attractive for retail trade and other services for households. The improved transport accessibility and changing locations of jobs and services may also make the locations more attractive for housing.
These improvements of accessibility influence the rent level firms are ready to pay in the vicinity of improved accessibility. This leads to the increase of the rents and prices of old and new business premises. This is further capitalized in the land value of the area. These price changes create also pressure for the change of land use in two ways. First, the increased land value leads to demand for increasing density in the area. Second, the indus-trial structure in the area tends to change. The old activities, like manufacturing and storage, tend to move to new locations while they are replaced by the industries benefiting from improved accessibility, like business services, retail trade and other household services.
The increased level of land value and the changed land value distribution creates pressure for planning. The re-quirement for higher land efficiency (higher buildings and less vacant space) increases. In addition, the area where construction is profitable becomes larger. However, planning rules restrict the realization of the land use changes. There may be political reasons to restrict the construction efficiency and the access of new land use in the area. Old buildings may be protected. The citizen or business community may oppose the land use changes. The land ownership may restrict or postpone the changes. These restrictions may lead to the realization of the second or third best alternatives compared with the market based land use. It must be pointed out that land use changes as a consequence of a transport investment typically take years, often tens of years.
Are the land value changes caused by transport investments a zero sum game at regional level? The long run land use changes as a consequence of a transport investment are at least partly realized at the cost of other loca-tions in the region. When the demand for land use in one location increases it normally decreases, at least mar-ginally, in other locations, respectively. However, it is not a zero sum game if the land use of the region becomes more effective increasing the productivity of firms benefitting the land use changes. Increasing productivity raises also the capability of firms to pay rent and consequently, the total land value of the whole urban area in-creases as a consequence of taking advantage of the improved accessibility and increased efficiency of land use. 3.4 Potential for wider development of land use
Bannister & Berechman (2000) point out that in developed countries where the quality of the transport infra-structure is basically already at a good level further investment in infrainfra-structure will not on its own result in economic growth. Instead, transport infrastructure investments act as a complement to other underlying condi-tions which must also be met if further economic development is to take place.
According to B&B there are three sets of necessary conditions:
1. Economic conditions: There must be possibility for positive economic externalities, such as agglomera-tion and labor market economies, the availability of a good quality labor force and underlying dynamics in the local economy.
2. Investment conditions that relate to the availability of funds for the investment, the scale of the invest-ment and its location, the network effects and the actual timing of the investinvest-ment.
3. Political and institutional conditions that are related to the broader policy environment within which transport decisions must be taken. To achieve economic development, complementary decisions and a facilitating environment must be in place; otherwise the impacts may be counterproductive. Included in this group of factors are the sources and methods of finance, the level of investment at different regional levels, the supporting legal, organizational and institutional policies and processes and various neces-sary complementary policy actions.
It must be noted that individually, the necessary conditions will have little or no impact on development. Even if two of the three conditions are met the effect will be limited. For example, if both the investment condition and political conditions are satisfied accessibility changes can be expected but economic growth impact will be lim-ited because of lacking economic conditions. In this case relative attractiveness of locations affected may change but this is merely redistribution of existing activities rather than additional growth.
Similarily, if only the investment and economic conditions are met, economic development effects may not fol-low because of the lack of supporting policies. A typical example is the land use policy that prevents firms and households from benefitting from the accessibility improvements by restricting the adaption of land use to changed conditions and maintaining the past land use. Another example is conflicting transport policies, e.g. separate and competing rail and road investments not supporting to each other.
4
TOOLS FOR ECONOMIC DEVELOPMENT IMPACT ASSESSMENT
4.1 Transport project assessment (cost benefit analysis CBA)
Cost benefit analysis (CBA) is generally used by governments and private sector to evaluate the desirability of a given policy. It is an analysis of the expected benefits and costs that aims to provide a basis for comparing alter-natives within a given project, and for comparing different projects. CBA determines, whether an investment or decision is feasible. Theoretically, an accurate CBA identifies choices that increase welfare from a utilitarian per-spective. The quality of the CBA depends heavily, among other things, on the valuation of present and future costs and benefits, on the definition of the reference alternative and, on the quality of relevant forecasts. Transport project assessment is the main instrument used in the planning and decision-making of transport in-vestments. It follows the principles of practical cost benefit analysis. Project assessment includes an analytic es-timation of the costs and benefits of a given project in monetary terms. The underlying idea is socio-economic efficiency – that is efficient allocation of scarce resources with the aim of maximising the welfare of society as a whole. The form and various details of project appraisal methodology vary from one country to another. There is no universal agreement on the extent to which costs and benefits should be disaggregated, which impacts should be included in the analysis and how they should be monetarily quantified.
Both Finland and Sweden have used CBA-based project assessment in the transport sector for decades (see e.g. Eliasson 2013). All major national transport investments in both countries have been evaluated using a harmo-nised assessment framework. One of the main purposes of the harmoharmo-nised guidelines is to make sure that transport investment suggestions from different parts of the countries concerning different modes of transport are comparable to a reasonable degree. Most or all major transport investments in Finland and in Sweden are financed through the State budget with no or relatively little regional funding. The methodological details within the framework (discount rate, unit values, calculation period, transport modelling, etc.) have been under con-tinuous development. There are several differences between the project assessment methodologies in Finland and in Sweden. 2
The standard transport project assessment (or CBA) includes the estimates, valuation and analysis of the follow-ing components:
– Investment costs and maintenance costs of the transport authority
– Generalised user costs (time, operating costs, convenience, etc.) in private travel, business travel and freight transport
– Traffic safety (the number and costs of fatalities, injuries and material damages) – Producer surplus for transport operators
– Transport-related tax revenues (fuel tax, congestion tax, vat of tickets) – Emissions (the amount and costs of CO2, NOx, SO2, particles)
– Noise (the magnitude and costs of noise exposure).
There are several generally recognised weaknesses in transport Cost benefit analysis, namely (OECD 2002): – It favours some groups of users (bias resulting from CBA’s reliance on willingness-to-pay as a measure
of opportunity costs)
– It fails to incorporate all of the external effects of projects (e.g. environmental impacts, social effects and wider economic effects)
– It fails to deal with distributional effects (e.g. impacts on deprived areas).
2 The differences relevant in the context of wider economic benefits are in focus in Chapters 5.2 and 6.1 of this report.
There are two ways to respond to these weaknesses. The first is to expand the monetary valuation of impacts to incorporate more non-monetised impacts into the CBA methodology. The second is to incorporate the CBA anal-ysis and results into a wider appraisal framework. These two approaches are complementary to each other. In Finland and in Sweden, transport project assessment includes also qualitative or sometimes quantitative esti-mation and analysis of a number of non-monetised impacts.
The standard transport project assessment is needed to estimate and value the direct economic impacts of any transport investment. This knowledge may not be sufficient enough for the decision-making, as already dis-cussed earlier in this report, but it is necessary for the estimation of the wider economic impacts.
4.2 Surveys, interviews and market studies
4.2.1 Interviews and surveys
Interviews and surveys can give both qualitative and quantitative information about the expected economic de-velopment impacts of an investment. One method is to conduct interviews with local businesses and officials fo-cusing on their views and plans regarding the transport investment in question. Survey-type methods used for economic impact analysis include (Sinha and Labi 2007):
Expert interviews: Interviews of persons who have accumulated information and experience in busi-ness conditions in the region. Leaders and planners of local governments and researchers in the local universities, for example, may be useful contacts in this context.
Business surveys: Surveying local business leaders, representatives of business organisations, for ex-ample, to collect data concerning the potential short-term effects of the proposed investment. Ques-tionnaires may be delivered by Internet, by post or by interviews conducted in person or by telephone. Shopper origin-destination surveys: Surveying shoppers in the local communities to collect data of how
the shopping and trip-making patterns could be affected by changes following the proposed investment. Corridor inventory methods: Surveying the users of a particular transport corridor by windshield
sur-veys, vehicle origin-destination logs and business activity data collection.
Case Järvenpää–Lahti motorway and Kerava–Lahti direct rail line in Finland
The Järvenpää–Lahti motorway was opened to traffic in two phases during the years 1998-99. The Kerava–Lahti direct rail line was completed in the year 2006. Information on the traffic and socioeconomic impacts along this transport corridor was compiled and analysed by Meriläinen et. al. (2011). Statistical data and information from separate studies were completed by a questionnaire study for rail passengers and road users as well as by inter-views in Lahti and Mäntsälä.
According to the study, freight transport volumes on the new railway-line have been lower than expected. About half of rail passengers and one-fifth of road users indicated that the direct rail line increased their train travel. Regarding travellers between the Helsinki and Lahti regions, a share of almost 30 % of rail passengers indicated that the direct rail line affected their choice of residence or job location. Positive net migration from the Helsinki Metropolitan Area to Mäntsälä and also to the Lahti urban region has further accelerated after the completion of the direct rail line. New residential areas have been constructed in the vicinity of stations. Lahti station area has also developed into a specialised business district due to faster railway connections.
Business development that requires cargo transport has totally relied on motorway connections. New competing business and logistics areas have emerged and existing areas have strengthened their position in interchange areas, although this development has not been very strong. Missing sidings to industrial areas prevent the devel-opment railway freight transport operations.
New transport infrastructure has increased municipal expenses due to new construction, population growth and busi-ness development. Tax revenues will also increase, but surplus in municipal economy can only happen in the longer run. It is, however, difficult to separate the impacts of transport infrastructure development from the impacts of, for example, economic trends and steering mechanisms of municipal economy.
4.2.2 Market studies
Market studies are smaller-scale analyses typically related to impacts to local business within a region, not across regions. Market studies can help estimate the existing levels of supply and demand for the main business activities within the study area and then to estimate the expected changes with improved accessibility and re-duced transport costs.
Market studies may use various kinds of tools to collect and analyse information about the local economy. Inter-views and surveys (see chapter 4.2.1) are useful. Gravity models are also used to predict effects on business ac-tivities. Gravity models are based on the assumption that changes in business activities are proportional to changes in accessibility (Sinha and Labi 2007):
∑
where Ai is the accessibility of location i, Dj is the number of business opportunities of a particular type at loca-tion j, tij is the generalised cost of travel from i to j and α is a calibrating factor that is typically between 1,5 and 2,0.
4.3 Comparative analysis – Case studies
Comparative analysis or case studies are based on the assumption that impacts of a particular transport invest-ment are to a large extent similar to the impacts of a same kind of investinvest-ment in the past. This approach is appli-cable if the study area is relatively small and comparable case studies are available. Case studies are particularly useful in public communications and hearings to facilitate common understanding of the possible economic ef-fects with concrete examples instead of complex economic analyses. The selection of the appropriate case stud-ies, however, can be subjective and the argumentation for the project in question may be intentionally directed to a desired direction. (Sinha and Labi 2007.)
A meta-analysis of a large number of case studies, on the other hand, can be very fruitful in drawing an overall view of the wider economic impacts. The key findings of the case of T-Pics (see case below) are in line with the generalised descriptions of the wider economic impacts presented in chapters 2 and 3 of this report.
Case Transportation Project Impact Case Studies (T-PICS), USA
T-PICS (2013) is a web-based viewing and analysis system for the case studies of wider economic impacts of road investments in the USA. The project was carried out under the second Strategic Highway Research Pro-gram (SHRP 2) of Transportation research board of the National academies. The economic impacts were stud-ied by producing 100 before and after case studies of the impacts on economic and land development of high-way and highhigh-way/intermodal infrastructure projects. A national database of case studies was created, and a web tool for viewing and using the findings.
The case studies included statistical analysis of empirical data and identification of common themes from the qualitative interview reports. Key findings of the case studies were (TRB 2012):
a) Transport infrastructure projects lead to multifaceted forms of economic development impact, which may include effects on employment, income, land use, property values, or building construction.
b) The form of impact varies by the type and setting of the project.
c) Impacts unfold over time, so no single project will necessarily show every type of impact at the same time. For that reason, multiple impact measures and an appropriate period of observation are needed to fully capture economic development impacts.
d) Overall, 85% of the projects show evidence of positive economic impacts, while the rest show either no net impact or a small negative impact. However, the impacts were measured at different spatial scales de-pending on the size and breadth of the project, which varied from 2-mile, short-access roads to major
in-terstate highways spanning several hundred miles.
e) Project cost and job growth impacts vary by project size, type, and location.
f) Project location matters. Larger numbers of jobs are generated by projects in metropolitan settings than by those in rural settings. Rural projects tend to have lower costs and take less time to build than those in metropolitan settings, although job growth in rural areas also tends to take longer to emerge than in met-ropolitan areas.
g) The economy and business climate of the project area are critical factors affecting the magnitude of pro-ject impacts. Propro-jects in economically vibrant areas with complementary infrastructure and zoning regu-lations tend to generate more long-term jobs than do projects in areas without those features.
h) Motivations for projects differ, and projects with a coordinated economic development effort (involving complementary policies) generally facilitate more long-term job growth than do projects that lack local supporting policies.
4.4 Land-use–transport interaction simulation models
Several simulation-based models have been developed and used to predict how the markets respond to changes in land-use and transport accessibility. These so called LUTI-models are a type of microeconomic simulation models that treat in detail the factors affecting the location decisions of firms and households. The models in-clude explicit modelling of both transport and land-use. The basic interactions of the LUTI-modelling is as fol-lows: Changing transport time or costs changes the accessibility to jobs, workers, and location of consumption, which in turn will over time affect the location of firms and households. The changes of land use patterns will have feedbacks on transport costs which in turn will affect location decisions. (Sinha and Labi 2007, Kernohan and Rognlien 2011.)
LUTI-models typically take the region’s economic and demographic projections as fixed input and predict the redistribution of these following a transport investment. The LUTI-models are thus appropriate for understand-ing the dynamics of urban or regional economic impacts but do not take into account the impacts on economic growth.
4.5 Economic multiplier – Input –output (IO) models
Input-Output models trace the flow of industries’ income and calculate how changes in one industry affect growth in the rest of the economy (Guide, 2006). According to Wallis (2009) correctly defined, IO models evalu-ate the wider economic effects as follow:
Indirect production effects: re-spending by firms that receive income from the sale of commodities to firms undertaking the direct activities;
Induced consumption effects: resulting from re-spending by households receiving income from employ-ment in direct and indirect activities.
The main outputs of analyses using IO models are changes in GDP/GSP (Gross Domestic Product and Gross State Product), employment and income. The results of IO models are typically reported for given years in the project construction period and the project operational period and can be of regional, multiregional, or national scope. IO results can be seen as short-run effects, because only the output effects are denoted. In the longer run also the price effect must be accounted for.
While IO models have rather limited use for transportation impact analysis, these models are widely used to present the labour and income impacts of operating or expanding infrastructure investments. However, estima-tion of the impact of changes in costs or market access, which are the two key impacts of most of the infrastruc-ture investments, cannot be obtained via IO models. The IO model is often chosen by policy makers due to its ra-ther simple structure, comparing to ora-ther methods, and to its sometimes mandatory status.
4.6 An overview of computable general equilibrium (CGE) models
Computable General Equilibrium models are used in Europe and the world as models of the economy for large regions and nations. CGE models usually have a spatial component, tracking transportation connections and trade among regions, and an industry component, tracking the cost of freight transportation by commodity group between regions. The models estimate the economic impact of infrastructure projects and policies by cal-culating their impact on interregional infrastructure cost, value of capital stock, effective labour supply, and overall factor productivity. This may include effects of changing travel times, reliability, accident rates, conges-tion levels, and operating costs. In the end, the macroeconomic response is estimated as changes in industry growth and related to it changes in commodity trade between regions (NCFRP, 2011).
Using CGE models is one method of dealing with the limitations of the IO models. CGE models represent a micro- and macro-economic approach to analysing transport infrastructure. They often use intermediate demand and other data from the I-O tables. The main data source for the Social Accounting Matrices (SAMs) is national and regional economic accounts. CGE models use econometric estimates for the parameters and elasticity values. CGE models allow for the resource constraints on availability of labour, capital and land. Also the structures for private consumption and government spending can be added to the model. In fact, the CGE models include not only the influence of the changes in the output, but also the price impacts coming from changes in relative prices. The models can thus be used in both short and long run scenarios. For these reasons, CGE models deal better with economic interactions and represent more sophisticated modelling approach than IO models.
CGE models use wide quantitative information relating to labour market data, detailed commodity flows, and national and regional accounts data. The economy is presented as a system of flows of goods and services be-tween sectors, including produced commodities and primary factor services (labour, capital, land). Typically, the decision makers include the household, several industry sectors, government and the foreign sector. It is the ability to incorporate constraints (i.e. behavioural assumptions) into modelling that favour CGE models among the other assessment methods. The behavioural assumptions indicate how linked sectors respond to given shocks (changes in the economic environment) and how these shocks are transferred to other sectors. CGE models make particular assumptions of the behaviour of consumers, producers and investors using established micro- and macro-economic theories, well tested methods of econometrics and reliable algorithms from applied mathematics.
Similarly to IO models, results for CGE models are usually reported for given years in the project construction and operational period (Wallis, 2009). The impacts of infrastructure investments measured by CGE models in-clude usually the effects on GDP/GSP, employment, investments, trade (imports and exports), consumption, wages and taxes, which makes CGE models particularly attractive for decision makers. According to Sue Wing et al. (2007) recent applications of CGE have made advances by presenting travel time as a negative impact on the utility and production functions of households and firms, and treating transport supply and demand interactive-ly within the models. As is the case of all evaluation methods, CGE has its drawbacks that are presented in Table 1.
Among CGE models one can distinguish comparative-static, dynamic and spatial models; all three are possible to apply for infrastructure investment assessment, but are not equally adequate for it.
Comparative-static CGE model is the most commonly used CGE model worldwide. It does not have a time dimen-sion and it omits inter-temporal relationships between endogenous variables. It is often criticised for its incapa-bility of analysing the impacts of transport investments that have a ‘long tail’ with respect to construction ex-penditures and flow-on impacts within the local area. The infrastructure investment will therefore affect local and global economies for many years, as local development gradually takes advantage of the new infrastructure facilities (Docwra & West, 1999).
Dynamic CGE model in a contrast, explicitly trace each variable through time. For example, a dynamic CGE model can link changes in the capital stock in one period with past levels of investment and savings (using specified
elasticity measures) where all of these are defined as endogenous variables (Docwra & West, 1999). Labour dy-namics are often included, where the change of population due to the infrastructure investment is estimated. Dynamic CGE model is said to be more realistic, but at the same time more difficult to construct and solve. Spatial CGE model (SCGE) is either a comparative-static or a dynamic model of interregional trade and location based in microeconomics, using utility and production functions with substitution between inputs. SCGE models have a sophisticated theoretical foundation and non-linear, rather complex mathematics enabling to model (dis)economies of scale, external economies of spatial clusters of activity (Ivanova et al., 2007). According to Williams (et al., 2002) SCGE models can successfully represent the relationship between economic development and transport demand. By taking into account both technological change and the recycling of revenues from in-frastructure charging policies through the economy, SCGE models provide a constant framework for economic responses.
Sundberg (2009) lists, as one of the reasons of increased used of SCGE, the increased demand for tools that may assist in the assessment of policies, especially for the assessment of the economic impacts of infrastructure in-vestments and other transport related policies. One example of SCGE model successfully used in infrastructure investment assessment is CGEurope developed by Johannes Bröcker. Its main goal is to quantify regional welfare effects of transport related and financial-economic policies (Tavasszy, 2007).
Table 1. Comparison of IO and CGE models (partially based on MOTOS 2007 and Wallis 2009)
Model Major output Advantages Disadvantages/Limits I-O vs. CGE
IO Range of macroe-conomic variables; employment, in-come and GDP/GSP Provides measure of macro-economic im-pacts of interest to poli-cy makers
Fixed Price equilibrium
Linear Leontief structure High data requirements Tend to exaggerate economic
benefits
Does not allow for constraints on various factors, resulting in over-estimate of impacts
No allowance for environmental and some accident externalities, partial allowance for non-work travel time
Does not provide clear and direct measure of net project benefits (costs)
Usually of comparative-static character
Complexity: medium/large Simple technique for
com-mon decision maker May be more practical for
modelling small regions than CGE
CGE Range of macroe-conomic variables; relative prices,
employment, con-sumption, invest-ment, taxes, ex-ports and imex-ports, industry output impacts and GDP/GSP
Provides measure of macro-economic im-pacts of interest to poli-cy makers
Non-linear behaviour, flexible structure Flexible description of
the supply and demand side of the economy
High data requirements Determination of parameter and
elasticity values
Usually no allowance for environ-mental and some accident exter-nalities, partial allowance for non-work travel time
Highly complex, expensive and data required process
Modelling approach is not trans-parent and open (black box) Questionable assumptions and
relationships may be hidden
Complexity: Large IO can be used as a base for
CGE
Allowance for constraints provides more realistic modelling of outputs than IO and more comprehensive approach to the estimation of regional economic effects Unlike IO; specific
assump-tions about the behaviour of consumers, producers and investors
Selected CGE and other models dealing with the economic impacts of infrastructure investments from Finland, Sweden, Norway, Poland and Germany are presented in an appendix of this report.
4.7 The RegFinDyn model
Regional CGE RegFinDyn3 model is well designed for infrastructure impacts estimations and it has many ad-vantages over the older, linear calculation methods such as IO.
RegFinDyn model includes and takes into account a large number of economic factors, among others: constraints on total availability of factors of production (labour, capital, land)
sectorial production and their demand for factors of production dependencies of producer sectors in expenditures and sales effects from differences in business structure between the regions transport services presented as three sectors (Rail, Road, Other) transport margins and productivity changes
substitution guided by relative prices between Rail and Road transportation transportation infrastructure investments
operation phase of transportation infrastructure investments,
households’, businesses’ and public sector’s non-linear decision-making investors’ cautious profit-seeking behaviour
time dimension
capital stock accumulation via net investments guided by the changes in the rate of return to capital wage differences between the regions
regional population changes and demographics
money flows into-and out from the region through domestic and international trade.
RegFinDyn is a dynamic version of the comparative-static RegFin model; influenced by famous Australian ORANI, MONASH, MMRF and TERM models (Wittwer 2012). The family of RegFin models has been developed and used since 1998. The model is built on a neo-classical economic theory (Figure 2).
Figure 5. RegFinDyn model’s theory
3The basic CGE description is presented in publications Törmä (2008) and Rutherford and Törmä (2010). The detailed de-scription of the model can be found in Törmä and Zawalinska (2010, 2011) and with emphasis on transport impact in Metsäranta (et al., 2012). See also http://www.helsinki.fi/ruralia/research/regfin.htm
In RegFinDyn, like in all CGE models, the key principle is that in the regional economy ‘everything affects every-thing’. For this reason, no part of the economy can be analysed separately.
Figure 6. Interdependencies in the RegFinDyn model
Relative prices are the engines of economic adaptation. In the change of economic conditions, the relative prices changes guide the economy towards new equilibrium. In RegFinDyn the relative prices and quantities can find their correct new values only when all markets in the economy are in equilibrium, so supply is equal to demand. In this case the whole economy is said to be in general equilibrium. In some model versions labour markets are not in equilibrium due to existing unemployment.
RegFinDyn model takes into account all money flows into and out from the analysed region, so calculations are done on a net basis.
As for every dynamic model, the additional feature of RegFinDyn over the RegFin model is the time dimension. Economic impacts are calculated year by year for a specific time period, for example years 2007-2020. Dynamic calculations require setting up the baseline that is the image of the future without the considered changes. With the calculation over the time, the model shows the dynamics through the interdependence between sectorial in-vestments and capital stocks.
Another distinguish feature of RegFinDyn among other CGE models is the population module. The factors affect-ing the regional population in the model are birth and death rates and domestic and foreign net migration (in- minus out- migration). The model produces the population structure by gender in 1-year-cohorts up to 100 years of age. The importance of the population module lies in its link to the labour force, citizens’ well-being as well as the high interest of public sector in anticipating demographic changes causing changes in provision of public services.
Agglomeration (see Chapter 3.2) is measured in RegFinDyn through each region’s share of national labour costs compared to previous year. Thus, we use the share of regional labour cost as a simple proxy for effective density. Regions increasing their share of labour use enjoy an additional increase in productivity. However, agglomera-tion impacts are assumed to vary by industry according to elasticity estimates reported by Kernohan and Rogn-lien (2011). The productivity gain from agglomeration is largest in knowledge-intensive services like financing (elasticity 0,08–0,09) and smallest in primary production (elasticity 0,03–0,04). In transport-related services the elasticity is 0,057.
4.8 Integrated CGE – transport models
Integrated models are the promising yet expensive and complicated methods of estimating economic impacts of infrastructure investments. Linking economic modelling (CGE) with traditional transport modelling aims in ex-ploration of the advantages of the two approaches. However, there are significant complications due to the many inherent differences in the methodologies, but also the differences between ‘language’ of the engineers and economists. CGE models operate on data from a normal of most recent year and on an aggregated scale, while traditional transport models are based on cross-sectional analyses, often applying a detailed spatial reso-lution to precisely describe route choice. CGE models estimate monetary flows by economic sectors based on, e.g., CPA classification, while transport models use commodity classification, both methods are difficult to com-bine. Integrated models are still rather scarce. Among few European cases are (See: MOTOS, 2007, Monzón et al., 2010, Vold et al., 2002, 2007):
The national freight models in Norway: SCGE model of Norwegian economy (PINGO) and the network model for freight transport within Norway and between Norway and other countries (NEMO);
TRANS-TOOLS: European transport network model including simplified CGEurope model. 4.9 Conclusions
The standard transport project assessment (CBA) is the basic tool to estimate the direct economic impacts of a transport investment. This is necessary but not sufficient for the estimation of the wider economic impacts. There is a growing need to know more about the wider economic impacts regarding individual infrastructure projects and also more generally concerning transport policies. There are several analytical techniques for the estimation of these economic development impacts, varying from simple case studies and surveys to complex economic simulation modelling. However, a single analytical tool that is equally useful to all of the information needs in the planning and decision making, is impossible to name. The general rule for the selection of the ana-lytical tool is to match the tool to the purpose and level of desired sophistication of the analysis – and the given resources (NCFRP 2011, Sinha and Labi 2007).
Considering a solid analysis of the wider economic development impacts, one can name the necessary core fea-tures of a capable assessment tool (US DoT 2006, Williams et. al. 2002, De Jong and Gunn 2004):