Air Pollution and
Public Health in
North Carolina
Air Pollution and Public Health
in North Carolina
Travis Madsen
Elizabeth Ouzts
The authors greatly appreciate the timely input and insightful review offered by Dr. J.C. Chen and Dr. David Richardson of the University of North Carolina School of Public Health, Department of Epidemiology; Dr. David Leith of the University of North Caro-lina Department of Environmental Sciences and Engineering; and Dr. David Bates, Pro-fessor Emeritus of Medicine, University of British Columbia. Tony Dutzik and Elizabeth Ridlington of the Frontier Group generously provided editorial and research assistance. The financial support of the Z. Smith Reynolds Foundation and the Energy Foundation made this project possible.
The views and opinions expressed here are those of the authors and do not necessarily reflect the views of our funders or of individuals who provided review. The recommenda-tions are those of the Environment North Carolina Research & Policy Center. Any factual errors are strictly the responsibility of the authors.
© Environment North Carolina Research & Policy Center
In 2006, Environment North Carolina Research & Policy Center became the new home of North Carolina Public Interest Research Group (NCPIRG) Education Fund's environ-mental work.
Environment North Carolina Research & Policy Center is a 501(c)(3) organization. We are dedicated to protecting North Carolina’s air, water and open spaces. We investigate problems, craft solutions, educate the public and decision makers, and help North Carolin-ians make their voices heard in local, state and national debates over the quality of our environment and our lives.
For more information about Environment North Carolina and Environment North Caro-lina Research & Policy Center, see our Web site at www.environmentnorthcaroCaro-lina.org or contact our offices at (919) 833-0015 or by email at info@environmentnorthcarolina.org. Additional copies of this report can be obtained online at www.environmentnorthcarolina.org or in print by sending $10 per copy to:
Environment North Carolina Research & Policy Center 112 South Blount Street, Suite 102
Raleigh, NC 27601
Table of Contents
Executive Summary
4
Introduction
8
Exposure to Air Pollution and How it Causes Harm
9
Air Pollution in North Carolina
10
Soot (Particulate Matter)
11
Smog (Ground-Level Ozone)
13
Health Damage Caused by Air Pollution
in North Carolina
15
Premature Death
16
Hospital Stays and Emergency Room Visits
18
New Cases of Chronic Disease—Asthma and Bronchitis
20
Asthma Attacks
22
Missed Work Days and Sick Days
22
Air Pollution and North Carolina’s Children
23
Infant Death
24
Asthma Attacks, Acute Bronchitis and Missed School Days
24
Clean Air Policy Recommendations
27
Sources of Dirty Air
27
Policies Aimed at the Largest Pollution Sources
27
Methodology
30
Sources of Uncertainty
34
Executive Summary
A
ir pollution in North Carolina makes people sick and cuts lives short. Air pollution triggers heart attacks and strokes. It causes diseases like chronic bronchitis, asthma and lung cancer. It sends people to the emergency room with respi-ratory problems, causes asthma attacks, and contributes to respiratory illness in other-wise healthy people. At the root of all of these problems, air pollution irreparably damages lung tissues in ways similar to sec-ond-hand tobacco smoke.In this report, we estimate the health impact of air pollution above natural back-ground levels in North Carolina. The esti-mates cover particulate pollution (or soot), which comes from smokestacks and vehicle exhaust, and ground-level ozone (or smog), which develops across much of the state on hot summer days as a result of emissions from cars, trucks, smokestacks and other sources. The estimates rely on a number of information sources: 2003 air pollution monitoring data from the U.S. Environ-mental Protection Agency (EPA); statistics about the frequency of health problems from the North Carolina State Center for Health Statistics and the U.S. EPA; scien-tific studies linking air pollution and health problems; and methodology based on simi-lar work from the U.S. EPA and the World
Health Organization. Taken together, these sources reveal that air pollution places a sig-nificant burden on the health of all North Carolinians.
Many North Carolina residents suf-fer health problems caused by pollution even at levels that meet air pollution standards.
• Despite the fact that air pollution levels in North Carolina meet health standards during much of the year, even “safe” levels of pollution can cause damage. Scientific experiments show no threshold below which pollution does not have an effect.
Air pollution causes illness in other-wise healthy people.
• Air pollution causes in the range of a half-million missed work days each year, and millions of cases where North Carolinians experience symptoms like shortness of breath or runny nose.
Air pollution causes thousands of people to be admitted to area hospitals every year and increases the burden of chronic disease.
Executive Summary 5 • Air pollution leads to an estimated
6,000 hospital admissions for respiratory disease and 2,000 for cardiovascular disease annually. • In addition, air pollution causes
approximately 1,500 new cases of asthma and 2,500 new cases of chronic bronchitis in adults every year.
• Among asthmatics, soot pollution causes an estimated 200,000 asthma attacks annually, with an additional 200,000 caused by smog.
Every year, air pollution kills thousands of people in North Carolina.
• Air pollution causes about 3,000 premature deaths in North Carolina annually, accounting for between 3 and 7 percent of all deaths not caused by violence or accidents.
• Compared to national statistics, air pollution ranks as the third highest risk factor for premature death, behind smoking and poor diet/physical inactivity.
• Tables ES-1 and ES-2 provide a summary of the health impacts of air pollution in North Carolina, including central estimates as well as upper and lower boundaries of statistical precision.
Children are especially vulnerable to the effects of air pollution.
• Every year, air pollution causes dozens of infant deaths and hundreds of thousands of school absences due to illness. (See Table ES-3.)
• Injuries caused by air pollution in early in life can have permanent consequences.
Aggressive action to reduce air pol-lution can improve public health and reduce the societal cost of pollution-caused illness.
In 1999, the two largest sources of North Carolina’s air pollution were coal-fired power plants and automobiles. In 2002, the
state Legislature passed the Clean Smoke-stacks law, which will reduce power plant pollution in-state by more than 70 percent over the next seven years. Reducing pollu-tion from vehicles is the next priority step toward healthy air at the state level. Because emissions from vehicles and industrial fa-cilities located upwind from North Caro-lina also contribute to the overall problem, action at the regional and federal level will also be required.
State Level Actions:
• Strengthen limits on automobile air pollution in line with New York, Massachusetts, New Jersey, Connecti-cut, Rhode Island, Maine, Vermont, California, Oregon and Washington. • Require retrofitting of diesel engines
with particulate filtration systems, including school bus fleets and con-struction equipment.
• Reduce car-dependent land use practices and sprawl.
• Increase transportation funding for transit, rail freight, and other alterna-tive transportation projects.
Federal and Regional Level Actions:
• Fully enforce the Clean Smokestacks Act, pursuing all available means to reduce pollution in neighboring states. • Restore the New Source Review
provision of the federal Clean Air Act and require the oldest coal-fired power plants and other industrial facilities in the country to install modern emis-sions control technology.
• Limit nationwide industrial emissions of sulfur dioxide, nitrogen oxides, and mercury to between 10 percent and 30 percent of 2000 levels.
• Strengthen national emission standards for cars and trucks to match or exceed standards adopted by California and other states.
Table ES-1: Annual Public Health Damage from Smog (Ground-Level Ozone) in North Carolina
Health Effect Estimated Cases Range
Adult Onset Asthma (Males, 25+) 1,500 900 –1,900
Respiratory Hospital Admissions 4,000 3,000 – 5,000
Asthma Attacks 200,000 100,000 – 300,000
Restricted Activity Days 1 million 800,000 – 1.4 million
Increased Symptom Days 4 million 2 million – 6 million
Table ES-2: Annual Public Health Impact of Soot (PM10) in North Carolina
Health Effect Estimated Cases Range
Premature Death (Adults) 3,000 2,000 – 4,600
Respiratory Hospital Admissions 2,000 1,700 – 2,600
Cardiovascular Hospital Admissions 2,000 900 – 2,500
New Cases of Chronic Bronchitis 2,500 260 – 4,400
Asthma Attacks 200,000 100,000 – 390,000
Missed Work Days 500,000 440,000 – 520,000
Restricted Activity Days 5 million 4.1 million – 5.5 million
Increased Symptom Days 15 million 7 million – 23 million
Table ES-3: Annual Air Pollution Damage to Children’s Health in North Carolina
Health Effect Estimated Cases Range
Infant Deaths 50 30 – 60
Asthma ER Visits 1,500 200 – 3,500
Acute Bronchitis 20,000 13,000 – 33,000
Asthma Attacks 100,000 90,000 – 120,000
Executive Summary 7
How to Interpret Health Effect Estimates
T
he numbers reported here are an illustration of the likely health impacts of air pollution commonly found in North Carolina. The estimates are subject to sev-eral sources of scientific uncertainty, which could make the actual numbers higher or lower. Where possible, we attempted to make conservative assumptions—mean-ing the scope and scale of the impacts of air pollution may be larger than reported here. Sources of uncertainty include:• The report does not capture or quantify all the effects of air pollution—for example, air pollution could affect development before birth, predisposing adults to disability or disease.
• The scientific studies that form the foundation of the estimates rely on statisti-cal models that are sensitive to input assumptions.
• Health systems do not track events like asthma attacks, making frequency estimates necessary. These estimates may not reflect local conditions perfectly. • Population exposures to air pollution are estimated based on readings at fixed
monitors. Errors in extrapolating exposure to the whole population, either in this report or in published scientific literature, could affect the accuracy of our estimates.
Introduction
A
ir pollution in North Carolina is a ser-ious and persistent problem.The American Lung Association gives Charlotte, the Triad, the Triangle and the Asheville region an “F” for air quality—and that’s just for smog pollution.1 Particulate
pollution also poses major health risks for North Carolinians, especially children and the elderly.
Air pollution shortens lives, sends people to the hospital and the emergency room, and triggers asthma attacks. These are merely the most visible signs of the health threat posed by polluted air. Air pollution affects every individual, reducing lung func-tion and increasing the risk of illness.
Nor are we safe on days when air pollu-tion levels are below those recognized by government as meeting federal standards. Ozone smog and particulate soot can af-fect health even on days when an air pollu-tion alert is not in effect.
This is especially true for people who live, work or play near busy roadways. The World Health Organization and the American Academy of Pediatrics recom-mend that communities take action to
reduce pollution—especially traffic-related pollution—to improve public health.2
It wasn’t supposed to be this way—not in 2006. When Congress adopted the fed-eral Clean Air Act in 1970, it established the goal of setting and achieving air qual-ity standards protective of human health by 1975. Nearly three decades later, North Carolina’s air still fails to meet established health standards—standards that may not be fully protective of human health.
With the rollback of key air pollution policies at the federal level—and with in-creased motor vehicle traffic, population, and overall energy use threatening to un-dermine the progress we have made toward cleaner air—North Carolina has reached a critical juncture. Solutions do exist. From modern emission controls for cars and power plants to effective transit systems, we have the technological know-how to sig-nificantly cut the amounts of air pollution in North Carolina air.
By adopting public policies that put these technologies to work, North Carolina can reduce air pollution and help millions of its citizens to live longer and healthier lives.
Exposure to Air Pollution 9
M
ost people think of air pollutiononly on days when the news an-nounces an air quality alert, warn-ing of high levels of smog. Unfortunately, people in North Carolina aren’t exposed to air pollution just a few dozen times a year on bad air days. North Carolinians breathe air pollution day in and day out through-out their entire lives.
Much of the pollution comes from burn-ing fossil fuels for energy—in cars, trucks, power plants, industrial facilities, and en-gines. Many of these pollutants are invis-ible, and they are everywhere. They mix together in the atmosphere and react in complicated ways to form a toxic soup.
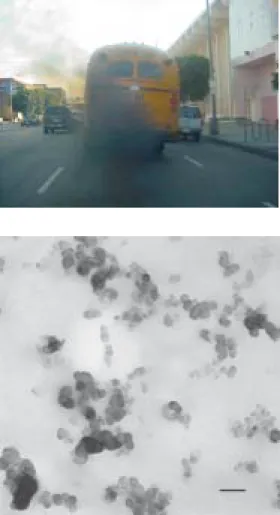
On bad air days, visibility plummets and the air looks thick and hazy. (See Figure 1.) Sometimes the sun even looks red as it sets due to pollutants in the air. These clouds of haze contain hundreds of toxic chemicals. Two of the most harmful air pollutants are soot and smog. Soot, or particulate pol-lution, contaminates the air year-round. Power plants, engines and motor vehicles emit soot directly into the air. Chemical reactions between gaseous pollutants in the air can also create fine particles. Smog
plagues summer days when intense sunlight transforms air pollutants and oxygen into toxic gases such as ozone.
Exposure to Air Pollution
and How it Causes Harm
These two photos depict good and bad air quality days in North Carolina. Each photo depicts the same view from the WRAL tower off US 70 southeast of Raleigh near Clayton. However, in the second photo, visibility is greatly reduced by a cloud of smog containing ground level ozone and particulates.
Figure 1: Clear and Polluted Days in Raleigh
Air Pollution in
North Carolina
Smog and soot reach unhealthy levels regu-larly in North Carolina. Annual average soot concentrations in the state (measured as particulate matter (PM) less than 2.5 micrometers in diameter) range from about 8 micrograms per cubic meter in the least polluted parts of the state to 16 micrograms per cubic meter in the most polluted areas.3
(See Figure 2.)
During the summertime ozone season from April through October, the average daily peak one-hour ozone levels reach
47-61 ppb across the state. (See Figure 3.) On hot summer days, ozone levels routinely exceed EPA health standards in the central part of the state.
If there were no human-induced air pol-lution emitted in North America, PM10 lev-els would be between 5 and 10 micrograms per cubic meter, and afternoon smog levels in the spring, summer and fall would be 15 to 30 ppb.6 If pollution were not emitted
from other countries in the world as well, natural background levels would be even lower.7
Soot and smog cause damage when they come in contact with lungs. Ozone quickly
Figure 3: Average Smog Levels in North Carolina, April to October 20035
Figure 2: Average Soot Levels in North Carolina, 2003 (PM2.5)4
High: 17 Low: 8 Micrograms per cubic meter High: 68 Low: 46 Parts per billion
Exposure to Air Pollution 11 reacts with airway tissues and produces
flammation similar to a sunburn on the in-side of the lungs. Particulates travel deep into the lower passages of the lungs and become trapped there, delivering a payload of toxic chemicals. Constant exposure to these pollutants over time permanently damages lung tissues, decreases the ability to breathe normally, and exacerbates or even causes chronic disease.
Soot (Particulate Matter)
Back in the early days of the industrial revolution, thick black smoke poured from factories and coal-fired furnaces. Dur-ing the 1952 “Great Fog,” one of the most notorious pollution events in history,Strengthening National Air Quality Standards
T
he Environmental Protection Agency (EPA) sets national air quality standards under the authority of the federal Clean Air Act. Under the law, the EPA is supposed to review the standards every five years and adjust them based on the latest scientific knowledge of what will protect public health with an adequate mar-gin of safety.8Because of industry resistance, the standards trail scientific understanding of how dangerous air pollution really is. For example, EPA tightened standards for both soot and smog in 1997, based on accumulating evidence that soot and smog were more harmful than previously believed. However, the American Trucking Associa-tion led a coaliAssocia-tion of industries in a lawsuit against the new standards. Ultimately, the Supreme Court rejected industry arguments and upheld the standards in 2001.9
The process delayed implementation of the new standards for years.
Researchers have published more than 2,000 studies on particle pollution since the last standard-setting review in 1997, showing serious health risks at pollution levels well below current standards.10 In 2005, the independent Clean Air Scientific
Advisory Committee and staff scientists at the U.S. EPA both concluded that the standards for particulate matter were not adequate and recommended strengthen-ing them.11
However, the Bush administration disregarded the advice of these experts. In December 2005, the administration proposed standards weaker than recommended by its own scientists—ignoring their advice for the first time in history. As a result, the standards would leave millions of Americans exposed to particulate pollution at levels that pose clear risks to health.
12,000 Londoners died from intense pol-lution exposure.12
Today, the thick, black smoke character-istic of uncontrolled pollution has been re-placed with the more subtle and insidious dirty haze that can almost look natural be-cause of its frequent presence over the east-ern United States. However, this pollution is anything but natural. It comes from fuel burning, and mostly consists of fine soot, or extremely small and practically invisible particles in the air.
Some types of soot are simply unburned fuel particles. Other types of soot are cre-ated when pollutants react with each other in the atmosphere. Particles can contain hundreds of different chemicals from can-cer-causing agents like polycyclic aromatic hydrocarbons to metals from arsenic to zinc.
Forty to 1,000 times smaller than the width of a human hair, these fine particles result from burning fossil fuels like coal, gasoline, and diesel. For example, burning a pound of jet fuel creates 100 quadrillion particles.13 Gasoline and diesel engines with
and without catalytic converters emit par-ticles with a size of 0.1 to 1 micrometers, with the smallest particles coming from gasoline and medium-duty diesel engines.14
Fine particles can remain suspended in the air for weeks. They can travel through building shells and conventional heating and air conditioning filters. When inhaled, they are able to penetrate deep into the lung where they deliver their toxic payload. In contrast, larger particles such as dust or pollen travel shorter distances and are more effectively trapped in the upper airway.
Fine particles penetrate to the deepest part of the lung, where they are attacked and absorbed by immune cells. In an ex-periment in England, ultra fine carbon par-ticles showed up in the immune cells of every child tested—even in a three-month old infant.15 The particles were of the same
size emitted by motor vehicles, and chil-dren who lived close to busy roads had up to three times more particles in their bod-ies.
Some of the particles remain trapped in the lung, while others travel through the blood to the rest of the body.16 Scientists
have counted particulates in the lung tis-sue of cadavers. People from highly pol-luted Mexico City had two billion particles in every gram of lung tissue, and people from less polluted Vancouver, Canada had about 280 million.17
The chemicals delivered into the body by inhaled particulates are very dangerous. Some of them cause cancer, some cause ir-ritation to lung tissues, and some cause changes in the function of the heart.18 As a
result, particulates cause and aggravate a host of health problems, including lung cancer and cardiovascular disease.
Particulate pollution can cause irrevers-ible damage to children, interfering with the growth and development of the lungs.
For example, researchers at the University of Southern California followed the health of over 1,000 ten-year-olds until they reached 18. Children who lived in areas with higher levels of particulate pollution were less able to breathe with normal ca-pacity.19
Particulate pollution is also deadly, kill-ing upwards of 50,000 Americans every year. In fact, according to the largest study of the effects of particulates on mortality, breathing the air in major U.S. cities is about as dangerous as living or working with a smoker.20
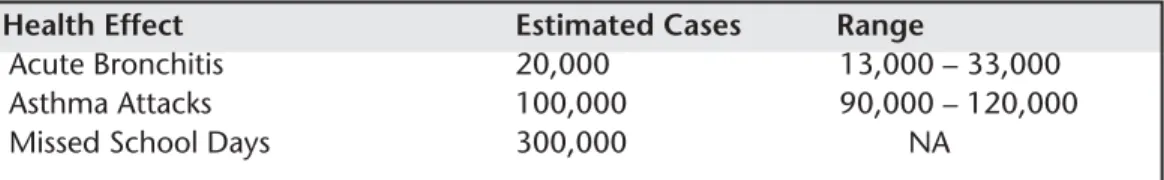
Figure 4: Soot Particles
Very small soot particles found in diesel exhaust.22 The scale bar represents 10
Exposure to Air Pollution 13
Smog (Ground-Level Ozone)
Smog can plague summer days in North Carolina. Smog results when a mixture of pollutants reacts under intense sunlight to form ozone.
In the past five years, ozone levels in North Carolina have exceeded federal health standards on as few as 5 days and as many as 51, with an average of 25.23
How-ever, ozone chronically contaminates the air at lower, but still harmful, levels from April through October.
A natural layer of ozone exists high in the atmosphere, absorbing ultraviolet ra-diation from the sun. However, when pol-lutants create ozone near the ground, it becomes a threat to public health.
Ozone is a powerful chemical gas some-times used to kill bacteria in drinking wa-ter. Bubbling it through contaminated water destroys any infectious organisms in the water and makes it safe to drink. Not surprisingly, the chemical has the same ef-fect on our lungs—when inhaled, it dam-ages lung tissue and causes short-term swelling. With long-term exposure at even low levels, it causes permanent and irrevo-cable damage.
Scientists have known for well over a decade that ozone at levels routinely en-countered in North Carolina causes red-dening and swelling and reduces the elasticity of lung tissues over time.24 Ozone
makes lung tissues more sensitive to aller-gens and less able to ward off infections.25
It scars airway tissues. Children exposed to ozone develop lungs with less flexibility and capacity than normal. During high smog days, otherwise healthy people who exer-cise can’t breathe normally.26
New scientific evidence continues to show dramatic evidence of the severe and long-term impact ozone exposure has on respiratory health:
• College freshmen who were raised in less polluted areas have lungs that
work better than their schoolmates who grew up in polluted cities. For example, University of California-Berkeley freshmen who have lived in places with less ozone pollution can exhale more forcefully than students from more polluted areas.27
Yale freshmen who have lived for four or more years in a county with high ozone levels can’t breathe as well as freshmen from cleaner areas.28
• Recent studies show that the lungs of asthmatic infant rhesus monkeys suffer irreversible structural damage when exposed to ozone.29 Ozone exposure
reduces the number of branches formed by nerves and airway passages in the lung and forces lung muscles to reorganize, and long recovery periods do not improve the damage. The immune system and cellular responses to ozone are like those seen with asthma. Dr. Charles Plopper of the University of California-Davis, the author of the studies, commented, “from a public health standpoint, it’s a pretty disquieting situation.”30
Researchers believe the same damage happens to human infants when exposed to air pollution.
• Striking results from the Southern California Children’s Study indicate that exposure to ozone can cause asthma in children.31 Children who
exercise frequently in smoggy areas are more than three times as likely to develop asthma as those in cleaner parts of the country.
Taken together, these studies paint a picture of profound and irreversible respi-ratory damage beginning with an infant’s first breath of ozone-tainted air, leading to impaired lung development and chronic respiratory disease.
The Dangers of Pollution from Traffic
C
ars and trucks directly emit dangerous pollutants near roadways, in addition to contributing to soot and smog in ambient air. Fuel combustion produces pollutants like nitrogen oxides, small particles, benzene, formaldehyde, and 1,3-butadiene. In sufficient amounts, these pollutants irritate airways and lungs, cause asthma, worsen asthma symptoms, and cause leukemia and other types of cancers.32Exhaust from highways and major roads poses a serious health hazard for anyone who lives, works or goes to school in or near heavy traffic. Scientific studies have shown that automobile exhaust causes serious illnesses and increases the risk of death.
Children directly exposed to traffic pollution develop respiratory problems.
• Researchers in Europe found that children who live or go to school close to busy highways and roads are more likely to suffer from cough, wheezing, and runny nose. Significantly, these children are also more likely to suffer from asthma.33
• Researchers in southern California found that children living closer to a highway are more likely to have asthma, more likely to wheeze and more likely to use asthma medication.34
• The damage begins at birth: studies have found that infants exposed to traffic-related air pollution during their first year of life are more likely to suffer from coughs, which could later translate into chronic respiratory problems.35
Air pollution from traffic causes damage that increases the risk of death.
• People living near highways or highly traveled roads face an increased risk of death from stroke, lung disease and heart disease.36
Many people assume that being inside a car offers some protection from exhaust—but pollution levels in cars are higher than in the air outdoors, especially in congested traffic.
• On congested roadways, levels of dangerous pollutants inside vehicles can be up to 10 times higher than in general city air.37
• U.S. EPA researchers studied a group of North Carolina highway patrol troopers who regularly work on the road. After breathing elevated levels of particulates while on duty, the troopers’ heart rhythms and blood chemistry changed in ways associated with increased risk of heart attack.38
In order to improve public health, state leaders must implement policies to reduce pollution directly emitted from vehicles on busy roadways.
Health Damage Caused by Air Pollution 15
H
ealth researchers have madesignifi-cant progress in mapping out the consequences of breathing polluted air, and the results aren’t pretty. The most serious impacts include premature death from diseases like cancer and heart disease, respiratory deaths in infants, and new cases of persistent diseases like chronic bronchi-tis and asthma.
However, these impacts are just the most visible indicators of widespread health dam-age that affects everyone in the state. Air pollution also causes increased emergency room visits, more frequent asthma attacks, and missed work days due to respiratory illness in otherwise healthy people. At the root of all of these problems, air pollution irreparably damages lung tissues in ways similar to second-hand tobacco smoke.
In this report, we quantify the health impacts of air pollution in North Carolina. Our estimates stem from three basic sources of information:
• The exposure of people to air pollutants,
• Scientific studies documenting how the risk of a relevant health impact changes with increasing air pollution levels, and
Health Damage Caused by
Air Pollution in North Carolina
• The number of deaths, hospital admissions, and other relevant events in North Carolina in 2003.
Air pollution monitors placed through-out North Carolina by the Department of Environment and Natural Resources help provide the first piece of information. A vast body of scientific literature in which re-searchers tracked pollution and health ef-fects provides the second piece of information. And the third comes from health statistics maintained by the North Carolina State Center for Health Statistics and the U.S. Agency for Healthcare Re-search and Quality, estimates by the U.S. Environmental Protection Agency, and additional information from government surveys.
Using this information, we estimate that every year in North Carolina, thousands die prematurely because of soot in the air, thou-sands are admitted to area hospitals with air-pollution aggravated heart and lung dis-ease, and hundreds of thousands miss work because of air-pollution induced respiratory illness (see Table 1).
Additionally, during the summer smog season, we estimate that smog causes chronic asthma in thousands of North
Carolina adults, more than one hundred thousand asthma attacks and millions of days of increased respiratory symptoms like shortness of breath (see Table 2).
Premature Death
The most serious health impact of expo-sure to air pollution is premature death. Fine particulates are tied to deaths from respiratory disease, heart disease, lung can-cer, and other types of diseases commonly associated with smoking.
The Evidence
Several decade-long studies have made it quite clear that long-term exposure to pol-lution shortens lives:
Table 1: Public Health Damage from Soot in North Carolina (PM10)
Health Effect Estimated Cases Range
Premature Death (Adults) 3,000 2,000 – 4,600
Respiratory Hospital Admissions 2,000 1,700 – 2,600
Cardiovascular Hospital Admissions 2,000 900 – 2,500
New Cases of Chronic Bronchitis 2,500 260 – 4,400
Asthma Attacks 200,000 100,000 – 390,000
Missed Work Days 500,000 440,000 – 520,000
Restricted Activity Days 5 million 4.1 million – 5.5 million
Increased Symptom Days 15 million 7 million – 23 million
Table 2: Public Health Damage from Smog in North Carolina (Ground-level Ozone0)
Health Effect Estimated Cases Range
Adult Onset Asthma (Males, 25+) 1,500 900 –1,900
Respiratory Hospital Admissions 4,000 3,000 – 5,000
Asthma Attacks 200,000 100,000 – 300,000
Restricted Activity Days 1 million 800,000 – 1.4 million
Increased Symptom Days 4 million 2 million – 6 million
• In 2002, Dr. C. Arden Pope at Brigham Young University and his colleagues published a study tracking more than 500,000 people in 51 metropolitan areas in America for longer than 16 years. He found that when fine particulate levels increased by 10 micrograms per cubic meter, deaths from all causes rose by 4 percent; deaths from cardiopulmonary illness by 6 percent, and deaths from lung cancer by 8 percent.40 Dr. Pope
saw no evidence for a safe level of particulate pollution not tied to increased death rates. Pope estimated that chronic exposure to air pollution in the most polluted cities shortens life expectancy between 1.8 and 3.1 years.41 He concluded that breathing
Health Damage Caused by Air Pollution 17
How We Estimated the Health Effects of Air Pollution
I
n the 1990 amendments to the Clean Air Act, Congress required the EPA to report on the benefits and costs of Clean Air Act regulations. In November 1999, the EPA released a report outlining the health and economic impact of clean air efforts. In addition, scientists with the World Health Organization produced a re-port in 2000 estimating the public health impact of particulate air pollution from motor vehicles.39Environment North Carolina Research & Policy Center adapted the methodol-ogy developed by these experts to estimate the health effects of air pollution in North Carolina.
First, we gathered statistics on how many deaths, hospital admissions and other relevant events happened in the state in 2003. Next, we estimated how much air pollution (above natural background levels) people are exposed to by looking at data from soot and smog monitors placed throughout the state. Finally, we ob-tained estimates of how much the risk of health problems increases with exposure to a specific amount of air pollution. Combining these three pieces of information allowed us to estimate what fraction of deaths and other relevant health problems could be attributed to air pollution.
We report the effects of air pollution including a range of values to emphasize that the estimates have an inherent level of uncertainty. Reported ranges represent the 95 percent confidence interval derived by scientists for the relationship be-tween air pollution and the frequency of health outcomes, or where the estimate would be expected to lie 95 times out of 100 observations. The range of values presented here is our best estimate of the public health toll of air pollution in North Carolina. For more specific details on how the estimates were made and a discus-sion of factors that could make the actual impacts higher or lower, see the Method-ology section.
in the Eastern U.S. causes an increased risk of lung cancer similar to that of breathing secondhand smoke.42
• Researchers with the World Health Organization in Europe found that air pollution caused 6 percent of all deaths in Switzerland, France and Austria (40,000 per year). Motor vehicle pollution caused about half of these deaths.43
Dozens of studies also link short-term exposure to pollution to acute increases in the death rate:
• In a study of heart attack patients in Boston, Dr. Annette Peters and her colleagues at the Harvard University School of Public Health found that as pollution levels rose, so did the fre-quency of heart attacks a few hours to a day later.44 An increase in fine
particles of 25 micrograms per cubic meter resulted in a 69 percent increase in the relative risk of having a heart attack over the following day. • Dr. Jonathan Samet from Johns
Hopkins University’s Bloomberg School of Public Health and his
colleagues studied health and air pollution data from 90 cities in the U.S. and found a link between daily pollution levels and daily death rates from chronic heart and lung disease. The link was strongest in the North-east, the industrial Midwest, and in Southern California.45
• Dr. Kazuhiko Ito and his colleagues at New York University found that increases in ozone levels lead to a higher risk of death. As daily 1-hour maximum ozone concentrations in seven U.S. cities rose by 10 parts per billion, risk of death rose by 0.4 percent.46
Pollution associated with burning fossil fuels is specifically tied to increased mor-tality, as opposed to particles from dust-storms and other natural events.47 Other
studies show that these effects are not merely accelerating the death of elderly and infirm adults already on the brink of death, but also kill some infants and adults who otherwise would have many years of health remaining.48
North Carolina Estimate
We estimate that soot pollution causes about 3,000 deaths each year, or 3 to 7 per-cent of all deaths not caused by injuries or accidents. This estimate is comparable to the World Health Organization study of air pollution impacts, which reported that 6 percent of all mortality in Switzerland, France and Austria is linked to air pollution.49
This finding ranks air pollution as the third leading cause of mortality in North Carolina, behind smoking and poor diet/ physical inactivity. In 2004, researchers published estimates for the leading causes of death in the U.S. as a whole.50
Ac-cording to these estimates, smoking causes 18 percent of all deaths, poor diet and physical inactivity causes 15.2 percent of all deaths and alcohol consumption leads to 3.5 percent of all deaths. Air pollution in
North Carolina—causing roughly 4.5 percent of all deaths—ranks just above al-cohol consumption as a risk factor in premature mortality.
Table 3: Yearly Premature Deaths Caused by Air Pollution in North Carolina
Health Estimated Range Effect Cases
Premature
Death 3,000 2,000 – 4,600
(Adults)
Hospital Stays and
Emergency Room Visits
As levels of air pollution increase, so do the number of people admitted into hospital wards or emergency departments suffering from severe respiratory and cardiovascular disease.
The Evidence
• Dr. Jonathan Samet from Johns Hopkins University’s Bloomberg School of Public Health and his colleagues found that increases in daily pollution levels were linked to in-creased hospital admissions for cardio-vascular disease, pneumonia, and chronic obstructive pulmonary disor-der.57
• Dr. Joel Schwartz of Harvard Univer-sity and his colleagues documented links between ozone and hospitaliza-tion rates for cardiovascular and respiratory disease in Birmingham, Detroit, Minneapolis-St. Paul, and Tucson.58 An increase of soot levels by
100 micrograms per cubic meter and ozone by 50 parts per billion increased the risk of hospitalization for chronic
Health Damage Caused by Air Pollution 19 respiratory disease in the range of
20 percent to 100 percent.
• Dr. George Thurston at the New York University School of Medicine and Dr. Richard Burnett at Environment Canada have repeatedly linked respira-tory and cardiovascular hospital admissions with the levels of summer-time haze air pollution.59 According to
these studies, summertime haze pollution was responsible for 24 percent of respiratory hospital admis-sions in Toronto, and up to half of admissions on particularly bad air days. • Dr. Paul Lioy and his colleagues at the
Rutgers Environmental and Occupa-tional Health Sciences Institute and UMDNJ—Robert Wood Johnson Medical School saw increases in the number of asthma emergency room visits in central and northern New Jersey on high-smog summer days.60
Emergency room visits occurred 28 percent more frequently when the
average ozone levels were greater than 60 ppb than when they were lower than this level. This study demon-strates health effects of ozone exposure at levels well below the EPA health standard of 80 ppb over an 8 hour period.
• Dr. Joel Schwartz from Harvard University and his colleagues at the U.S. EPA found that as fine soot levels increased in the Seattle area, so did emergency room visits for asthma.61
An increase in fine soot levels of 30 micrograms per cubic meter increased the relative risk of needing emergency medical attention for asthma by 12 percent. The daily fine soot levels never exceeded 70 percent of the EPA health standard at the time.
• Dr. Jennifer Peel and her colleagues at Emory University looked at air pollution levels and emergency room visits at 31 hospitals in Atlanta from 1993 to 2000—a statistically powerful
Global Warming and Public Health
S
oot and smog are not the only pollutants in North Carolina’s air. Global warm-ing pollution also has serious consequences for the health and well bewarm-ing of all North Carolinians.Scientists project that global warming could raise average temperatures in North Carolina by 1° F to 5° F over the next century.51 Coupled with a projected increase
in precipitation, the heat index in the Southeast could climb by 8 to 15° F.52 Among
a host of negative impacts—from coastal flooding to ecosystem disruption—such a temperature increase would increase air pollution and harm public health.53
Scientific evidence shows that as temperatures grow hotter in the summer, so does the risk of death. For example, scientists tracking hospitalization of patients for cardiovascular diseases in Denver in the summer months of 1993 to 1997 found that higher temperatures increased the number of elderly people suffering from heart attacks and congestive heart failure.54 In the summer of 2005 a severe heat
wave passed through France, killing an estimated 15,000 people.55
The U.S. Environmental Protection Agency estimates that an increase of 3° F in the average summer temperature in a city like Greensboro would cause heat-re-lated deaths to increase by nearly 70 percent.56
sample comprised of more than 4 million patients. She found that increased levels of soot and smog pollution led to increased emergency room visits for upper respiratory infections, pneumonia and other respiratory conditions.62
North Carolina Estimate
We estimate that soot pollution causes 2,000 respiratory and 2,000 cardiovascular hospital admissions each year, and smog causes 4,000 respiratory hospital admissions during the summer smog season. This rep-resents between 5 and 8 percent of respira-tory hospital admissions in 2003, and between 0.5 and 1.5 percent of cardiovas-cular hospital admissions.
New Cases of Chronic
Disease—Asthma and
Bronchitis
Air pollution can cause chronic diseases in addition to triggering short-term health damage. From new cases of chronic asthma in otherwise healthy children and adults to
the development of chronic bronchitis in elderly people, these are severe diseases that cause significant distress for hundreds of thousands of North Carolina residents.
The Evidence
• Dr. Rob McConnell at the University of Southern California School of Medicine and his colleagues found that children who exercise a lot develop asthma at higher rates in more pol-luted areas. The researchers followed for five years more than 3,500 children from the fourth, seventh, and tenth grades with no history of asthma. During that time, 265 became asth-matic. Children who played three or more sports in communities with high smog levels developed asthma at over three times the rate of children in low-smog communities. Children who spent relatively high amounts of time outdoors were 1.4 times more likely to get asthma in polluted areas compared to cleaner ones.63 The levels of air
pollution in all of the communities examined were well below the U.S. EPA health standard of 80 ppb over an eight hour period.
Table 4: Annual Hospital Admissions Caused by Air Pollution in North Carolina
Health Effect Estimated Cases Range
Respiratory Hospital Admissions (Soot) 2,000 1,700 – 2,600 Cardiovascular Hospital Admissions (Soot) 2,000 900 – 2,500 Respiratory Hospital Admissions (Ozone) 4,000 3,000 – 5,000
Table 5: New Cases of Chronic Respiratory Disease Caused by Air Pollution in North Carolina Annually
Health Effect Estimated Cases Range
New Cases of Chronic Bronchitis (Soot) 2,500 260 – 4,400
Health Damage Caused by Air Pollution 21 • In a follow up study, Dr. McConnell
and his colleagues found that children living closer to a major highway were more likely to have asthma, pointing to traffic-related pollution as a likely cause of asthma.64
• Dr. William McDonnell at the U.S. EPA National Health and Environ-mental Effects Research Laboratory and his colleagues found a connection between long-term exposure to smog and development of asthma in adults. The researchers followed more than 3,000 non-smoking adults for 15 years in California. During this period, just over 3 percent of the men and just over 4 percent of the women reported a diagnosis of asthma. Several factors increased the risk of developing asthma, including: history of exposure to tobacco smoke, childhood pneumo-nia or bronchitis; and exposure to ozone in men.65
• In Taiwan, researchers linked develop-ment of asthma with several individual air pollutants: fine soot, sulfur dioxide, nitrogen dioxide, and carbon monox-ide. The scientists surveyed more than 160,000 schoolchildren and looked at levels of air pollutants, finding that air pollution increased asthma prevalence by as much as 29 percent, independent of exposure to second-hand tobacco smoke.66 Similar research in Hong
Kong showed that children living in areas with higher air pollution had higher levels of asthma and less healthy lungs.67
• Dr. Joel Schwartz and others identified links between particulate levels and physician diagnoses of chronic bron-chitis by looking at health records and air pollution levels in 53 U.S. metro-politan areas.68 For every 10
micro-gram per cubic meter increase in total particulates, the relative risk for chronic bronchitis rose about 7 percent.
Asthma prevalence is increasing in the U.S. and worldwide, for unknown reasons. In the U.S., the Centers for Disease Con-trol and Prevention (CDC) estimates that prevalence among persons up to 17 years old increased about 5 percent per year from 1980 to 1995.69 Deaths due to asthma have
doubled, and now amount to 5,000 per year.70 The trend in the number of
chil-dren with active asthma in North Carolina also has been increasing over the past few decades, to the point where just under one in 10 children are affected.71 According to
a survey carried out by the CDC in 2003, 7.1 percent of North Carolina adults have been diagnosed with asthma.72
North Carolina Estimate
We estimate that air pollution causes 2,500 new cases of chronic bronchitis and 1,500 cases of adult onset asthma among North Carolina residents every year.73 The
con-tribution of air pollution may be much higher when pediatric asthma is considered.74
Asthma Attacks
When pollution levels rise, so do the fre-quency of asthma attacks suffered by asth-matic children and adults.
The Evidence
• Dr. George Thurston and his col-leagues at the New York University School of Medicine documented increased asthma attacks, respiratory difficulty, and reduced lung function in children on high pollution days.75 The
researchers tracked children attending the American Lung Association’s Connecticut “Asthma Camp” during summer months. On the highest pollution days, the risk of asthma attacks requiring medication and chest tightness climbed 40 percent higher than usual.
• In the mid 1970s, the Environmental Protection Agency collected asthma attack diaries from Los Angeles residents. Asthma attacks were reported more frequently when smog and soot levels were high, as well as when the weather was cool.76
North Carolina Estimate
We estimate that soot pollution causes 200,000 asthma attacks and smog pollution causes another 200,000 asthma attacks among North Carolina asthmatics every year.
Missed Work Days
and Sick Days
Air pollution can also affect the health of people with no chronic respiratory illness. On high pollution days, the number of people feeling ill with symptoms like short-ness of breath, runny or stuffy noses, coughs, burning eyes, wheezing, and chest pain increases dramatically. These symp-toms can cause people to miss work or school, or force them to limit their usual activity levels.
The Evidence
• Dr. Bart Ostro at the California EPA linked high air pollution levels with missed work days and illness days reported in the Health Interview Survey collected yearly by the U.S. Centers for Disease Control and Prevention.77
• Dr. Joel Schwartz of Harvard and his colleagues found that elementary school children in six U.S. cities suffered from coughs and other lower respira-tory symptoms more often on days when soot and smog levels were high.78
North Carolina Estimate
We estimate that soot pollution causes 500,000 missed work days, 5 million per-son-days when illness limits normal activ-ity levels, and 15 million person-days with the presence of respiratory symptoms such as shortness of breath, runny or stuffy noses, coughs, burning eyes, wheezing, or chest pain. In addition, we estimate that smog causes 1 million person-days when air pol-lution limits normal activity and 4 million person-days with respiratory symptoms.
Table 6: Annual Asthma Attacks Triggered by Air Pollution in North Carolina
Health Effect Estimated Cases Range
Asthma Attacks (Soot) 200,000 100,000 – 390,000
Asthma Attacks (Ozone) 200,000 100,000 – 300,000
Table 7: Annual Missed Work Days and Increased Respiratory Symptom Days Caused by Air Pollution in North Carolina
Health Effect Estimated Cases Range
Missed Work Days (Soot) 500,000 440,000 – 520,000
Restricted Activity Days (Soot) 5 million 4.1 million – 5.5 million Increased Symptom Days (Soot) 15 million 7 million – 23 million Restricted Activity Days (Smog) 1 million 800,000 – 1.4 million Increased Symptom Days (Smog) 4 million 2 million – 6 million
Air Pollution and North Carolina’s Children 23
C
hildren are especially vulnerable tothe effects of air pollution.79 First,
children are developing into adults. Their lungs are growing. Injuries sustained during this time can cause permanent dam-age that will have life-long effects. Second, children breathe more air per pound of body weight and thus inhale larger doses of pollutants than adults.
Children in North Carolina are con-stantly exposed to air pollution, breathing it day in and day out. Recent science has shown that this exposure causes a range of lung injuries, even among otherwise healthy infants and children. Children ex-posed to air pollution can’t breathe as well as children growing up in cleaner areas. Their lungs are scarred and less flexible than they should be, their lungs hold less
air, and they aren’t as able to breathe nor-mally. These injuries manifest themselves in respiratory illness, missed school days, increased doctor visits, hospitalizations, and for a small group, death.80
Environment North Carolina Research & Policy Center compiled air pollution data, scientific reports about how air pol-lution levels affect children’s health, and baseline health statistics maintained by the state Center for Health Statistics and the EPA. We used this information to estimate the health impacts of pollution on children in North Carolina. (For more details, see the Methodology section.)
We estimate that air pollution kills sev-eral dozen infants a year and causes more than one thousand emergency room visits for childhood asthma, tens of thousands of
Air Pollution and
North Carolina’s Children
Table 8: Air Pollution Damage to Children’s Health in North Carolina
Health Effect Estimated Cases Range
Infant Deaths 50 30 – 60
Asthma ER Visits 1,500 200 – 3,500
Acute Bronchitis 20,000 13,000 – 33,000
Asthma Attacks 100,000 90,000 – 120,000
cases of acute bronchitis, close to one hun-dred thousand asthma attacks and hunhun-dreds of thousands of missed school days. (See Table 8.)
Infant Death
Air pollution not only kills elderly and sick people. It also causes premature death in infants and young children. Experiments have tied particulate levels to deaths from both respiratory disease and sudden infant death syndrome.
The Evidence
• Dr. Tracey Woodruff at the U.S. EPA and her colleagues linked fine soot pollution levels and neonatal deaths in 86 U.S. metropolitan areas.81
Normal-weight infants less than one year old born in high soot areas were 40 percent more likely to die of respira-tory disease, and 26 percent more likely to die from sudden infant death syndrome than infants born in low soot areas.
• Researchers in the Czech Republic found that newborn deaths due to respiratory causes were linked to increased levels of fine soot, sulfur dioxide, and oxides of nitrogen.82 The
study concluded, “the effects of air pollution on infant mortality are specific for respiratory causes in [the period between one month and one year of age], are independent of socioeconomic factors, and are not mediated by birth weight or gesta-tional age.”
• The National Bureau of Economic Research found that as levels of particles fell during a recession in the early 1980s, so did rates of death in newborn children younger than 28 days old. Specifically in Pennsylvania, researchers found that when total fine particulate levels dropped 25 percent, newborn death rates from cardiopul-monary and respiratory causes fell 14 percent.83
North Carolina Estimate
We estimate that soot pollution causes 50 infant deaths in North Carolina each year, or 4 to 7 percent of all infant deaths.
Hospitalization and
Emergency Room Trips
As air pollution levels rise, children end up in the emergency room with respira-tory problems at higher rates. Some of them require hospitalization for longer-term care.
The Evidence
• Dr. Michael Friedman of the U.S. Centers for Disease Control and Prevention and his colleagues found that reduced traffic levels and higher public transit use during the 1996 Summer Olympics in Atlanta signifi-cantly reduced smog levels and also emergency room visits for childhood asthma.84 One-hour peak ozone levels
decreased by 27 percent, while the number of children visiting the
Table 9: Yearly Infant Deaths from Air Pollution in North Carolina
Health Effect Estimated Cases Range
Air Pollution and North Carolina’s Children 25 emergency room for asthma fell 41.6
percent in a Medicaid database, 44.1 percent in an HMO database, and 11.1 percent in two major pediatric emergency departments. In other words, every 10 ppb decrease in smog levels reduced the relative risk of children needing emergency medical
Reducing Air Pollution Protects Children’s Health:
The Case of the 1996 Olympics in Atlanta
T
he 1996 Summer Olympic Games in Atlanta offered researchers a unique oppor-tunity to observe the connection between lowered pollution levels and improved health.85Atlanta implemented a comprehensive transit plan as a part of the Olympic Games. The plan was designed to reduce congestion in the downtown area and reduce travel delays. Atlanta launched an expanded 24-hour-a-day public transportation network, added 1,000 buses for park-and-ride service, encouraged local employers to institute alternative work hours and telecommuting, and closed the downtown area to private vehicles.
The transit plan produced impressive results, despite the million or so additional visitors to the city. Weekday morning traffic trips declined by 22.7 percent and pub-lic transportation ridership increased by 217 percent.
The plan produced some unintended benefits for air quality and health that were equally impressive. The average daily maximum ozone levels decreased by 28 per-cent, from 81 ppb before and after the Olympics to 59 ppb during the Olympics. Presumably, this effect resulted from the decreased levels of traffic-related air pollu-tion building up in the morning rush hour. Nearby cities did not experience similar reductions in ozone pollution.
At the same time, asthma-related emergency room visits for children decreased by 41.6 percent in a Medicaid database, 44.1 percent in an HMO database, and 11.1 percent in two major pediatric emergency departments. Additionally, hospitaliza-tions for asthma decreased by 19.1 percent. Unfortunately, Atlanta discontinued the transit program at the conclusion of the Olympics, and pollution levels and emer-gency room visit rates returned to normal.
This experience powerfully demonstrates how reducing pollution levels would benefit the health of children. It also highlights the role that motor vehicles play in creating high levels of urban pollution and how better public transit can quickly reduce air pollution levels.
Dr. Michael Friedman of the U.S. Centers for Disease Control and Prevention, one of the authors of the study, said that the results “provide evidence that decreas-ing automobile use can reduce the burden of asthma in our cities and that citywide efforts to reduce rush-hour automobile traffic through the use of public transporta-tion and altered work schedules is possible in America.”86
attention for asthma by roughly 8 percent.
North Carolina Estimate
We estimate that air pollution causes 1,500 asthma emergency room visits among North Carolina children each year.
Asthma Attacks,
Acute Bronchitis and
Missed School Days
Air pollution triggers asthma attacks and increases cases of acute bronchitis in chil-dren. Asthma is the leading chronic illness in children and the number one cause of missed school days in the United States.87
The Centers for Disease Control and Pre-vention estimates that asthma prevalence among persons up to 17 years old in-creased about 5 percent per year from 1980 to 1995.88 Air pollution worsens the impact
of this disease, causes other acute respira-tory illnesses, and increases school absence rates.
The Evidence
• Dr. Janneane Gent at the Yale Univer-sity School of Medicine and her colleagues recently published a study showing that children with asthma are vulnerable to air pollution well below EPA health standards.89 According to
the study, every 50 ppb ozone increase yields a 35 percent increased likelihood of wheezing, and a 47 percent in-creased likelihood of chest tightness. A follow-up study showed that infants, particularly those with asthmatic mothers, suffer from increased
Table 10: Yearly Pediatric Respiratory ER Visits Caused by Air Pollution in North Carolina
Health Effect Estimated Cases Range
Asthma ER Visits 1,500 200 – 3,500
wheezing and difficulty breathing on days with high ozone levels.90
• Dr. Douglas Dockery at Harvard University and his colleagues showed that children living in areas with high levels of acidic particle pollution were 66 percent more likely to have had an episode of bronchitis in the last year than children in low pollution areas.91
• Researchers participating in the Southern California Children’s Health Study found that increased smog pollution causes more children to stay home from school.92 When ozone
levels rose by 20 ppb, illness-related absence rates went up by 63 percent, and by 174 percent for lower respira-tory illnesses with wet cough.
• Researchers in Korea found the same relationship between air pollution and school absences.93 When air pollution
levels rose, so did illness-related absences. When pollution levels fell, more children came in to school.
North Carolina Estimate
We estimate that air pollution causes 20,000 cases of acute bronchitis and 100,000 asthma attacks among North Carolina chil-dren each year. Additionally, air pollution causes in the range of 300,000 missed school days each year.
Table 11: Asthma Attacks and Acute Bronchitis Caused by Air Pollution in N.C Health Effect Estimated Cases Range
Acute Bronchitis 20,000 13,000 – 33,000
Asthma Attacks 100,000 90,000 – 120,000
Clean Air Policy Recommendations 27
Clean Air Policy Recommendations
S
olutions to North Carolina’s air qual-ity problems are readily available. Strategies already in widespread use— from modern emission controls for cars and power plants to efficient transit systems— can cut air pollution and help people to live healthy lives.Aggressive action will be required on both the state and regional level to reduce air pollution and reduce the costs society pays for the use of polluting fuels. In order to have the greatest impact, action should focus first on the largest sources of pollution.
Sources of Dirty Air
In North Carolina, mobile sources like cars, trucks, buses, and off-road equipment are the largest source of air pollution—espe-cially in urban areas. Additional pollutants come from power plants, industrial facili-ties, and chemical use. Pollution sources in neighboring states are also a significant part of the problem.
Within the state in 1999, almost half of smog-forming emissions (oxides of nitro-gen and volatile organic compounds) came from on-road and off-road mobile sources
like cars, trucks, and construction equip-ment. (See Table 12.) Mobile sources di-rectly released just under half of all particulate matter under 10 micrometers in diameter. Traffic is an area of particular importance, since pollutants are emitted at ground level and in close proximity to ar-eas where people live.
In 1999, electricity generation was sponsible for 80 percent of the state’s re-leases of sulfur dioxide—one of the precursors of soot particles. In 2002, North Carolina passed the Clean Smokestacks Act, a law that will significantly reduce emissions from coal-fired power plants within the state over the next decade. Ni-trogen oxide emissions from power plants will drop 77 percent by 2009 and sulfur diox-ide emissions will drop 73 percent by 2013.94
With the passage of this law, mobile sources are now the highest priority for reducing pollution in North Carolina.
Policies Aimed at the
Largest Pollution Sources
An effective suite of policies aimed atreducing air pollution in North Carolina would include the following:
State Level Actions:
• Strengthen auto emission standards in line with New York, Massachusetts, New Jersey, Connecticut, Rhode Island, Maine, Vermont, California, Oregon and Wash-ington. In these states, auto-makers are required to manufacture and sell vehicles that emit less pollution and incorporate advanced technologies. • Require diesel engines to be retrofitted with
particulate filtration systems and low-sulfur fuel. Diesel engines are a signifi-cant source of fine particles. New federal diesel standards will be phased in starting in 2007, reducing emissions from new highway and off-road vehicles. North Carolina can reduce emissions from older vehicles by retrofitting their emission control systems for lower pollution. State-owned vehicle fleets such as school buses and road construction equip-ment should be included, as well as off-road diesel vehicles like bulldozers. • Reduce car-dependent land use practices
and sprawl. North Carolina should ensure that future growth, develop-ment, and redevelopment focuses on creating livable, transit-oriented communities to reverse the trend of yearly increases in vehicle miles traveled that lead to greater pollution.
North Carolina should also increase the proportion of transportation funding for clean public transit to provide residents with alternatives to driving.
Federal and Regional Level Actions:
• Fully enforce the Clean Smokestacks Act, pursuing all available means to reduce pollution in neighboring states. The Clean Smokestacks Act instructs the North Carolina attorney general to use all legal means to force pollution sources in neighboring states to clean up. The state should continue to push for strong pollution controls on Tennessee Valley Authority power plants in upwind states.
• Advocate adoption of these state policies among neighboring and upwind states. Reducing air pollution emissions in North Carolina will have benefits for neighboring states. North Carolina should encourage other states, espe-cially those upwind from the state, to adopt similar air pollution control policies. Ultimately, regional coopera-tion will be required to reduce overall air pollution levels.
• Restore the New Source Review provision of the Clean Air Act and require the oldest coal-fired power plants and other indus-trial facilities in the country to install modern emissions control technology. The EPA recently enacted regulations
Table 12. Emissions of Selected Air Pollutants in 1999 by Source95
Total Mobile Area Point
(Tons) Sources Sources Sources
Oxides of Nitrogen 674,848 55% 5% 40%
Volatile Organic Compounds 635,687 39% 50% 11%
PM10 390,632 44% 49% 7%
Clean Air Policy Recommendations 29 relieving power plants and industrial
facilities grandfathered under the original Clean Air Act of responsibility to upgrade their emissions controls when upgrading their facilities. This change limits the effectiveness of the Clean Air Act and effectively subsi-dizes a few industries at the expense of public health. It should be reversed as soon as possible.
• Limit nationwide industrial emissions of sulfur dioxide, nitrogen oxides, and mercury to between 10 percent and 30 percent of 2000 levels. Placing a national cap on point-source emissions of air pollutants could dramatically reduce
the levels of pollution plaguing the eastern seaboard of the U.S., and contribute to a regional solution to the air pollution problem.
• Strengthen national emission standards for cars, trucks, and off-road vehicles. The EPA sets national emission standards for cars, trucks, and off-road vehicles. However, California has designed a more effective and ambitious mobile-source emissions control program that includes requirement for manufactur-ers to produce cleaner vehicles with modern technologies. The EPA should update its standards to match or exceed the California program.
T
o quantify the health impacts of air pol-lution, we relied on three basic pieces of information:• The exposure of people to air pollutants,
• How the risk of a given health impact changes with increasing air pollution levels, and
• The number of deaths, hospital admissions, and other relevant events in North Carolina in 2003.
Air pollution monitors placed through-out the state by the North Carolina De-partment of Environment and Natural Resources helped provide the first piece of information. A vast body of scientific lit-erature in which researchers tracked pol-lution and health effects provided the second piece of information. And the third came primarily from health statistics main-tained by the state Department of Health and Senior Services, plus additional infor-mation from estimates and surveys by gov-ernmental agencies and in the scientific literature.
We compiled this information to esti-mate the health impacts of pollution in
North Carolina, adapting methodology used by the U.S. EPA in a study on the ben-efits and costs of the Clean Air Act and the World Health Organization in a study on the health impact of vehicle pollution in Europe.96 The sections below outline the
sources of this information and how we used it to derive our results.
Air Pollution Exposure
We obtained annual mean levels of pollu-tion from the U.S. EPA AIRData online database of air pollution monitoring data for the year 2003.97 We obtained the
aver-age daily one-hour peak ozone levels re-ported during the summer smog season from April through October and annual mean particulate levels for particulates less than 2.5 micrometers in diameter (PM2.5). We translated PM2.5 data into PM10 data, because many of the scientific studies link-ing air pollution and health effects were carried out in terms of PM10, and the rela-tive risk figures obtained from the World Health Organization were listed in terms of PM10.98 Because PM
2.5 is a subset of
PM10, their concentrations are related. In accordance with assumptions made by the World Health Organization, we assumed