Accepted Manuscript
Constructing supplier learning curves to evaluate relational gain in engineering projects
Jonathan Gosling, Wessam Abouarghoub, Mohamed Naim, Brian Moone
PII: S0360-8352(18)30209-2
DOI: https://doi.org/10.1016/j.cie.2018.05.008
Reference: CAIE 5214
To appear in: Computers & Industrial Engineering
Please cite this article as: Gosling, J., Abouarghoub, W., Naim, M., Moone, B., Constructing supplier learning curves to evaluate relational gain in engineering projects, Computers & Industrial Engineering (2018), doi: https://doi.org/ 10.1016/j.cie.2018.05.008
This is a PDF file of an unedited manuscript that has been accepted for publication. As a service to our customers we are providing this early version of the manuscript. The manuscript will undergo copyediting, typesetting, and review of the resulting proof before it is published in its final form. Please note that during the production process errors may be discovered which could affect the content, and all legal disclaimers that apply to the journal pertain.
1
Constructing supplier learning curves to evaluate relational gain in
engineering projects
Constructing supplier learning curves to evaluate relational gain in
engineering projects
Jonathan Gosling ([email protected])
Logistics Systems Dynamics Group, Logistics and Operations Management Section, Cardiff University, UK
Wessam Abouarghoub ([email protected])
Logistics Systems Dynamics Group, Logistics and Operations Management Section, Cardiff University, UK
Mohamed Naim ([email protected])
Logistics Systems Dynamics Group, Logistics and Operations Management Section, Cardiff University, UK
Brian Moone ([email protected])
Mace Group, 155 Moorgate, London, EC2M 6XB, UK
Abstract
Learning curve models analyze how experience relates to performance over time, and rates vary widely across industries, organisations, and processes. Very little empirical research addresses learning curves for suppliers in engineering projects. Hence, we consider learning within strategically managed buyer-supplier relationships, focusing on the potential for ‘relational gain’ in terms of learning performance for longer term strategic suppliers (LTSP). A mixed-method approach is adopted employing 2 phases. First, empirical performance data is collected as well as contextual information regarding the managerial actions behind the learning curve. Second, the empirical data is analysed using the time constant learning curve model. Different supplier relational categories are mobilised to assess any relational gain in the rates of learning.The findings give learning parameters across different categories, showing that LTSPs outperform other less collaborative categories across a range of learning and performance dimensions. Suppliers who are not formally part of the firm’s development programme, but are requested by clients or have specialist capabilities, do not perform well at the outset of a project but accelerate rapidly along the learning curve. There is a need for project based organizations to both strategically manage long term relationships with suppliers, as well as quickly integrate new suppliers. Better performing learning curves act as benchmarks to show the relative relational gains to be achieved by investment and integration approaches.
2
Abstract
Learning curve models analyze how experience relates to performance over time, and rates vary widely across industries, organisations, and processes. Very little empirical research addresses learning curves for suppliers in engineering projects. Hence, we consider learning within strategically managed buyer-supplier relationships, focusing on the potential for ‘relational gain’ in terms of learning performance for longer term strategic suppliers (LTSP). A mixed-method approach is adopted employing 2 phases. First, empirical performance data is collected as well as contextual information regarding the managerial actions behind the learning curve. Second, the empirical data is analysed using the time constant learning curve model. Different supplier relational categories are mobilised to assess any relational gain in the rates of learning.The findings give learning parameters across different categories, showing that LTSPs outperform other less collaborative categories across a range of learning and performance dimensions. Suppliers who are not formally part of the firm’s development programme, but are requested by clients or have specialist capabilities, do not perform well at the outset of a project but accelerate rapidly along the learning curve. There is a need for project-based organizations to both strategically manage long term relationships with suppliers, as well as quickly integrate new suppliers. Better performing learning curves act as benchmarks to show the relative relational gains to be achieved by investment and integration approaches.
1. Introduction
Intuitively, it is well understood that performance should improve with practice. Learning in most situations is synonymous with productivity improvements of some sort, which might be a result of new ways of working, technology or people. However, the rate and adoption of such learning is not always known. Hence, various parameter estimation algorithms may be applied (Towill, 1990). Such resultant ‘learning curves’ can be considered and utilized in a wide range of production and managerial situations (Towill, 1985). However, learning rates vary widely across industries, organisations, products and organisational units (Jaber, 2011). Typically, learning curves have been used to assess operational performance on a task. For example, Wright’s (1936) early empirical study highlighted that every time total production doubled, the required labour time typically decreased by 10 to 15 percent. They have also been used to estimate learning parameters in Advanced Manufacturing Technology setup and control (Towill & Cherrington, 2013), and it is now possible to see many books and papers on the learning organization and organisational learning curves (Adler & Clark, 1991; Garvin, 1993; Lapré et al., 2000; Senge, 1990).
However, a number of areas of learning curve theory and application remain are not well understood or are sparse within the literature. Firstly, there is a general lack of published research of using empirical data to validate learning curves (Hamade et al., 2009). Second, within the context of supply chains, learning curves are not well understood (Bessant et al., 2003; Towill et al., 2000). Jaber (2011) further notes that while modelling of supply chain learning effects have much potential to direct managerial action, there are very few quantitative studies that investigate learning in a supply chain context. Third, although learning curves are crucial to good project management, standard tools and techniques in this domain rarely consider learning. This is an important and challenging context for learning, since learning effects need to be incorporated into planning models (Plaza et al., 2011). We consider supply chain learning within the context of strategically managed buyer-supplier relationships (Carr & Pearson, 1999). Buying organisations have the option to rationalise the supply base and develop long term strategic relationships with key suppliers, or to switch between multiple sourcing arrangements within a broader supply base, or to seek out new suppliers (Gosling et al.,
3
2010). Many studies have reported the benefits of the former option (i.e. long term partners), including financial performance (Carr & Pearson, 1999), consistency across Key Performance Indicators (Gosling, Naim, et al., 2015) value and learning (Cheung et al., 2010) and simplified processes (Childerhouse & Towill, 2003). If all goes well, parties in the relationship combine to create synergies that would otherwise not be achieved, which could include new routines and ways of working, joint innovation, and new value, learning and knowledge (Cheung et al., 2010; Dwyer et al., 1987; Dyer & Singh, 1998), but this involves commitment, relationship specific adaptations, time, resources, patience and risks for each of the parties (Kalwani & Narayandas, 1995; Vanpoucke et al., 2014).
To support the relationship building agenda, a great deal of attention has been paid to supplier development concepts (Humphreys et al., 2004; Krause et al., 2000; Modi & Mabert, 2007). Such work considers the impact and antecedents of supplier development initiatives, particularly those that are resource intensive, such as direct investment. In reality, it is likely that buying firms configure their development initiatives and investments around particular relationship types (Gosling, Naim, et al., 2015; Masella & Rangone, 2000). This portfolio approach suggests that buying firms may tailor and balance their improvement efforts according to different relational categorisations, so that certain suppliers, usually termed strategic partners, receive more attention and investment than other forms of supplier relationship (Gosling, Naim, et al., 2015; Spekman, 1988). In the present paper we consider the potential ‘relational gain’ of such strategic initiatives on learning performance.
The study is set within the construction engineering sector, where there have been a good number of major initiatives to stimulate supply chain management practices and learning. This means adapting relevant best practices to this challenging setting, and capturing the lessons learnt from project to project. However, learning and adoption across the industry remains an issue (O'Brian et al., 2009; Tennant & Fernie, 2013) and project firms often suffer from neglecting the underlying learning processes and mechanisms for inter-project learning (Prencipe & Tell, 2001). Gann and Salter (2000) argue that a key to managing innovation in such project based forms of enterprise are effective linkages between learning undertaken at project level and ongoing ‘central’ business processes. This poses significant challenges for developing strategically managed buyer-supplier relationships. Firstly, if suppliers only work on one off projects with many different types, it is very difficult for relational learning between stable supply chain partners to take place. Secondly, even if suppliers do work on multiple projects with the same client, there must be effective linkages between project learning and central business processes.
Bringing together the aforementioned threads of literature, we are particularly interested in the investments in a relationship through supplier development initiatives and the resulting impact on learning in project-based firms. Based on the literature, we define a ‘relational gain’ in terms of learning performance between longer term strategic suppliers over shorter term transactional relationships. This is based on learning accrued through both experience and deliberate managerial efforts through supplier development initiatives. Hence, the aim of this paper is to determine the relational gain of supplier development initiatives on the learning performance of suppliers during the lifetime of a project.
2. Literature Review
2.1 Learning Curve Modelling
A learning curve can be defined as a mathematical description of performance in repetitive tasks (Anzanello & Fogliatto, 2011; Jaber, 2011). Typically, this shows that performance improves with experience, but at a decreasing rate. The wide range of applications of learning curves, such as increasing production capacity (Pedersen & Slepniov, 2016), collaborative forecasting (Yao et al., 2013) and last-mile logistics (Kull et al., 2007) has yielded a wide range of models to enable a mathematical representation of the learning process (Anzanello & Fogliatto, 2011). The seminal review by Yelle (1979) was a key milestone in bringing together research on learning curves, and
4
showing the importance of parameter estimation. While many of the models use constant parameters, non-linear effect have been explored by various authors, such as Epple et al. (1991) who determine the impact of time-varying varying shift-patterns on learning parameters in the form of Heaviside functions, while there is a body of research that explores neural network approaches and Kalman filters, for example, see Wan and Van Der Merwe (2000), with their specific application to machine learning.
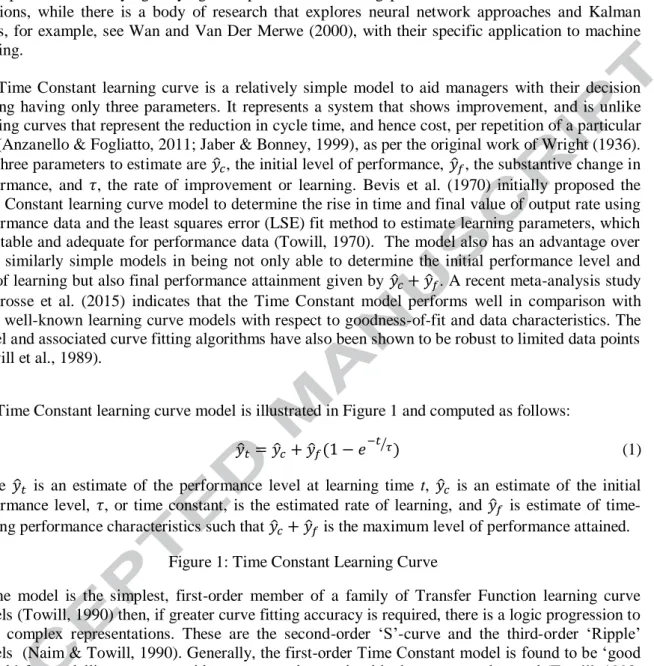
The Time Constant learning curve is a relatively simple model to aid managers with their decision making having only three parameters. It represents a system that shows improvement, and is unlike learning curves that represent the reduction in cycle time, and hence cost, per repetition of a particular task (Anzanello & Fogliatto, 2011; Jaber & Bonney, 1999), as per the original work of Wright (1936). The three parameters to estimate are , the initial level of performance, , the substantive change in performance, and , the rate of improvement or learning. Bevis et al. (1970) initially proposed the Time Constant learning curve model to determine the rise in time and final value of output rate using performance data and the least squares error (LSE) fit method to estimate learning parameters, which is suitable and adequate for performance data (Towill, 1970). The model also has an advantage over other similarly simple models in being not only able to determine the initial performance level and rate of learning but also final performance attainment given by . A recent meta-analysis study by Grosse et al. (2015) indicates that the Time Constant model performs well in comparison with other well-known learning curve models with respect to goodness-of-fit and data characteristics. The model and associated curve fitting algorithms have also been shown to be robust to limited data points (Towill et al., 1989).
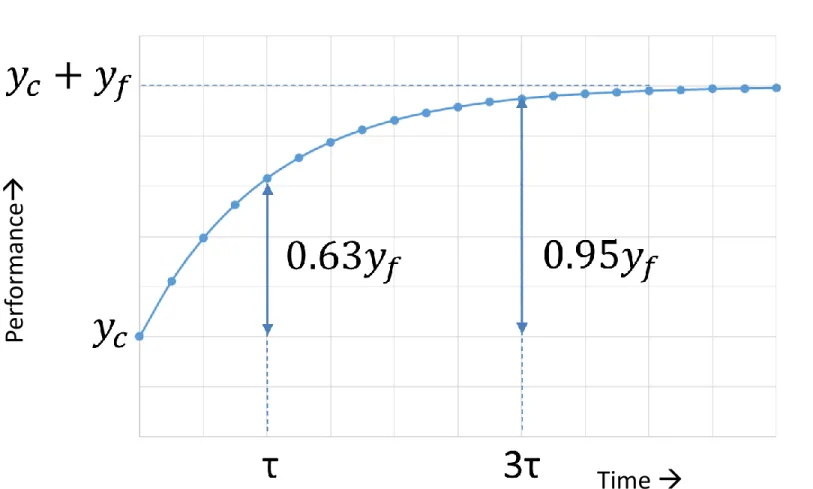
The Time Constant learning curve model is illustrated in Figure 1 and computed as follows:
(1) where is an estimate of the performance level at learning time t, is an estimate of the initial performance level, , or time constant, is the estimated rate of learning, and is estimate of time-varying performance characteristics such that is the maximum level of performance attained.
Figure 1: Time Constant Learning Curve
As the model is the simplest, first-order member of a family of Transfer Function learning curve models (Towill, 1990) then, if greater curve fitting accuracy is required, there is a logic progression to more complex representations. These are the second-order ‘S’-curve and the third-order ‘Ripple’ models (Naim & Towill, 1990). Generally, the first-order Time Constant model is found to be ‘good enough’ for modelling purposes with parameters that are intuitively easy to understand (Towill, 1990; Towill & Cherrington, 1993). Given the exploratory nature of our research in a novel inter-organisational context, we restrict ourselves to time-invariant parameter estimation, although there has been research that determined non-linear effects using the Time Constant model (Sriyananda & Towill, 1973).
The Time-constant model may also be related to the ‘costs’ associated with lost production. In practice, achieving an instantaneous step change in performance at the outset of a new activity or task, that is, , is very rare and some form of learning, , is expected. But if the assumption is that the step change is an idealised benchmark then the ‘standard cost of learning’ (SCL) results (Towill & Bevis, 1973), yielding the area between the maximum level of performance attainable, and the learning curve so that
(2) which results in
5
(3)
Alternatively to the SCL, which may be deemed too stringent a benchmark as instantaneous learning is assumed to be feasible, is to compare start-up curves between varying production systems, say System 1 and System 2, to determine the ‘production gain’ (PG) that is achievable by the better performing system (Davies & Lewis, 1993). Equation 4 gives the resulting PG,
(3)
Once the SCl or PG is evaluated, there is then the need to determine causality. There have been a number of efforts to explore the managerial variables behind the learning curve. For example, Adler and Clark (1991) explore the impact of engineering changes and workforce training on learning. Towill and Cherrington (1993) highlight the organisational and attitudinal, as well as technological, causes for varying levels of start-up performance in the introduction of advanced manufacturing technologies, such as flexible manufacturing systems. Lapré and van Wassenhove (2003) show the importance of a stable environment for successful learning, and further show the important of combining the know-why and the know-how in learning (Lapré et al., 2000). However, there have been no equivalent studies related to supplier performance especially in a construction project environment, where learning across networks of engineering firms has been shown to be problematic, given that such networks operate in temporary, engineer-to-order situations (Gosling, Towill, et al., 2015).
2.2 Learning in Supply Chains and Projects
Learning through experience can accumulate at different levels, including individuals, teams, projects, organisations, and as we will investigate later, supply chains. Learning at the organizational level, or The Learning Organisation, as it is often referred to, has been in use as a term for some time by authors (Garvin, 1993; Senge, 1990). While such work has considerably expanded our understanding of how organizations learn, and raised the learning agenda in firms, it often drifts considerably from the analytical principles of learning curve modelling. This departure, and the broader focus of such literature, has led to definitional and semantic issues. For instance, Ortenblad (2007) showed that many people citing Senge (1990) adopted different and sometimes conflicting positions in relation to the meaning of Learning Organization.
Given the general acceptance that the success of firms is closely tied to the supply networks of which they part, the learning of wider systems than just a single firm must be considered. Despite this, most literature focuses on intra-organisational learning, rather than inter-organizational learning. Bessant et al. (2003) propose that learning is not a natural feature of such inter-organizational networks. Consequently, learning must be encouraged, fostered, analysed, engineered and proactively encouraged, capturing the value of experiential and action learning. Towill (2000) notes that understanding the diffusion dynamics of good supply chain management requires an assessment of the shape of the learning curve, the rate of learning and the final target level. Many supply chains will fail to implement good practice, either struggling with the basics or refusing to change, or even good progress followed by regression. From the few learning curve applications that have been undertaken, it has been shown that supply chain learning is limited without active co-ordination, or support, between buyer and supplier (Kim, 2000), and that learning based improvements are maximised by active co-ordination across different supply chain areas (Jaber et al., 2010). In order to gather clear theoretical insights from such modelling, it is important to gather insight into deliberately undertaken learning efforts ‘behind the learning curve’ (Lapré et al., 2000).
Much of the supply chain literature has focused on the learning gains acquired through long term strategic relationships with suppliers. Spekman (1988) characterises long term collaboration as
6
involving “a high level of purposeful co-operation to maintain a trading relationship over time” (Spekman 1988: p77). This hides considerable complexity, since there are many types of purposeful co-ordination, trading relationships and different time horizons to consider. However, if they are strategically managed, long term relationships have been shown to have the potential for a positive impact on performance (Carr & Pearson, 1999), and successful long term partnerships have long been considered as a key foundation for achieving JIT and lean manufacturing goals (Waters-Fuller, 1995). The premise of long term collaboration rests on the value creation developed through joint activities and relational learning (Cheung et al., 2010), which can lead to the establishment of effective routines, learning through experience and knowledge of each other, including the formation of relationships between individuals at respective organisations. Dyer and Harbir (1998) suggest that Close long term relationships may seek to focus on joint improvement projects to improve processes, collaborative new product development, or the refinement of existing products, and take the form of specific (sometime termed idiosyncratic) investments in assets, knowledge or resources and capabilities. An area that is often overlooked in supply chains is the dynamic and complex time phased development of relations between organisations, but a few studies do give some indication of the patterns to be expected as relationships develop over time. Autry and Golicic (2010) utilise an extensive longitudinal dataset from within the construction sector to develop a relationship strength performance spiral model, finding that buyer–supplier relationships take time to develop, and the association between relationship strength and performance is cyclical over time, leading to ‘positive performance cycles’. They also show that relationship strength may drift in and out of focus as a relationship evolves. Vanpouke et al. (2014) highlight the stages of relationship life cycle between supply chain partners, proposing that as each relationships evolves it goes through exploration, expansion and commitment stages. The first stage is triggered by a desire to develop operational improvements, the second by trust, and the third through interdependence and the commitment of common resources. As the relationship matures, they observe cyclical behaviour, which echoes the spirals identified by Autry and Golicic (2010). Continuous efforts of initiates which are broader in scope are required to sustain the maturing relationship. Hence, we intend to look ‘behind the learning curve’ with respect to supplier development initiatives that lead to learning curve performance and relational gain over time i.e. the gain in learning curve performance due to enhanced supplier relationships.
2.3 Supplier Development Initiatives
Recognition of the benefits of close relationships has led to the rise of supplier development initiatives, whereby a buying firm focuses on the active development of suppliers through such means as evaluation and certification, incentives and direct involvement with the supplier (Krause et al., 2007; Modi and Mabert, 2007). A state-of-the-art review by Sucky and Durst (2013), including 40 empirical studies, found that there are still gaps in terms of the performance outcomes associated with supplier development, as well as long term studies. These are challenges we take up in this paper in terms of the long-term performance outcomes of learning gains. Glock et al. (2017) focus on the value of research in providing decision models for supplier development. They organise supplier development research under preparation, development and monitoring. In terms of future research, they suggest that studies focusing on performance and success of implemented supplier development measures are still rare, and that few decision support models are based on actual cases and real data. These shortcomings in the literature are noted, and we incorporate these concerns into our research design: matching learning curve models to extensive real data from a case of an implemented supplier initiatives.
Supplier development initiatives can be broadly defined as efforts by an industrial buying firm to improve the performance or capability of its suppliers (Krause, 1999). In project-based industries, initiatives are typically adapted to suit relational categories that buying companies use to configure project requirements (Gosling et al., 2013; Gosling, Naim, et al., 2015). Hence, by explicitly looking at quantifying the learning curve to aid decision makers in supplier development programmes (a one-to-many context) in a one-of-a-kind project setting, using an empirical data set, our contribution
7
extends previous studies that have explored the impact of inter-organisational learning on profit gains via stylised numerical examples, such as by Glock (2016), in the context of mutual training in a dyadic, or one-to-one, supply chain, and by Ryu et al. (2005), who study different forms of learning facilitated by an enterprise information portal to aid knowledge transfer in a community of practice, that is, a many-to-many network.
3. Research Method
3.1 Overview
A mixed-method approach is adopted employing two phases. First, empirical performance data is collected as well as contextual information regarding the managerial actions behind the learning curve. Second, the empirical data is analysed using the time constant learning curve model. The empirical context of the modelling work is an organisation that embarked on a change programme to improve the capabilities and management of its supply chain over the time period 2000-2016. The company was formed in 1990. In 2005 the organisation had a turnover of £270 million, rising to £851 million in 2010 with almost 3000 employees. By 2015 this has expanded to almost 4500 people globally with a turnover of £1.75bn. Since 2000, it has maintained impressive growth and has won a range of awards for its supply chain practices, as well as having constructed some of the most iconic high rise buildings in London. In the wake of UK governments reports in the late 1990s (Egan, 1998), the company decided early on to focus on a more integrated and active approach to managing its supply chain. The company operates in a range of sectors across 65 countries, but has been particularly successful in managing the construction of iconic and headquarter commercial offices. It offers a wide range of services including pre-construction engineering, project and programme management, consultancy, construction and production management, supply chain and logistics solutions, facilities management. These services are tailored to client needs.
Pettigrew (1990) suggests choosing an example to demonstrate high or low performance is appropriate justification for studying long term programmes of change. The growth of the company, despite a global recession of the late 2000s, and the range of awards achieved relating to its supply chain practices, make it an interesting case study to prompt reflection on the way construction supply chains may be managed, and our academic study of them. More generally, there have been a range of calls for more longitudinal research in supply chain management research (Boyer & Swink, 2008). Our analysis is not without precedent, as a previous analysis was performed on a different but related dataset in Gosling et al. (2015). This previous analysis, using data from 1990-2014, explored the link between relational categories and the consistency of project performance over time. A major departure is that the dataset analysed in Gosling et al. (2015) was based on performance scores for each supplier assigned once at the end of each project, where the latter can last years. This single point end of project snapshot of supplier performance presents a number of challenges, both for the practitioner and the researcher, but of particular interest in the present paper is the inability to undertake a proper analysis of the rate of learning. To do this, more frequent temporal performance data is needed for each supplier. Hence, a larger performance dataset was acquired from the company systems, which records supplier performance at monthly intervals, and is used to develop learning curves for suppliers.
In this dataset suppliers are rated monthly against 17 Key Performance Indicators (KPIs). These include performance in design and development, contract, pre-planning, drawing and approvals, supply chain, off-site management, on-site management, health, safety and environment, cost management, programme, logistics, quality of installation, operations and maintenance, as-built drawings, quality management systems, systems use and sustainability. An I.T. system supports the KPI process and guidance and data is given to project teams to help them rate against these 17 areas. This data was made available to us from 2007-2015.
The 17 KPIs used in this study are listed and described in Table 1. These performance categories are identified by the company based on general industry practice and through consultation with key
8
supply chain personnel. Performance measures for each supplier during the lifetime of a project are scored using a 4-point Likert Scale - 4 for good performance, 3 for room for improvement, 2 for problems and 1 for failures. This is a straightforward scale used by companies in the industry that is easy to implement in practice and are simple to feedback to suppliers. The statistical tests in Table 2 clearly show that suppliers’ performances across relationship categories are statistically significantly different, which indicates that the proposed list of KPIs are equally important for all categories of suppliers. It is important to highlight that while suppliers’ performance is reported for all KPIs, they are only scored during specific periods of the project assessing the tasks taking place at the time. Furthermore, a 4-point Likert Scale has been implemented in many studies using KPI data. For example, Dawood and Sikka (2006) investigate the development of key performance indicators to establish the benefits of 4-Dimensional planning and identifies 4-point Likert Scale as a suitable measure for key performance indicators. Previous studies have exploited the use of 4-point Likert Scales for KPIs, which forces assessors to make decisive choices rather than potentially choosing a neutral score (Hübner-Bloder & Ammenwerth, 2009; Kundi & Unab, 2014).
Table 1: Summary of the 17 Key Performance Indicators
The dataset consists of performance scores for suppliers working on 17 different projects. The projects include the iconic ‘shard of glass’ in central London, headquarter buildings for major international banks, large media facilities, and premium commercial developments in areas such as Mayfair and Park Lane in London. Hence, the engineering projects are complex and carried out over a number of years. The length of each project is different, and in some cases project start and end dates overlap with each other. Therefore, this study investigates learning over the course of the projects, where the learning curve is constructed using average cumulative scores as explained mathematically in Section 3.3. Hence, we do not focus on the start and end date of the project, but the length and sequence change in performance and learning in each project.
3.2 Summary and Mobilization of the Dataset
The initial starting point was the screening of a total of 4728 performance characteristics for 159 suppliers and 4627 for 157 suppliers are selected based on suitability for analysis. This amounts to 78,659 KPI scores covering the period from April 2007 to December 2014, covering 17 different projects. In order to link our analysis to supplier categories, we developed a hierarchy of relational categories. This is partially based on company practices, but also informed by previous relational categorisations (Gosling, Naim, et al., 2015; Gosling et al., 2010; Wagner & Boutellier, 2002). The data was organised into the following categories, and the managerial supplier development efforts behind each category are explained in more detail later in the paper:
Long Term Strategic Partnerships (LTSP). This category refers to suppliers that have been working closely with the buying organization for over 5 years. This category has received sustained development efforts. The buying organizations maintains a database of strategic suppliers, and we were able to track over time those suppliers that had been listed on the database. The rationale for separating out this longer term category of strategic partners is that, in line with many authors (Kalwani & Narayandas, 1995; Spekman, 1988; Vanpoucke et al., 2014), we acknowledge that relationships and supplier development may take many years to come to fruition.
Partners. Suppliers in this category have been listed on the database of strategic suppliers, but have not consistently been recorded as a strategic partner. Either they are new strategic partners, or, for various reasons, fall in and out of the strategic partner list, representing a similar phenomena as the spirals highlighted by Autry and Golicic (2010). This category of supplier will have experienced significant supplier development efforts, but they are unlikely to have been sustained over time.
Approved. Suppliers in this category are a formal part of the supply chain, but has never been registered as a strategic partner. The approved status is normally applied to suppliers and subcontractors that have met health and safety standards and have been successfully vetted
9
with references, but have yet to develop a performance track record. Suppliers in this category are unlikely to have formally engaged in any supplier development efforts.
Alternative Suppliers (ALT). This category primarily refers to suppliers that are
‘client-nominated’. That is to say that large commissioning clients request particular suppliers to be used on a project during the tender stage. This category may also include very specialist areas of engineering work needed on a project by project bases. This category of suppliers is not managed strategically through the company supply chain processes, but project teams would work closely with this group of suppliers to integrate them. There is little available literature devoted to this type of supplier.
The buying organization would automatically look to the LTSP and Partner categories when new project opportunities arise, but would support this with Approved and ALT categories if required. Table 2 reports descriptive statistics for all 17 KPIs scores across different relationship categories. These are averages (Means) and standard deviations (SDs) along with their statistic consistency tests. Performance consistency is analysed using one-way ANOVA and Levene’s tests. The one-way analysis of variance (ANOVA) is used to determine whether there are any significant differences between the means of the four partnership groups. Apart from KPIs 13 and 14, all other average performance indicators are significantly different at least at the 5% level. The Levene (1960) test of homogeneity of variances is used to examine the consistency of KPIs scores across different relationship categories. The characters ‡, †, * denotes significance level at 1%, 5% and 10%, respectively. Overall test results show that averages and standard deviations of KPIs between relationship categories are significantly different. Moreover, the overall performance of suppliers reported at the bottom of the table clearly indicate that the performance level and the consistency of performance of suppliers are positively correlated with the strength of the relationship between buyer and supplier. In other words, a combination of high average performance and low standard deviation indicates higher reliability and stable performance, and applied to the above means that the order of preference for the buyer is as follows; LTSP, Partners, Approved and ALT.
Table 2: Descriptive statistics for 17 KPIs grouped by relationship categories
Table 3 reports descriptive statistics of the data categorised by project. It shows information for each of the different supplier categories for 17 projects. The projects are all large unique commercial buildings based in the UK. Reported statistics show the number of monthly observations (NM-Obs), mean performance (Mean-P) and standard deviation (SD). The data set was further scrutinised by excluding suppliers that had a total scores shorter than 6 monthly for one project, and also scores for one supplier that had been declared insolvent and was only used once for one project for the period from July-2007 until December-2011. Projects 12 and 13 were excluded from the analysis as they only run for two and three months, respectively, and do not give enough data to understand patterns in learning over time.
Table 3: Descriptive statistics for the data sample categorised by project
3.3 Data Management and Modelling
Learning curves are presented over the course of a project. Hence, we show the performance levels and learning parameters over the months of a project. Key performance indicators, are recorded and used to compute total performance scores for each contracted suppler, s, within each project, p. Assuming that and , the latter is calculated as
(2) The average total performance score for all suppliers for each project is calculated as
10
For each project, different suppliers’ performance levels, namely normal, worst and best supplier performances, are estimated as follows:
(4) (5) (6)
KPIs are ranked in this study based on performance stability that accounts for KPIs’ score averages and variations (Gosling et al. 2015) by standardising suppliers’ performances, SP, as follows:
(7) These standardised performances are reported for distinctive performance categories for all projects. This study employs the Time Constant learning curve model (Bevis et al. (1970) to model suppliers’ standardised performance over a project life-time and estimate learning parameters. The learning time constant concept in this study refers to performance accumulation of 63% of at time and 95% of the final value of at 3 . In other words, this is a rate change in performance level (rise in the learning curve) that is equivalent to at time . (Bevis et al., 1970; Towill, 1973). These learning parameters are estimated by minimising the following objective function:
(8) where are corresponding data points to estimated values and refer to different suppliers’ performance levels ( ), these learning parameters are namely, initial performance, learning duration, performance improvement and dynamic performance, which depend on supplier development initiatives.
4. Supplier Chain Initiatives Behind the Curve and Modelling Propositions
Lapre et al. (2000) have argued that it is necessary to open up the black box of learning to understand the impact of improvement efforts behind the learning curve. Hence, we explain the initiatives behind the dataset analysed in this paper. A number of strategic changes were made between 2000 and 2015 at the case company concerning its supply chain. Between 2000-2005, the organization began to introduce web platforms to allow the exchange of project information. These were initially used for simpler transactions, but over time developed into much more complex project and contract management systems. These now allow suppliers to explore contract data, designs and drawing, as well as programme and project information. An early decision was made to rationalise the supply base and seek to embrace, where possible and appropriate, longer term relationships. An initial Pareto exercise, to identify the suppliers accounting for 80% of work, led to strategic partnerships with suppliers, and a more structured supply base. Early initiatives included working with key suppliers to develop JIT processes by which deliveries could be synchronised with site progress.
A physical best practice hub was set up to facilitate learning and knowledge sharing with its supply chain. Through this physical hub, the company is able to gather and undertake supply chain data and intelligence, as well as implement best practice across the organization and supply chain. Training capabilities have been built up through many years of development. A suite of programmes for suppliers now exists, covering, amongst other areas, all phases of construction, planning and co-ordination, quality, commercial management, I.T., health and safety, and environment. Trends in the 17 KPIs are used to inform and update course content. For example, poor scores in the pre-planning and programme KPIs led to new training modules in these areas. The organization now has formal accreditation, which is delivered to the supply chain by senior managers, coaches and directors with the relevant expertise.
11
From 2006 to 2010, the company accelerated its investment in communication, training and education. In the early part of 2006 a more structured approach was adopted with regard to suppliers appraisal and further initiatives were also set up to improve communication and integration of different suppliers that needed to interface with each other. Hence, cluster management strategies were developed to encourage suppliers to integrate work in more effective ways. These target clusters of trades, suppliers and work packages where interface issues are likely to arise. Structured team building and introduction events are held, including ‘head start’ workshops to help design clusters work together more effectively. During this period, a leadership coaching programmes for senior supply chain staff was developed and executive briefing workshops were also initiated to give information about upcoming projects and work that may be available in the coming months, therefore allowing supplier to forecast and gain a better understanding of market outlook. This was further supported by the introduction of an internal logistics consultancy, which advises suppliers on logistics, site processes and material flows.
In the more recent phase of development, between 2011-2015, the organization began working with manufacturers and suppliers with offsite technologies and approaches to reduce process times and exposure to uncertainties of site activities, including the promotion and adoption of modular design principles. Control dashboards were introduced for key strategic suppliers, showing a snapshot of performance against key areas of activity and countermeasures for any ongoing issues. In addition to the KPI system, risk management processes have begun to be incorporated into the performance management system, and contracting documentation and approaches have also been streamlined to become less bureaucratic and more collaborative.
Of particular interest in our analysis is the improvement efforts behind the different supplier categories. LTSP and Partner categories benefit from being part of the strategic partnering programme. A key component of this is the training programme. This includes a suite of 11 supplier courses covering areas: construction, commercial management, quality, procurement, sustainability, health and safety, document management, and different aspects of IT and engineering systems. These are only undertaken by strategic partners. Other initiatives with strategic partners include regular review meetings with performance dashboards, early supplier involvement, awards, joint improvement with project teams, joint investment in technology and formalised communication and escalation processes. In addition, they are recipients of many of the initiatives explained in the foregoing account of the development since 2000. The key distinction between the 2 categories in our dataset is that the LTSP category have been immersed in this approach consistently for over 5 years. For example, the top performing company in the database is an LSTP, and has collectively participated in 581 different courses over the time period of the dataset (2007-2015).
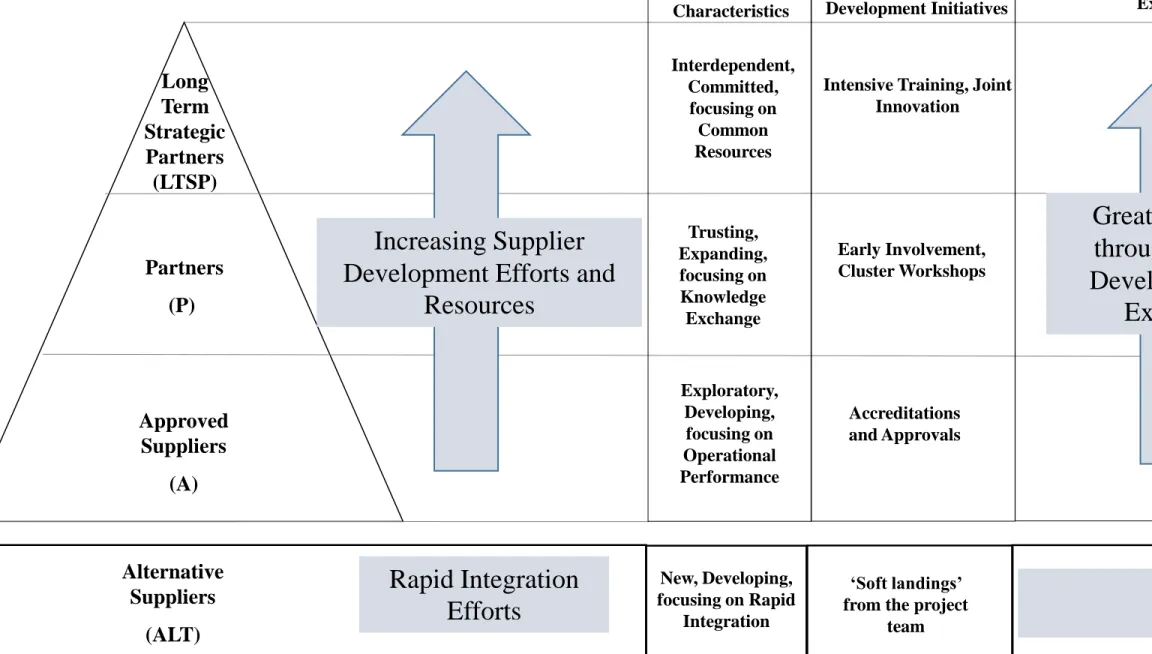
Based on the foregoing review of the literature, the categories explained in the method, and the contextual understanding of the initiatives behind the learning curve of the case company, Figure 2 summarises the propositions in the paper. Our expectations are as follows for the modelling work:
We expect LTSPs to exhibit signs of interdependency and commitment, and a dedication to common resources. There should be an excellent initial starting point, since there is more continuity form one project to the next, and excellent learning over the course of a project.
The Partner category should display some of these properties, but are more in line with the trust building and expansion phase described in Vanpouke (2014). Here we expect that learning curves would display a good initial starting point and a good rate of learning, but not quite as good as those in the long-term category.
The Approved category of suppliers would likely have more of a focus on exploring opportunities and developing tactical operational performance improvements. Hence, we expect a lower level of learning.
Since there is little guiding literature for the ALT category, we were not able to develop a clear proposition for the learning performance of this category, and leave it for open ended investigation of the data.
12
Figure 2: Characteristics of, and Learning Expectations for, different supplier categories
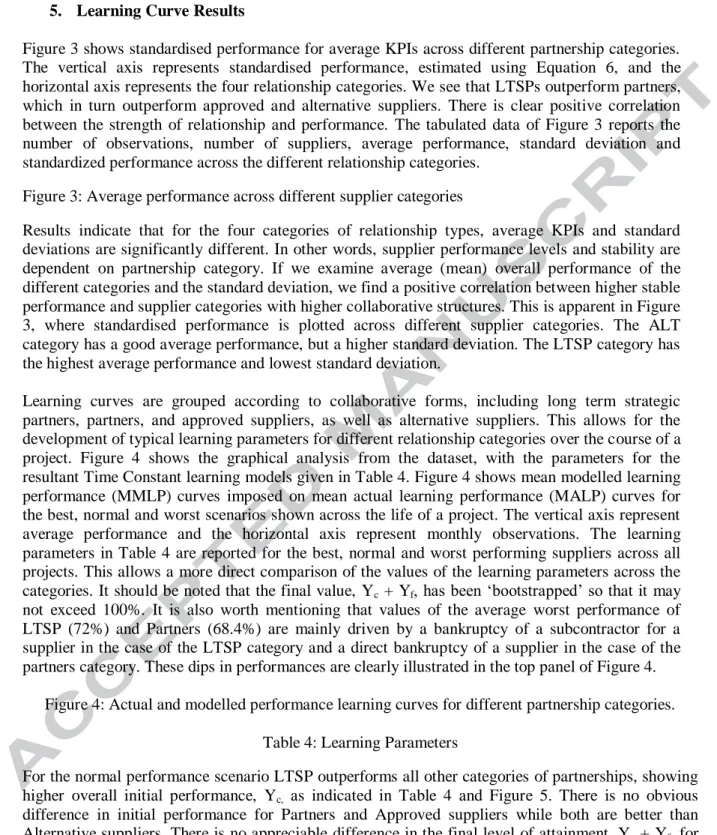
5. Learning Curve Results
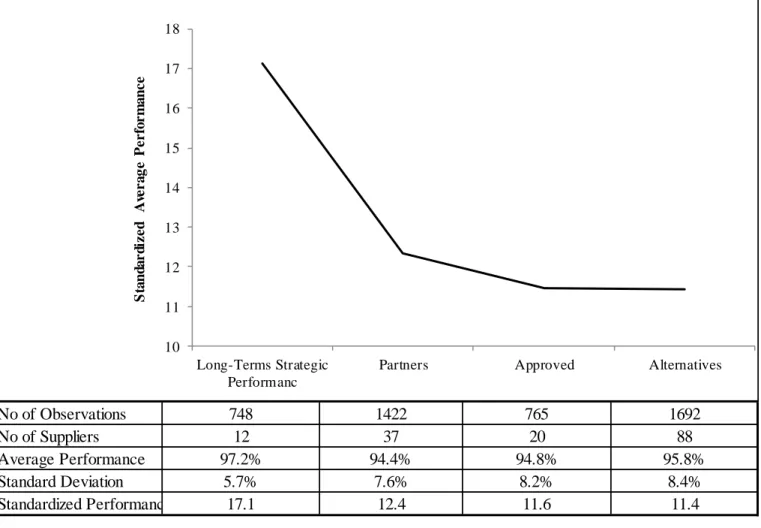
Figure 3 shows standardised performance for average KPIs across different partnership categories. The vertical axis represents standardised performance, estimated using Equation 6, and the horizontal axis represents the four relationship categories. We see that LTSPs outperform partners, which in turn outperform approved and alternative suppliers. There is clear positive correlation between the strength of relationship and performance. The tabulated data of Figure 3 reports the number of observations, number of suppliers, average performance, standard deviation and standardized performance across the different relationship categories.
Figure 3: Average performance across different supplier categories
Results indicate that for the four categories of relationship types, average KPIs and standard deviations are significantly different. In other words, supplier performance levels and stability are dependent on partnership category. If we examine average (mean) overall performance of the different categories and the standard deviation, we find a positive correlation between higher stable performance and supplier categories with higher collaborative structures. This is apparent in Figure 3, where standardised performance is plotted across different supplier categories. The ALT category has a good average performance, but a higher standard deviation. The LTSP category has the highest average performance and lowest standard deviation.
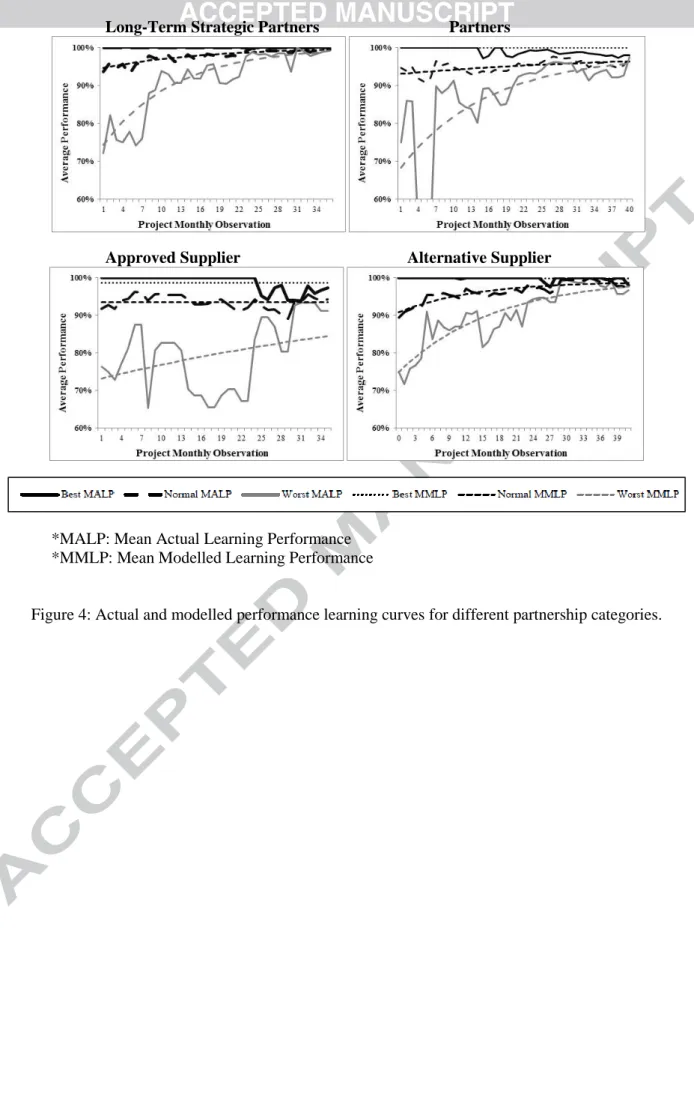
Learning curves are grouped according to collaborative forms, including long term strategic partners, partners, and approved suppliers, as well as alternative suppliers. This allows for the development of typical learning parameters for different relationship categories over the course of a project. Figure 4 shows the graphical analysis from the dataset, with the parameters for the resultant Time Constant learning models given in Table 4. Figure 4 shows mean modelled learning performance (MMLP) curves imposed on mean actual learning performance (MALP) curves for the best, normal and worst scenarios shown across the life of a project. The vertical axis represent average performance and the horizontal axis represent monthly observations. The learning parameters in Table 4 are reported for the best, normal and worst performing suppliers across all projects. This allows a more direct comparison of the values of the learning parameters across the categories. It should be noted that the final value, Yc + Yf, has been ‘bootstrapped’ so that it may
not exceed 100%. It is also worth mentioning that values of the average worst performance of LTSP (72%) and Partners (68.4%) are mainly driven by a bankruptcy of a subcontractor for a supplier in the case of the LTSP category and a direct bankruptcy of a supplier in the case of the partners category. These dips in performances are clearly illustrated in the top panel of Figure 4.
Figure 4: Actual and modelled performance learning curves for different partnership categories. Table 4: Learning Parameters
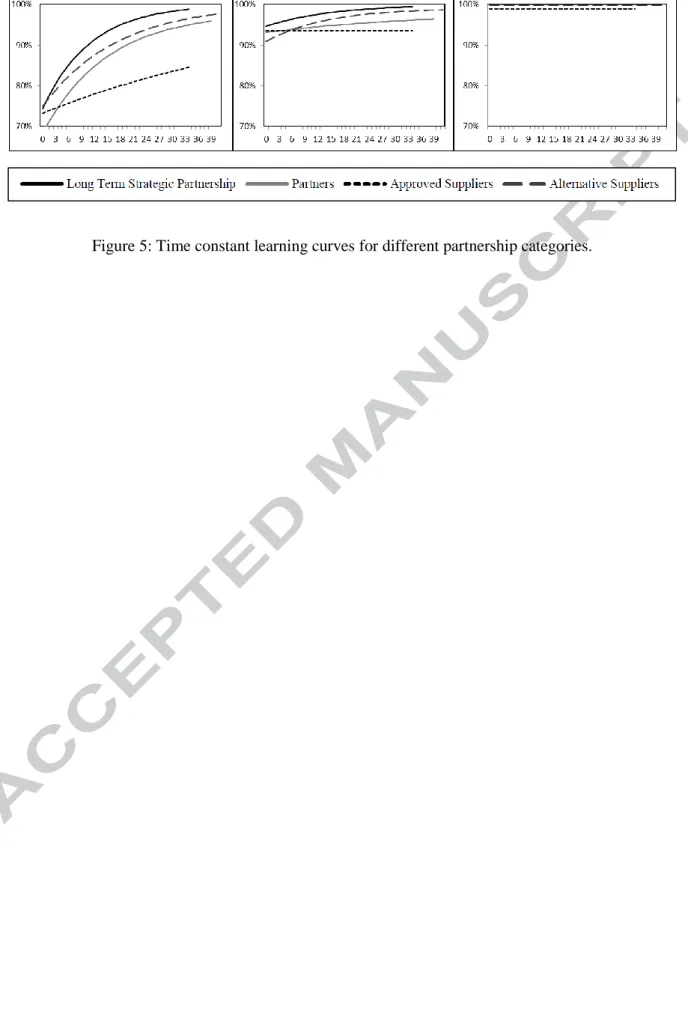
For the normal performance scenario LTSP outperforms all other categories of partnerships, showing higher overall initial performance, Yc, as indicated in Table 4 and Figure 5. There is no obvious
difference in initial performance for Partners and Approved suppliers while both are better than Alternative suppliers. There is no appreciable difference in the final level of attainment, Yc + Yf, for
LTSP, Partners and Alternative suppliers, as they all tend to 100%, but all three are better than Approved suppliers, which shows no learning improvement whatsoever. But we find that τAlt < τLTSP <
τPartners indicating that Alternative suppliers learn faster than other categories of partnership, while
LSTP suppliers have a better rate of learning than Partners. Table 4 indicates that for the worst performance scenario the rates of learning are such that τLTSP < τPartners < τAlt < τApproved, an indication
that in the worst scenarios LTSP suppliers have a better rate of learning than Partners, Approved suppliers and ALT suppliers. All categories of suppliers’ eventually will attain 100% performance but at the different rates indicated. For the best performers, there is a clear indication that there is little
13
discernible difference between categories, with all achieving close to 100% attainment at the start of projects.
Figure 5 shows summary plots of the estimated learning curves and grouped based on best, normal and worst performing suppliers for different supplier categories. Finally, in Table 5 we test the statistical significance difference in actual learning performance across different partnership categories and it shows that average performance for different supplier categories are reported in percentages diagonally. The reported results are for one tailed independent t-test to determine any statistically significance between the means of actual learning performance across different partnership groups and results reported from left to right are the alternative hypothesis and then t-test result in brackets and significance level. The character ‡, † and * denote the significance levels 1%, 5% and 10%, respectively. TNA denotes Test Not Applicable.
Figure 5: Time constant learning curves for different partnership categories.
Table 5: Testing the significance differences in mean modelled learning across different supplier categories
6. Discussion
6.1 Learning Performance within a Supplier Category
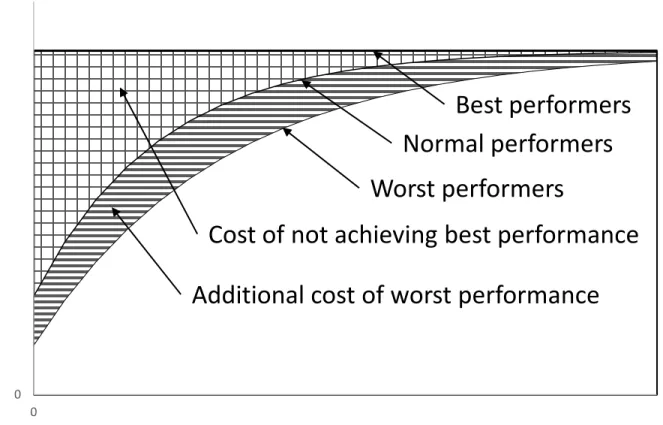
Through our analysis, we have demonstrated the range of learning performance in different categories. As shown in Figure 6, each category has a best, normal and worst performers. In an ideal world, all suppliers would be at best performer level, synonymous with an idealised step change in performance, avoiding the costs associated with not achieving best performance. Those costs, in the case reported here, would be associated with not achieving full performance in the 17 KPI areas specified earlier in the paper. For example, through defects, rework, accidents or delays. Hence, few suppliers achieve the best level of performance with the majority of suppliers achieve close to normal performance. Figure 6 also shows the additional cost of the worst performance, when suppliers drop below learning levels of normal performers. The managerial implications are that action should be taken to ensure the learning curve is as steep as possible. This may be undertaken through experience, learning by doing, or interventions, which leads us to discuss learning performance across the supplier categories.
Figure 6: Graphical interpretation of learning losses within a supplier category
6.2 Learning Performance across Supplier Categories
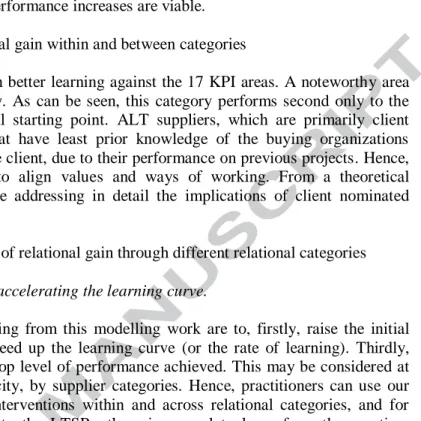
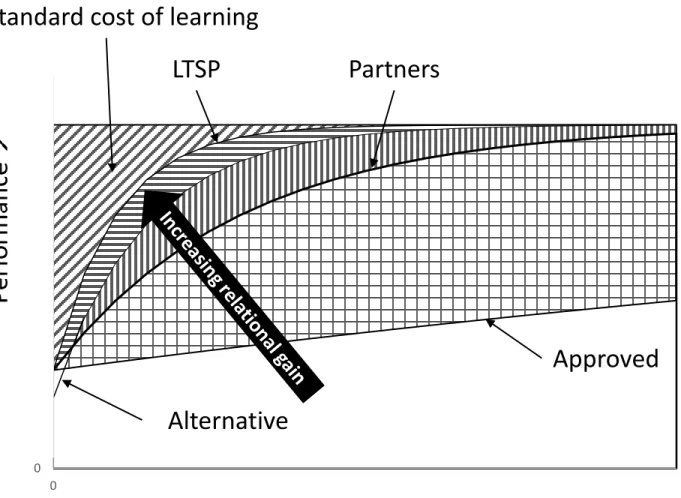
The analysis presented in this paper has highlighted that there is a difference in learning performance across categories. Figure 7 shows a graphical interpretation of the learning curves of the four supplier categories. The shaded area at the top indicates the standard cost of learning, whereas the shaded areas between the different categories show the additional learning costs between the different relational categories. It is possible to see that there is a 'relational gain' in terms of learning as we move through the categories, although the gain diminishes as we move higher up the categories. The curves in figure 7 also show that ALT suppliers perform least well in the initial stage, but learn quickly thereafter. In terms of managerial effort behind this learning period, much time and resource are invested into ensuring that the ALT category are well integrated.
Percentages for these rational gains within and between categories are estimated by calculating the area under the curves are reported in Table 6. Table 6 highlights the benefits in learning performance between worst, normal and best performers for each category. More significantly, it is notable that the
14
'best of the best', namely the best in the LTSP category, are equivalent to the idealised step change in performance, normally considered an extremely stringent benchmark but in the case investigated is achievable. Thus, the percentage increases in relational gains for all other supplier categories as well as within category suggest significant performance increases are viable.
Table 6: Rational gain within and between categories
The relational gain is expressed through better learning against the 17 KPI areas. A noteworthy area of discussion is the alternative category. As can be seen, this category performs second only to the LTSP category, but has a lower initial starting point. ALT suppliers, which are primarily client nominated suppliers, are the group that have least prior knowledge of the buying organizations processes but have the confidence of the client, due to their performance on previous projects. Hence, project teams work hard with them to align values and ways of working. From a theoretical standpoint, there is very little literature addressing in detail the implications of client nominated suppliers.
Figure 7: Graphical interpretation of relational gain through different relational categories
6.3 Managerial recommendations: accelerating the learning curve.
The implications for practitioners flowing from this modelling work are to, firstly, raise the initial performance level and, secondly, to speed up the learning curve (or the rate of learning). Thirdly, there is the challenge to maximise the top level of performance achieved. This may be considered at individual supplier level or, for simplicity, by supplier categories. Hence, practitioners can use our models to reflect on the managerial interventions within and across relational categories, and for benchmarking purposes. With respect to the LTSPs, there is a need to learn from the practices employed with the ‘best of the best’, understanding those suppliers that attain maximum learning performance. From a benchmarking perspective, our study provides very clear evidence of the benefits of a relational gain in learning performance from long term close relationships, which we recommend that practitioners should embrace and value in their development programmes. For the Alternative suppliers, there is a low initial performance level and learning starts from a lower base. Hence, practitioners must put in place formalised, robust, rapid integration processes focusing on speeding up the learning of the initial phases of a project. Finally, we use this opportunity to encourage practitioners to fully understand the way that different types of learning take place, the processes behind the learning curve, and to take steps to ensure that ‘lessons learnt’ do not get lost. There is also a need to acknowledge the costs of not achieving the 'best' learning performance.
7. Conclusion
This paper aimed to determine the relational gain of supplier development initiatives on the learning performance of suppliers during the lifetime of a project. This aim was considered within the context of a project based organisation in the construction engineering sector, and the main finding from the research undertaken is that there is a relational gain in terms of learning performance of suppliers that are in long term strategic partnership with the buying organization.
To satisfy the aforementioned aim, we first ascertained the supplier improvement efforts ‘behind the learning curve’ to determine the underlying causal actions that result in a particular learning performance, and then analysed a large unique dataset related to learning performance for suppliers over time. An important part of the organisation’s approach is the categorisation of suppliers under relational types, each receiving different improvement efforts form the buying organisation. The four emerging categories, LTSPs, Partners, Approved and ALTs, each with different characteristics and supplier development efforts, were mobilized to inform the modelling work undertaken.
The modelling then led to the development of learning curves for different supplier relational categories to understand their degree of learning across the lifetime of a construction project. The
15
results indicate that the more collaborative the supplier category the more stable performance is, the higher initial performance in the learning curve, the higher average performance, and the higher maximum performance. This is particularly the case where there is a long term relationship with the supplier. Our findings strongly support the argument that long term relationship with a supplier results in better performance and learning.
To discuss the managerial implications, graphical interpretation of the curves were presented in the discussion. What is clear from this is that a range of supplier development efforts are needed across different suppliers. On the one hand, a strategic programme of development yields results for developing a relational gain in learning performance over time, and particularly over the long term. On the other hand, buying organisations in project environments must be able to incorporate in flexible ways new suppliers that are requested by clients or for specialist engineering work. Such suppliers will arrive with little formal knowledge of processes and systems. Hence, buying organizations must develop project specific mechanisms for incorporating and aligning such suppliers into projects via rapid integration.
While learning curves are well established phenomena, the application in a supplier development context is very sparse. Furthermore, the body of knowledge relating learning curves to performance in supply chains has little wide scale statistical testing to support it. This paper makes the important contribution of investigating the impact of collaborative initiatives on performance via a comprehensive data set from the construction sector. The final output is a set of learning curves and graphical interpretations that can be used for benchmarking supply chain performance through learning, and to develop strategies for relational development and supplier development.
Whereas the dataset is comprehensive and unique, there are a number of limitations of the study. First, there is the context in which the learning took place, and from which the dataset was obtained. The data reports managerial actions over a long time period in the domain of construction engineering projects within the UK, from an organization that specialises in iconic commercial buildings. Hence, there is a high level of complexity in the projects. The data also relates to a specific set of KPIs, developed within the context of a particular organization, so care should be taken in generalising the results and transferring the managerial actions carried out in this context. Second, there is the focus on supplier learning and performance. This is distinct, although closely related, from project outcomes, such as on-time, on-budget and to-specification. Third, we did not analyse the potential impact of overlap in the projects studies on KPIs, which would make an interesting avenue for further analysis. Future research could give further clarification of the nature of supplier learning and project outcomes. Another fruitful avenue for further research is the alternative category presented and explained in the paper. Effective management and integration of such ‘client nominated’ or specialist suppliers has been scarcely addressed in the literature.
8. References
Adler, P.S. & Clark, K.B. (1991). Behind the learning curve: A sketch of the learning process. Management Science, 37(3), 267-281.
Anzanello, M.J. & Fogliatto, F.S. (2011). Learning curve models and applications: Literature review and research directions. International Journal of Industrial Ergonomics, 41(5), 573-583. Autry, C.W. & Golicic, S.L. (2010). Evaluating buyer–supplier relationship–performance spirals: A
longitudinal study. Journal of Operations Management, 28(2), 87-100.
Bessant, J., Kaplinsky, R. & Lamming, R. (2003). Putting supply chain learning into practice. International Journal of Production & Operations Management, 23(2), 167-184.
Bevis, F., FINNlEAR, C. & Towill, D. (1970). Prediction of operator performance during learning of repetitive tasks. The International Journal of Production Research, 8(4), 293-305.
Boyer, K.K. & Swink, M. (2008). Empirical elephants - why multiple methods are essential to quality research in operations and supply chain management. Journal of Operations Management, 26, 337-348.
16
Carr, A.S. & Pearson, J.N. (1999). Strategically managed buyer–supplier relationships and performance outcomes. Journal of Operations Management, 17(5), 497-519.
Cheung, M.-S., Myers, M.B. & Mentzer, J.T. (2010). Does relationship learning lead to relationship value? A cross-national supply chain investigation. Journal of Operations Management, 28(6), 472-487.
Childerhouse, P. & Towill, D.R. (2003). Simplified material flow holds the key to supply chain integration. Omega, 31(1), 17-27.
Davies, A. & Lewis, H. (1993). Dynamics of AMT capacity planning. In: D.R. Towill & J.E. Cherrington, A systems approach to AMT deployment: Springer Science & Business Media, . Dawood, N. & Sikka, S. (2006). The value of visual 4D planning in the UK construction industry. In:
Intelligent Computing in Engineering and Architecture (pp. 127-135): Springer.
Dwyer, F.R., Schurr, P.H. & Oh, S. (1987). Developing buyer-seller relationships. The Journal of marketing, 11-27.
Dyer, J.H. & Singh, H. (1998). The relational view:cooperative strategy and sources of interorganizational competitive advantage. Academy of management review, 23(4), 660-679. Egan, J. (1998). Rethinking Construction: The Report of the Construction Task Force In. London:
DETR.
Epple, D., Argote, L. & Devadas, R. (1991). Organizational learning curves: A method for investigating intra-plant transfer of knowledge acquired through learning by doing. Organization science, 2(1), 58-70.
Gann, D. & Salter, A. (2000). Innovation in project-based, service-enhanced firms: the construction of complex products and systems. Research policy, 29, 955-972.
Garvin, D.A. (1993). Building a Learning Orgnization. Harvard Business Review(July-August), 78-91.
Glock, C.H. (2016). Training suppliers by delegating workers: A decision support model. Computers & Industrial Engineering, 93, 302-309.
Glock, C.H., Grosse, E.H. & Ries, J.M. (2017). Decision support models for supplier development: Systematic literature review and research agenda. International Journal of Production Economics, 193, 798-812.
Gosling, J., Naim, M. & Towill, D. (2013). A supply chain flexibility framework for engineer-to-order systems. Production Planning & Control, 24(7), 552-566.
Gosling, J., Naim, M., Towill, D., Abouarghoub, W. & Moone, B. (2015). Supplier development initiatives and their impact on the consistency of project performance. Construction Management and Economics, 3(5/6), 390-403.
Gosling, J., Purvis, L. & Naim, M.M. (2010). Supply chain flexibility as a determinant of supplier selection. International Journal of Production Economics, 128(1), 11-21.
Gosling, J., Towill, D.R., Naim, M.M. & Dainty, A.R. (2015). Principles for the design and operation of engineer-to-order supply chains in the construction sector. Production Planning & Control,
26(3), 203-218.
Grosse, E.H., Glock, C.H. & Müller, S. (2015). Production economics and the learning curve: A meta-analysis. International Journal of Production Economics, 170, 401-412.
Hamade, R.F., Jaber, M.Y. & Sikström, S. (2009). Analyzing CAD competence with univariate and multivariate learning curve models. Computers & Industrial Engineering, 56(4), 1510-1518. Hübner-Bloder, G. & Ammenwerth, E. (2009). Key performance indicators to benchmark hospital
information systems–a Delphi study. Methods of Information in Medicine, 48(06), 508-518. Humphreys, P.K., Li, W. & Chan, L. (2004). The impact of supplier development on buyer–supplier
performance. Omega, 32(2), 131-143.
Jaber, M.Y. (2011). Learning curves: Theory, models, and applications: CRC Press.
Jaber, M.Y. & Bonney, M. (1999). The economic manufacture/order quantity (EMQ/EOQ) and the learning curve: past, present, and future. International Journal of Production Economics,
59(1), 93-102.
Jaber, M.Y., Bonney, M. & Guiffrida, A.L. (2010). Coordinating a three-level supply chain with learning-based continuous improvement. International Journal of Production Economics,