The University of Akron
IdeaExchange@UAkron
Honors Research Projects The Dr. Gary B. and Pamela S. Williams Honors
College
Spring 2017
Effects of Corrosion Inhibitor on the Corrosion
Behavior of Low Carbon Steel in CO2
Environment
Michael HarrisThe University of Akron, mah168@zips.uakron.edu
Please take a moment to share how this work helps youthrough this survey. Your feedback will be important as we plan further development of our repository.
Follow this and additional works at:http://ideaexchange.uakron.edu/honors_research_projects Part of thePetroleum Engineering Commons
This Honors Research Project is brought to you for free and open access by The Dr. Gary B. and Pamela S. Williams Honors College at IdeaExchange@UAkron, the institutional repository of The University of Akron in Akron, Ohio, USA. It has been accepted for inclusion in Honors Research Projects by an authorized administrator of
IdeaExchange@UAkron. For more information, please contactmjon@uakron.edu, uapress@uakron.edu. Recommended Citation
Harris, Michael, "Effects of Corrosion Inhibitor on the Corrosion Behavior of Low Carbon Steel in CO2 Environment" (2017).Honors Research Projects. 475.
1
Effects of Corrosion Inhibitor on the Corrosion Behavior of Low Carbon Steel in CO2
Environment 4250-497
Michael Andrew Harris
Department of Corrosion Engineering Honors Research Project
Submitted to The Honors College
2
Executive summary Problem Statement
Industry failures due to corrosion are often overlooked and even less understood, but carry significant impact. Although there are many types of corrosion failures, failures due to CO2
corrosion have made a resurgence due to advances in fracking technology. There are many ways to reduce corrosion, especially CO2 corrosion, but some methods are more effective than others
when considering cost of labor, cost of mitigation, and overall return on investment. Inhibitors are widely used to mitigate corrosion in the oil and gas industry due to their relatively cheap cost and effectiveness at reducing corrosion. This research studied the effect of benzyldimethytetradecyl-ammonium chloride (C14) or more frequently known as benzalkonium chloride (C14) as a corrosion inhibitor and its effectiveness of reducing corrosion of mild steel in an aqueous CO2 environment. Benzalkonium chloride (C14) was chosen as the inhibitor due to
its prevalent use in the oil and gas industry as a biocide to mitigate microbiologically influenced corrosion. If benzalkonium chloride (C14) is found to be an effective inhibitor of CO2 corrosion,
companies will gain cost savings through the use of only one product to protect against multiple corrosion threats.
Experimental Results
Two important quantitative findings were determined from this research. The electrochemical corrosion reaction kinetics was under mixed charge transfer and mass transfer control. The analysis of the Nyquist plots revealed depressed capacitive semi-circles after immersion, indicating double layer capacitance and charge transfer control, because of non-protective corrosion scale forming at the surface [11]. The anodic and cathodic polarization tests revealed the semi-vertical slope through the low overpotential range, indicated mass transport
3
control. The second finding was the formation of two corrosion scales, iron carbide and iron carbonate. The formation of these scales was temperature dependent and stable iron carbonate was only observed at 80oC. The Nyquist plots demonstrated the polarization resistance (Rp) decreased quickly after initial immersion. Overtime, the polarization resistance stabilized and the capacitive semi-circles did not vary drastically in size. Only in the 80oC testing was a significant increase in polarization resistance seen overtime. This increase in Rp overtime can be seen as the second semi-circle branching out from the first semi-circle, indicating the precipitation of iron carbonate.
Conclusions
Definitive conclusions from this research include the determination of the corrosion reaction being under mixed charge transfer and mass transfer control. The determination of at least two scale species and their formation depending on temperature based upon the EIS data was also another definitive conclusion. Iron carbide and highly soluble iron carbonate are not protective scales, but in a high temperature environment, iron carbonate will precipitate and from a protective corrosion scale. Unfortunately, no definitive conclusion can be drawn on the effectiveness of benzalkonium chloride (C14) corrosion inhibitor due to similar EIS and polarization resistance results with previous, non-inhibited studies.
Implications
The broader implications of this work include, increasing laboratory experience, testing methods and analysis, conducting long term experiments, adjusting to project deadlines, and organizing and presenting results in a professional environment. Implications based on the findings and conclusions from this report can be utilized by future researchers to compare their findings with and determine if benzalkonium chloride (C14) is an effective corrosion inhibitor.
4
Recommendations
Future work to conduct includes testing various other types of inhibitors, further testing and repeat testing of trials to ensure data validity, corrosion scale characterization, and comparison of corrosion rates to determine if the corrosion inhibitor is providing a benefit. It was determined the inhibitor tested was a cathodic inhibitor so further testing should include anodic and mixed reaction inhibitors along with additional cathodic inhibitors to determine which is most effective. A cost analysis should then be completed to rank and determine which inhibitor is best at reducing corrosion, while also being cost effective. Continued testing and repeating experiments to confirm the results is always recommended, especially at very low inhibitor and salt concentrations. Errors could stem from higher solution resistances causing interference in the electrochemical measurements and possible contamination at such low concentrations. Based upon the temperature, corrosion inhibitor, inhibitor concentration and salt concentration, the surface composition and morphology should be characterized to help develop a proposed mechanism and to determine any changes occurring within the scale. The benzalkonium chloride (C14) appears to be affecting the cathodic reaction and limiting iron carbonate formation at lower temperatures. If benzalkonium chloride (C14) is preventing the precipitation of iron carbonate, and not mitigating corrosion rate by surface adsorption, then a more suitable inhibitor is required for an aqueous CO2 environment. An inhibitor that can help precipitate iron carbonate at lower temperatures, prevent iron carbide from forming, or form another more protective species would decrease the corrosion rate and more effectively mitigate corrosion.
5
Introduction
Corrosion of carbon steel through dissolved carbon dioxide (CO2) is a serious problem in
the oil and gas industry, causing failures and negatively impacting the environment and reputation. The expansion of fracking and the use of CO2 injection for increased recovery of oil,
exploration of carbon dioxide rich natural gas reservoirs; carbon dioxide corrosion is becoming a prevalent corrosion failure mechanism within the energy industry[1]. Carbon dioxide corrosion takes place when carbon dioxide dissolves into solution, forms carbonic acid, dissociates into carbonate and bicarbonate. Iron atoms will be drawn out in the form of Fe2+ from the steel to form Fe(HCO3)2 and FeCO3, but the latter is more commonly observed[2]. The time to formation
and structure of the iron carbonate (FeCO3) layer depends on many variables. These variables
include concentrations of Fe2+ and CO32-, pH, surface-volume ratio, and temperature[2]. Many
mechanisms have been proposed but irrespective of these proposals, iron carbonate scale formation is reoccurring theme, especially at higher temperatures. Iron carbide (Fe3C) forms at
lower temperatures and are non-protective scales, while iron carbonate (FeCO3) forms at higher
temperatures and is a protective scale[2]. The goal of this research is to determine the effectiveness of benzalkonium chloride (C14) of reducing the corrosion rate of mild steel in aqueous CO2. Variables to be tested include temperature, salt concentration, and concentration of
inhibitor. The effect of inhibitor will be tested, analyzed, and the polarization resistances will be compared with previous research to determine if the inhibitor positively impacts the corrosion rate of mild-steel in aqueous carbon dioxide.
Background
The basic carbon dioxide corrosion reaction include CO2 dissolution and hydration to
6
𝐶𝑂2(𝑔) → 𝐶𝑂2(𝑎𝑞) (1)
𝐶𝑂2(𝑎𝑞) + 𝐻2𝑂(𝑙) → 𝐻2𝐶𝑂3 (2)
The carbonic acid then dissociates into bicarbonate and carbonate, equations (3) and (4), giving the overall reaction seen in equation (5)[2].
𝐻2𝐶𝑂3 → 𝐻++ 𝐻𝐶𝑂3− (3)
𝐻𝐶𝑂3− → 𝐻++ 𝐶𝑂32− (4)
𝐹𝑒 + 𝐶𝑂2+ 𝐻2𝑂 → 𝐹𝑒𝐶𝑂3+ 𝐻2 (5)
Although the overall reaction is straightforward, the mechanisms and side reactions are very complex, and are affected by many factors. These factors include but are not limited to temperature, CO2 concentration, H2S concentration, salt concentration, solution composition,
flow, and grade of steel[3]. Of all the variables that appear to play a role in CO2 corrosion, only
temperature, salt concentration, and inhibitor concentration were tested for this research. Temperature appears to be the most significant variable on CO2 corrosion due to the role
temperature plays in the formation rate and structure of the iron carbonate corrosion scale[2, 4]. At lower temperatures (below 60-70oC), uniform and compact FeCO3 scale layers do not form
because of the high solubility of the iron carbonate, while above 60-70oC, uniform and compact FeCO3 scale layers are observed due to the decreased solubility of iron carbonate at higher
temperatures[5]. The corrosion scale formed at lower temperatures has been found to be iron
carbide (Fe3C), which is a non-protective scale[4]. Dugstad et al. [6] investigated the iron
carbonate film formation and found a galvanic interaction between Fe3C and iron. This galvanic
interaction will accelerate the dissolution of iron by promoting the cathodic reaction since Fe3C
has a much lower overpotential for the cathodic reaction[6], which is supported by research conducted by Crolet et al[7]. The effect of salt concentration on CO
7
has been studied and many mechanisms have been proposed. Liu et al. [8] reported chloride ions broke down the corrosion scale and influenced the morphology of the scale, but did not change the composition. Han et al. [9] found that increasing chloride concentration appeared to inhibit CO2 corrosion through decreasing the solubility of CO2 in solution at room temperature;
indicating that the cathodic reactions were decreased by chloride concentration and the anodic reactions were not affected.
This research explored the effects of benzalkonium chloride (C14) corrosion inhibitor on the corrosion rates of mild-steel in an aqueous CO2 environment to determine if the corrosion
inhibitor is effective, while adjusting the variables of temperature, chloride concentration, and inhibitor concentration. NaCl concentrations were adjusted from 0.1 wt. % and 1.0 wt. %, were made from analytical NaCl and deionized water (18.2MΩ cm). Temperature effects were studied and ranged from 20 oC, 40 oC, 60 oC, and 80 oC, and concentrations of inhibitor were utilized based upon the critical micelle concentration, ranging from 0.1 CMC, 0.5 CMC, 1 CMC through 10 CMC. The critical micelle concentration (CMC) is the minimum concentration to achieve adequate corrosion protection, while managing the volume and cost of inhibitor added to the system. Any additional increases in concentration and or volume of inhibitor above the optimum CMC value should have minimal effects on decreasing corrosion rate. It has been observed high concentrations of inhibitors are required to inhibit lower concentrations of salt solutions.
Experimental Methods
Two different grades of carbon steels C1010 and C1018 (UNS G10100 and UNS G10180) were tested and the chemical composition for both steels is listed in Table 1. Microelectrode technique was used in the potentiodynamic polarization experiments using C1010 and C1018 wire electrodes, with a diameter of 500 μm. The polyimide-coated wires were
8
embedded in two-component epoxy resin and mounted in a PVC holder. The exposed surface area of the wire electrode was approximately 0.002 cm2. One and a half hour open circuit potential (OCP) measurements were conducted to allow the potential of the electrode stabilize before initiating the potentiodynamic polarization tests. A typical anodic scan started at -30 mV to +1.0 V with respect to OCP, while the cathodic scan started at +30 mV to -1.5 V with respect to OCP. The scan rate was 0.167 mV/s.
C1018 carbon steel electrodes were used for electrochemical impedance spectroscopy (EIS). Cylindrical electrodes of C1018 were utilized, with a height of 1.2 cm and a radius of 0.45 cm, giving an exposed surface area of 4.38 cm2 due to a Teflon crush washer as seen in Figure 1.
EIS measurements were conducted for 96 cycles (1h/cycle), and each cycle contained a sequential measurement of 45 min OCP, and 15 min EIS, with one hour OCP measurement at the start of each experiment. The inhibitor was added after the 48th cycle using an injection pipette through a rubber septum to prevent any air contamination.
All electrodes were wet-polished with silicon carbide (SiC) abrasive paper up to 600 grit, rinsed with acetone, isopropanol alcohol, deionized (DI) water, and then dried with Argon gas. The test solutions were made up from analytical grade sodium chloride and deionized water (18.2 MΩ-cm in resistivity) with concentrations 0.1 wt. %, and 1.0 wt. %.The test solution was purged with research grade CO2 for at least one hour in the 200 mL jacketed Gamery cell, and
the test system was continuously purged with CO2 at a lower flow rate to ensure saturation
throughout the test. The test vessel was filled with 150 mL test solution such that the test specimens were fully immersed. The temperature was controlled using a circulating water bath controlled by a Polyscience digital temperature controller. A graphite rod was used as the counter electrode, and a saturated calomel electrode (SCE) was used as the reference electrode.
9
Figure 1 (a) and (b) depict the experimental setup and equipment. Both potentiodynamic polarization and EIS measurements were conducted using a Gamery Reference 600+ system.
Figure 1: (a) Carbon steel electrode schematic; (b) the Gamery cell with temperature controller
Data and Results
Experiments conducted over the semester included cathodic polarization, anodic polarization, and impedance testing. Anodic polarization testing was conducted at 0.1 wt. % NaCl and 1.0 wt. % NaCl, at various inhibitor concentrations for C1010 at 20oC. Based upon
previous research, the anodic reaction kinetics of CO2 corrosion in the presence of chlorides is
dependent on the chloride concentration and not temperature[4]. As seen in Figure 2, the anodic polarization of C1010 in 0.1 wt. %NaCl solution experienced a decrease in current density with increasing inhibitor concentration (increasing CMC). 1 CMC had a significant decrease in current density, especially when compared to 10 CMC; it was expected 10 CMC should have similar current densities as 1 CMC. It is unclear why 10 CMC increased in current density.
Figure 3 shows similar results of a decrease in current density with increasing CMC for 1.0 wt. % NaCl solutions at 20oC. As experienced during the 0.1 wt. % NaCl anodic polarization testing, inhibitor concentrations above 1 CMC increased in current density. It is noted that regardless of the current density, the addition of inhibitor shifted the OCP more positive.
10
Figure 2: Anodic polarization for C1010 at 0.1 wt. % NaCl, 20oC, at various CMCs; decrease in current density as inhibitor concentration was increased. 10 CMC did not experience a significant decrease in current density like the1 CMC test; it was expected 10 CMC to have similar results as 1 CMC
Figure 3: Anodic polarization for C1010 at 1.0 wt. % NaCl, 20oC, at various CMCs; decrease in current density as inhibitor concentration was increased; more positive OCP values were observed with increasing CMC. 5 CMC increased in current density, not following the trend of 0-1 CMC experiments
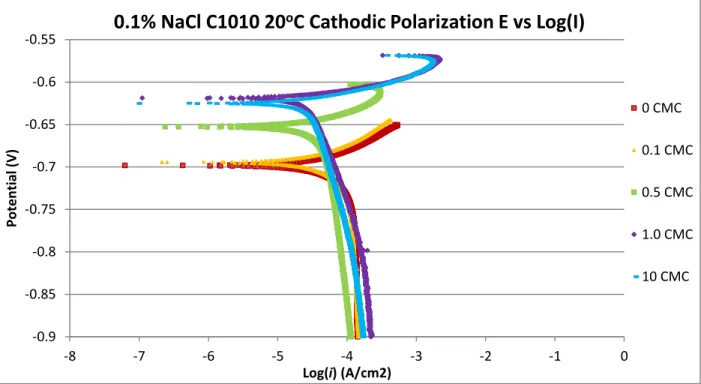
Figure 4, 5, and 6 show the cathodic polarization for C1010 and C1018 at 0.1 wt. % NaCl and 1.0 wt. % NaCl. Like the anodic polarization testing, the open circuit potential values became more noble with increasing CMC, reaching a plateau around the OCP for 1 CMC for the
-0.8 -0.725 -0.65 -0.575 -0.5 -0.425 -0.35 -0.275 -0.2 -9 -8 -7 -6 -5 -4 -3 -2 -1 0 Pot e n tial ( V) Log(i) (A/cm2)
0.1% NaCl C1010 20
oC Anodic Polarization E vs Log(I)
0 CMC 0.1 CMC 0.5 CMC 1.0 CMC 10.0 CMC -0.75 -0.7 -0.65 -0.6 -0.55 -0.5 -0.45 -0.4 -0.35 -0.3 -8 -7 -6 -5 -4 -3 -2 -1 0 Pot e n tial ( V) Log(i) (A/cm2)
1.0% NaCl C1010 20
oC Anodic Polarization E vs Log(I)
0.0 CMC 0.1CMC 0.5CMC 1.0CMC 5.0 CMC
11
cathodic polarization of both C1010 and C1018. The OCP for C1018 tests in 1.0 wt. % NaCl (Figure 6) deviated from the trend of OCP stabilization, 2 CMC and 3 CMC had open circuit potentials more positive than the OCP of 1 CMC. The current density of C1010 cathodic polarization tests in 0.1 wt. % NaCl experienced minor deviances in current density, as seen in
Figure 4. C1010 and C1018 cathodic polarization tests in 1.0 wt. % NaCl experienced significant changes in current density with increasing CMC, as seen in Figure 5 and 6. This trend indicated the cathodic reaction was being influenced by the Cl-concentration, similar to the anodic reactions. A semi-vertical line in the low overpotential range is observed in all cathodic polarization tests. This low potential range can be observed from -0.75V to -0.9V. These semi-vertical lines in the low overpotential range are indicative of the cathodic reaction kinetics being under mass-transport control from the H+ and /or H2CO3 reduction reactions[10]. If the cathodic
reaction is under mass transport control, it will be sensitive to temperature changes because of diffusion and increased mass transport at higher temperatures. Based upon the anodic and cathodic polarization data, the anodic process is more sensitive to chloride concentration, while the cathodic process has some sensitivity to chloride concentration. The anodic reaction is therefore driven by the chloride concentration, while the cathodic reaction appears to be influenced by both chloride concentration and mass-transport control of the H+ and /or H2CO3
12
Figure 4: Cathodic polarization for C1010 at 0.1 wt. % NaCl, 20oC, at various CMCs; slight
decrease in current density as inhibitor concentration was increased; more noble OCP were observed with increasing CMC, semi- linear curves observed in the low overpotential range
Figure 5: Cathodic polarization for C1010 at 1.0 wt. % NaCl, 20oC, at various CMCs; decrease in current density as inhibitor concentration increased, semi-linear curves observed in the low overpotential range. -0.9 -0.85 -0.8 -0.75 -0.7 -0.65 -0.6 -0.55 -8 -7 -6 -5 -4 -3 -2 -1 0 Pot e n tial ( V) Log(i) (A/cm2)
0.1% NaCl C1010 20
oC Cathodic Polarization E vs Log(I)
0 CMC 0.1 CMC 0.5 CMC 1.0 CMC 10 CMC -0.9 -0.85 -0.8 -0.75 -0.7 -0.65 -0.6 -0.55 -0.5 -8 -7 -6 -5 -4 -3 -2 -1 Pot e n tial ( V) Log(i) (A/cm^2)
1.0% NaCl C1010 20
oC Cathodic Polarization E vs Log(I)
0.0 CMC 0.5CMC 1.0CMC 5.0 CMC
13
Figure 6: Cathodic polarization for C1018 at 1.0 wt.% NaCl, 20oC, at various CMCs; decrease
in current density as inhibitor concentration was increased, semi-linear curves in the low overpotential range. Current densities increased above 1 CMC, not following previous trends
Electrochemical Impedance Spectroscopy (EIS) was used to determine polarization resistance and the Nyquist and Bode plots were analyzed to determine what was taking place at the sample’s surface. Figures 7, 9, 10, 12, and 13 are the Nyquist plots for C1018 electrodes in CO2 saturated 1.0 wt.% NaCl at 20oC, 40oC, and 60oC. After initial immersion, the Nyquist plots
had depressed capacitive semicircles at high to medium frequency and also had inductive semicircles at low frequency. The depressed capacitive semicircles at high to medium frequency can be attributed to the double layer capacitance and charge transfer resistance[4]. The inductive semicircles at low frequency can be attributed to the adsorption of intermediate corrosion products on the sample surface[11]. These inductive semicircles are not as pronounced at 60oC
compared to 20oC and 40oC. The capacitive semicircles at low frequency are related to the formation of iron carbonate (FeCO3) on the electrode surface, but this semicircle gradually
decreases in size over time, indicating the FeCO3 is not able to accumulate and dissolves back
into solution[11]. 1 CMC of inhibitor was added after 24 hours in the 20oC test (Figure 7) and -0.9 -0.85 -0.8 -0.75 -0.7 -0.65 -0.6 -0.55 -0.5 -8 -7 -6 -5 -4 -3 Pot e n tial ( V) Log(i) (A/cm^2
1.0% NaCl C1018 20
oC Cathodic Polarization E vs Log(I)
0 CMC 0.5 CMC 1 CMC 2 CMC 3 CMC
14
after 48 hours in the 40oC and 60oC tests (Figures 9, 10, 12, and 13). Figures 8, 11, and 14 are the Bode plots for C1018 electrodes in CO2-saturated 1 wt.% NaCl at 20oC, 40oC, and 60oC.
These Bode plots have a high frequency peak and a low frequency valley, giving two time constants[4]. The maximum phase angle peak increases and then decreases to lower frequency
with increasing time. This initial high phase angle, then a decrease is typically associated with an increase in the double layer capacitance[11].
Figure 7: EIS Nyquist plot for C1018 electrode, 1 CMC C14 inhibitor, 20oC; at various
exposure times, inhibitor was added after 24h, Nyquist curve is unstable but trends to a larger curve (higher Rp) overtime and after addition of inhibitor
15
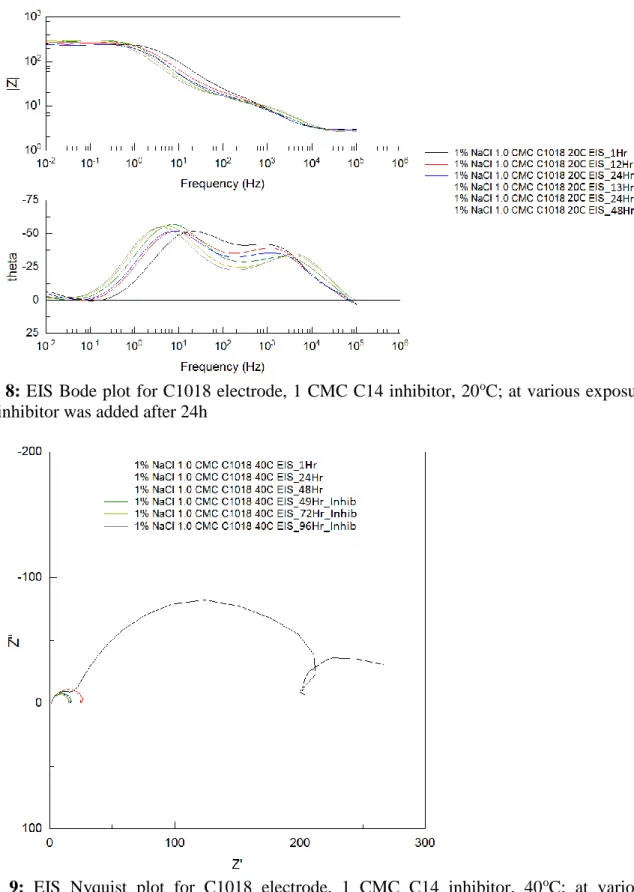
Figure 8: EIS Bode plot for C1018 electrode, 1 CMC C14 inhibitor, 20oC; at various exposure times, inhibitor was added after 24h
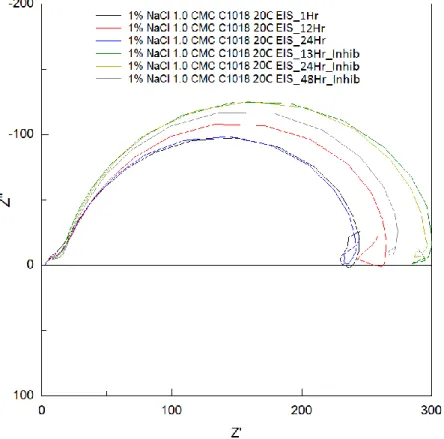
Figure 9: EIS Nyquist plot for C1018 electrode, 1 CMC C14 inhibitor, 40oC; at various exposure times, inhibitor was added after 48h, initial Nyquist curve at t=1h is very large due to initial exposure of sample
16
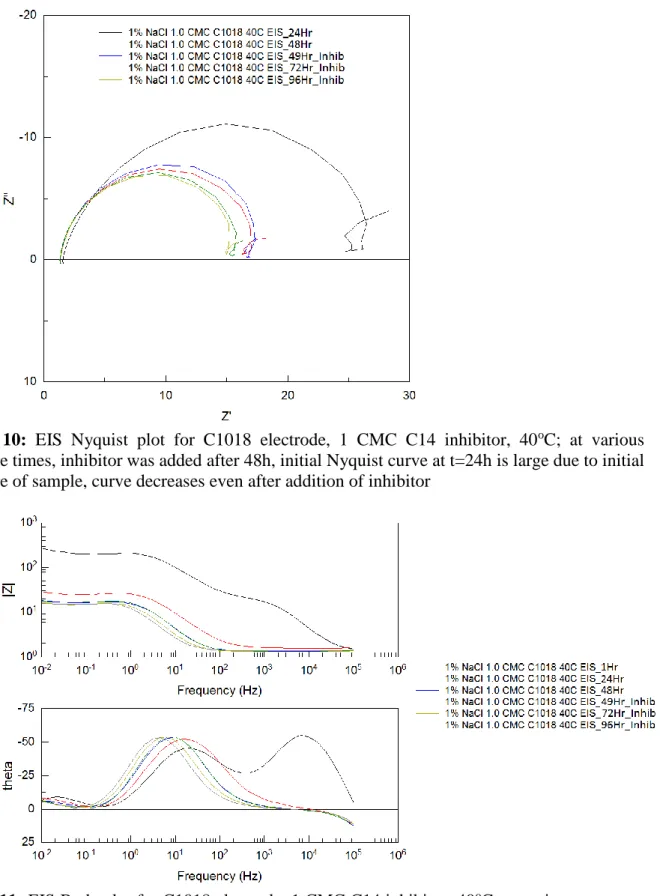
Figure 10: EIS Nyquist plot for C1018 electrode, 1 CMC C14 inhibitor, 40oC; at various exposure times, inhibitor was added after 48h, initial Nyquist curve at t=24h is large due to initial exposure of sample, curve decreases even after addition of inhibitor
Figure 11: EIS Bode plot for C1018 electrode, 1 CMC C14 inhibitor, 40oC; at various exposure times, inhibitor was added after 48h
17
Figure 12: EIS Nyquist plot for C1018 electrode, 1 CMC C14 inhibitor, 60oC; at various exposure times, inhibitor was added after 48h, initial Nyquist curve at t=1h is very large due to initial exposure of sample
Figure 13: EIS Nyquist plot for C1018 electrode, 1 CMC C14 inhibitor, 60oC; at various exposure times, inhibitor was added after 48h, Nyquist curve decreases even after addition of inhibitor.
18
Figure 14: EIS Bode plot for C1018 electrode, 1 CMC C14 inhibitor, 60oC; at various exposure times, inhibitor was added after 48h
Figure 15 and 16 are the Nyquist and Bode plots for C1018 electrodes in CO2-saturated
1 wt.% NaCl at 80oC. 1 CMC of inhibitor was added after 48 hours. The initial immersion semi-circles, up to approximately 50 hours look very similar to the lower temperature experiments; keeping with the same depressed semicircles at high to medium frequency. Unlike the other temperatures, the capacitive semicircle at low frequency disappears more quickly (~24hrs), indicating iron carbonate is forming and not dissolving. The capacitive semicircles continue to expand, and form two half circles after forty-nine hours, as seen at hour seventy-two and ninety-six. This indicates that the iron carbonate is not dissolving and is forming a protective scale on the surface of the mild-steel, as seen by an increase in polarization resistance (Rp). Figure 16
shows the corresponding Bode plot and two peaks at high and low frequencies are observed. The peak phase angle increases with time, which could be related to increased scale growth leading to more capacitive surface film[11].
19
Figure 15: Figure 10: EIS Nyquist plot for C1018 electrode, 1 CMC C14 inhibitor, 80oC; at various exposure times, inhibitor was added after 48h, initial Nyquist curve at t=1h is large due to initial exposure of sample, curve increases overtime and after addition of inhibitor, two arched curves present at 72h and 96h
Figure 16: EIS Bode plot for C1018 electrode, 1 CMC C14 inhibitor, 80oC; at various exposure
20
Discussion and Analysis
Per the results from the analysis of the Nyquist and Bode plots combined with the anodic and cathodic polarization, CO2 corrosion of mild-steel in NaCl environments is under mixed
charge transfer and mass transfer control. This is evident through the Nyquist plots with the depressed capacitive semi-circles after initial exposure and the Bode plots with increased maximum peak phase angles, indicating charge transfer control[11]. The cathodic polarization tests revealed the cathodic reaction kinetics were under mass-transport control through the semi-vertical lines in the low overpotential range. Per Wu et at. [10], H+ and /or H2CO3 cathodic
reduction reactions are represented by the semi-vertical lines in the low overpotential range. The cathodic reaction appears to also be influenced by the chloride concentration, which deviates from the findings of Zeng and Lui in non-inhibited solutions[3, 8].The addition of benzalkonium chloride (C14) appears to be making the cathodic reaction more sensitive to chloride concentration.
As seen in the Nyquist plots (Figures 7, 9, 10, 12, 13, and 15) the polarization resistance (Rp) decreased quickly after initial immersion. Overtime, the polarization resistance stabilized and the size of the capacitive semi-circles did not significantly change. Only in the 80oC testing was a significant increase in polarization resistance seen overtime. This increase in polarization resistance was observed as the second semi-circle branching out from the first semi-circle, indicating the precipitation of iron carbonate. Sun et al. and Zeng et al [11, 3] reported similar findings regarding the increase in polarization resistance with temperature and the changes to the capacitive semi-circles. At this time, it is unclear if benzalkonium chloride (C14) was effectively mitigating CO2 corrosion because the EIS results obtained from experimentation matched other
21
al. and Kinsella et al. [3, 12] reported stabilized iron carbonate formation at temperatures at or below 60oC, which was not observed with the addition of benzalkonium chloride (C14). The inhibitor could be disrupting the formation of iron carbonate, therefore increasing corrosion rates at lower temperatures. Future work includes testing other types of inhibitors, testing of benzalkonium chloride (C14) at 0.01 wt. % and 10.0 wt. % NaCl, repeat testing of trials to ensure data validity, and characterization of the corrosion scale. Since benzalkonium chloride (C14) appears to be affecting the cathodic reaction and limiting iron carbonate formation at lower temperatures, surface composition and morphology should be studied to determine any changes occurring to the corrosion scale. If benzalkonium chloride (C14) is preventing the precipitation of iron carbonate, and not mitigating corrosion rate by surface adsorption, then a more suitable inhibitor is required for an aqueous CO2 environment.
22
Sources
[1] Zhao G.X, et al., 'Formation Characteristic of CO2 Corrosion Product layer of P110 Steel Investigated by SEM and Electrochemical Technique'. Iron and steel research International, Year 2009. 16( 4): p. 89‐94.
[2] S. Papavinasam. Corrosion Control in the Oil and Gas Industry, Elsevier, (2014) p. 220 [3] Z. Zeng, R.S. Lillard, H. Cong, “Effect of Salt Concentration on the Corrosion Behavior of
Carbon Steel in CO2 Environment”, Corrosion., Vol. 72, No. 6 (2016)
[4] Z. Zeng, S. Li, H. Cong, “Effect of Temperature on the Corrosion Scale Formation on Low-Carbon Steel in CO2 and Cl- Environment”, NCERCAMP., (2017)
[5] R. H. Hausler, H. P. Gaddart, eds., Advances in CO2 corrosion, vol. 1 (1985) and 2 (1986) (Houston,
TX: NACE)
[6] A. Dugstad, H. Hemmer, M. Seiersten, "Effect of Steel Microstructure upon Corrosion Rate and Protective Iron Carbonate Film Formation", CORROSION/2000, paper no. 23 (Houston, TX: NACE, 2000).
[7] J. L. Crolet, "Corrosion in Oil and Gas Production," in Corrosion and Anticorrosion, eds. G. Beranger, H. Mazille, (Pairs, France: Hermes Science, 2002).
[8] Q.Y. Liu, L.J. Mao, S.W. Zhou, Effects of chloride content on CO2 corrosion of carbon steel
in simulated oil and gas well environments, Corros. Sci., 84 (2014) p. 165-171.
[9] J. Han, J.W. Carey, J. Zhang, Effect of sodium chloride on corrosion of mild steel in CO2-
saturated brines, J. Appl. Electrochem., 41 (2011) p. 741-749.
[10] S.L. Wu, Z.D. Cui, F. He, Z.Q. Bai, S.L. Zhu, X.J. Yang, Characterization of the surface film formed from carbon dioxide corrosion on N80 steel, Mater. Lett., 58 (2004) p. 1076-1081.
[11] J.B. Sun, G.A. Zhang, W. Liu, M.X. Lu, The formation mechanism of corrosion scale and electrochemical characteristic of low alloy steel in carbon dioxide-saturated solution, Corros. Sci., 57 (2012) p. 131-138
[12] B. Kinsella, Y.J. Tan, S. Bailey, Electrochemical impedance spectroscopy and surface characterization techniques to study carbon dioxide corrosion product scales, Corrosion, 54 (1998) p. 835-842.
23
Appendices
Table 1: Chemical composition (weight percent) for carbon steels used
Element C Mn S P Fe
C1010 0.08 0.31 0.042 0.04 Balance
C1018 0.14-0.20 0.6-0.9 <0.035 <0.030 Balance
Electrode Area Calculations:
1. 𝐶1010/𝐶1018 − 𝑚𝑖𝑐𝑟𝑜𝑒𝑙𝑒𝑐𝑡𝑟𝑜𝑑𝑒: 𝑆𝐴 = 𝑟2∗ 𝜋
a. r = 0.025 cm b. SA = 0.00197 cm2
2. 𝐶1018 − 𝑐𝑦𝑙𝑖𝑛𝑑𝑖𝑟𝑐𝑎𝑙 𝑒𝑙𝑒𝑐𝑡𝑟𝑜𝑑𝑒: 𝑆𝐴 = (2𝜋 ∗ 𝑟 ∗ 𝐻) + (𝜋 ∗ 𝑟2) + (𝜋 ∗ 𝑟2− 𝜋 ∗ 𝑐2) a. r = 0.45cm
b. c = radius of Teflon crush washer c. SAT = 4.67 cm2
d. SAE = 4.38 cm2
Required Volume of Stock Inhibitor
1. M1V1=M2V2
a. M1 (stock solution of surfactant, 0.5g/10mL) i. MW = 368.04 g/mol (C14)
ii. M = 0.13613 mol/L
b. V1 (unknown volume of stock solution to be added to Gamery Cell)
c. M2 (final concentration of stock solution, depends on what fraction of CMC being tested)
d. V2 (volume of the test cell) i. Gamery vessel = 200 mL
Surfactant NaCl % CMC (uM)
C14 0.1% 150
C14 1.0% 60
24
Table 2: Example of uL of Stock Solution Required (uL) using 0.5g/10mL of Benzalkonium Chloride (C14) Stock Solution
Inhibitor C14 (368.04 g/mol) CMC uL CMC uL CMC uL CMC uL CMC uL CMC uL CMC uL 0.1 0.5 1 2 3 4 5 NaCl [ ] 0.1% 22.0 110.2 220.4 440.8 661.1 881.5 1101.9 1% 8.8 44.1 88.2 176.3 264.5 352.6 440.8 10% 1.0 5.1 10.3 20.6 30.9 41.1 51.4