Nowcasting Methods for Optimising Building Performance
Hu Du
1, Carlos Fernández Bandera
2, Lei Chen
1,
1
Welsh School of Architecture, Cardiff University, Cardiff, United Kingdom
2School of Architecture, University of Navarra, Pamplona, Spain
[email protected]
Abstract
In meteorology term, nowcasting is weather forecasting for the next few minutes to six hours using all immediately available weather data. It is a relatively new subject, which often involves remote sensing, numerical weather prediction models, and advanced data communication infrastructure.
High-quality weather nowcasting is crucial for optimising building performance in the near future. A range of nowcasting techniques has been used for such purposes. It includes statistical, machine learning, Numerical Weather Prediction (NWP), top-down and bottom-up approaches.
This paper firstly reviews the advantages and disadvantages of common nowcasting methods with the focus on solar radiation nowcasting. Based on the review, popular methods have been classified into five categories. Authors then investigated further the nowcasting data provided by weather Application Programming Interfaces (APIs) that is backed by Numerical Weather Prediction. This is due to its large-scale application potential and the significances in the most recent update on solar radiation nowcast.
Secondly, the paper explores the implications of applying weather nowcasting to dynamic building simulations, most importantly, examining its impact on the accuracy of indoor temperature prediction for free float buildings, heating load prediction and heating energy for heated buildings. The study used three buildings from BESTEST ANSI/ASHRAE Standard 140-2014 as the case studies. The results show that the most recent update of weather API includes meaningful solar radiation prediction. If the building does not have a large south facing glazing, the indoor temperature and heating load predictions from dynamic models are reasonably accurate.
Introduction
Previous research (Lazos et al., 2014) shows that weather variables are significant components of minimising the uncertainty in prediction, which can lead to 15-30% savings compared to deterministic and non-weather sensitive control approach. The accuracy of the weather forecast has always been a challenge for many decades. In recent years, significant progress has been made Numerical Weather Prediction, especially when nowcasting technologies have been discussed in meteorology communicates.
The World Meteorological Organisation has organised few international nowcasting workshops starting from 2007 and published Guidelines for Nowcasting Techniques in 2017. Remote sensing, numerical weather prediction models, and advanced data communication infrastructure have contributed to the improvement of weather forecast accuracy. This provided an excellent platform for optimising building performance which relies heavily on weather inputs.
Nowcasting methods for solar radiations
With the increasing number of weather stations and open data platforms available around the world, a range of techniques has been used to predict weather parameters. Solar radiation prediction remains challenging due to its dynamic feature.
Inman et al. (2013), Diagne et al. (2013), Antonanzas et al. (2016) and Yang et al. (2018) have provided good reviews on solar irradiance and PV outputs. The key methods include time series method, regression, numerical weather prediction model, machine learning and image-based forecasting.
For building simulation industry, Direct Normal Irradiance and Diffuse Horizontal Irradiance are equally important as Global Horizontal Irradiance due to the complex geometry of buildings and their energy implications. Therefore, more localised prediction methods are developed for building performance optimisation. In the view of authors, they can be classified into the following five categories (also see table 1): • Statistical and Learning method
• Numerical Weather Prediction (NWP) models • NWP plus bottom-up measurements
• NWP plus top-down observations
• Weather API supported by Numerical Weather Prediction
Statistical and Learning methods essentially utilise the pattern of historical data to predict future values. The most typical statistical method is ARIMA (Autoregressive Integrated Moving Average) model. The most representative learning method is undoubtedly the Artificial Neural Network (ANN). Based on the ANN architectures, different algorithms were introduced to optimise the performance of the ANN model including BP LM, SCG, CGP, etc. (see the first section of Table 1). These methods have good flexibility in spatial and temporal resolution. However, the primary challenge is their replicability, which often involves the manual
handling process of selecting input variables, models, algorithms, and validation methods.
Numerical Weather Prediction (NWP) began in the early 20th century and experienced a series of improvements in recent decades. Modern NWP models commonly include
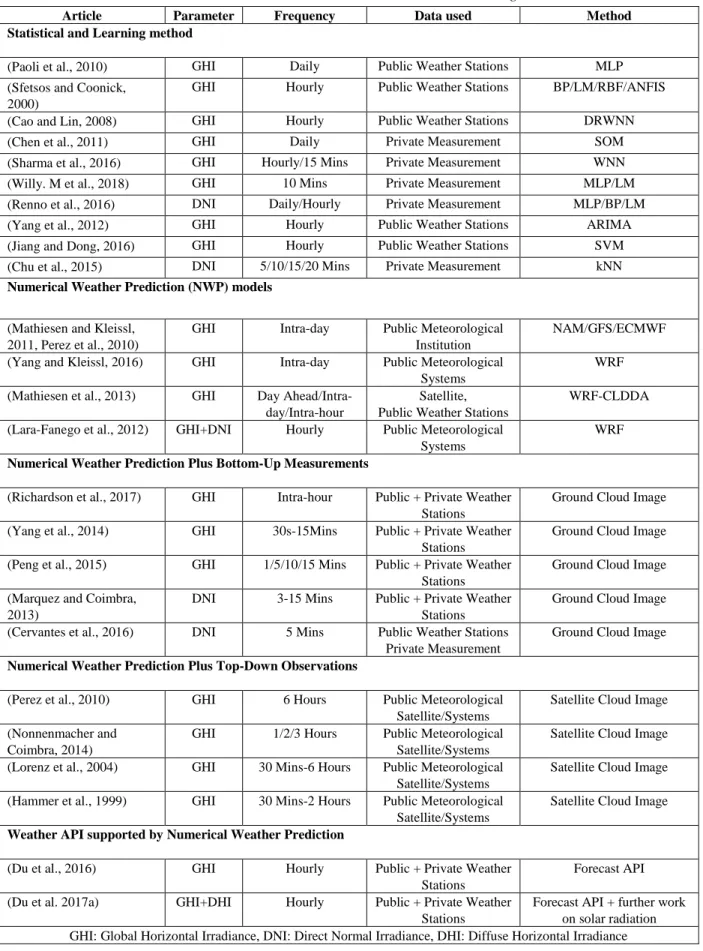
Table 1: Previous studies on solar radiation nowcasting
Article Parameter Frequency Data used Method
Statistical and Learning method
(Paoli et al., 2010) GHI Daily Public Weather Stations MLP
(Sfetsos and Coonick, 2000)
GHI Hourly Public Weather Stations BP/LM/RBF/ANFIS
(Cao and Lin, 2008) GHI Hourly Public Weather Stations DRWNN
(Chen et al., 2011) GHI Daily Private Measurement SOM
(Sharma et al., 2016) GHI Hourly/15 Mins Private Measurement WNN
(Willy. M et al., 2018) GHI 10 Mins Private Measurement MLP/LM
(Renno et al., 2016) DNI Daily/Hourly Private Measurement MLP/BP/LM
(Yang et al., 2012) GHI Hourly Public Weather Stations ARIMA
(Jiang and Dong, 2016) GHI Hourly Public Weather Stations SVM
(Chu et al., 2015) DNI 5/10/15/20 Mins Private Measurement kNN
Numerical Weather Prediction (NWP) models
(Mathiesen and Kleissl, 2011, Perez et al., 2010)
GHI Intra-day Public Meteorological
Institution
NAM/GFS/ECMWF
(Yang and Kleissl, 2016) GHI Intra-day Public Meteorological
Systems
WRF
(Mathiesen et al., 2013) GHI Day
Ahead/Intra-day/Intra-hour
Satellite, Public Weather Stations
WRF-CLDDA
(Lara-Fanego et al., 2012) GHI+DNI Hourly Public Meteorological
Systems
WRF
Numerical Weather Prediction Plus Bottom-Up Measurements
(Richardson et al., 2017) GHI Intra-hour Public + Private Weather
Stations
Ground Cloud Image
(Yang et al., 2014) GHI 30s-15Mins Public + Private Weather
Stations
Ground Cloud Image
(Peng et al., 2015) GHI 1/5/10/15 Mins Public + Private Weather
Stations
Ground Cloud Image
(Marquez and Coimbra, 2013)
DNI 3-15 Mins Public + Private Weather
Stations
Ground Cloud Image
(Cervantes et al., 2016) DNI 5 Mins Public Weather Stations
Private Measurement
Ground Cloud Image
Numerical Weather Prediction Plus Top-Down Observations
(Perez et al., 2010) GHI 6 Hours Public Meteorological
Satellite/Systems
Satellite Cloud Image
(Nonnenmacher and Coimbra, 2014)
GHI 1/2/3 Hours Public Meteorological
Satellite/Systems
Satellite Cloud Image
(Lorenz et al., 2004) GHI 30 Mins-6 Hours Public Meteorological
Satellite/Systems
Satellite Cloud Image
(Hammer et al., 1999) GHI 30 Mins-2 Hours Public Meteorological
Satellite/Systems
Satellite Cloud Image
Weather API supported by Numerical Weather Prediction
(Du et al., 2016) GHI Hourly Public + Private Weather
Stations
Forecast API
(Du et al. 2017a) GHI+DHI Hourly Public + Private Weather
Stations
Forecast API + further work on solar radiation GHI: Global Horizontal Irradiance, DNI: Direct Normal Irradiance, DHI: Diffuse Horizontal Irradiance
Global Forecast System (GFS) such as Weather Research and Forecasting (WRF)., or regional models such as North American Mesoscale (NAM), European Centre for Medium-Range Weather Forecasts (ECMWF), and Met Office United Kingdom (UK) Atmospheric Hi-Res Model Deterministic UK (UKV). They are suitable for forecasting solar radiation in large spatial horizon (5km-20km) and temporal horizon (4hours-36hours) that thus contributes to a region forecast. Although NWP methods usually are able to provide meteorological forecast including radiation, the forecast of solar radiation data tends not to be offered freely to the public until very recently.
Given the limitations of NWP, some bottom-up measurements methods have become popular in recent years, including the usage of Total Sky Imager. These methods typically extract image data form local imager(s) along with a line or a sector upwind of the sun and apply regression and machine learning methods to imager measurements at specific pixels or groups of pixels to derive cloud height, speed, GHI and DNI at the sky imager location. Although the spatial resolution of the image is relatively limited because of the ability of camera and cost of Total Sky Imager is relatively high, it provides advance warning of approaching clouds at a lead-time of several minutes to hours that contribute to the short-term forecast of solar radiation.
Unlike bottom-up measurements methods relies on ground-based cloud image, top-down observations methods tend to analyse satellite cloud image obtained from the atmosphere above. Hammer et al. (1999), Lorenz et al. (2004) and (Perez et al., 2010) presented the better forecasting performance of satellite cloud image method comparing with NWP methods for specific forecast horizons. The top-down observations methods show a good performance on 30 mins – 6 hours ahead forecasts and have a relatively large coverage comparing with other methods. However, the availability of satellite and error caused by the low resolution of satellite cloud image are the main challenges.
Over the past decade, the accuracy of weather forecasts has been improving significantly. A four-day forecast today is more accurate than a one-day forecast in 1980. Author’s previous research (Du et al., 2016) (Du et al.,
2017a) shows that the UK Met Office DataPoint Application Programming Interface (API) provides accurate short-term weather data for the locations in the UK. Besides, UK Met Office’s next 5-day hourly forecasts at 1.5km grid density can be used for predicting building energy demands at both individual building and urban scale (Du et al., 2017b) which considers urban heating island effect. The similar forecast API service providers outside the UK, such as Spanish Met Office (aemet.es), Norway Met Office (met.no), private companies (openweathermap, weatherbit, darksky, wunderground, apixu) are also available to cover over 200,000 locations around the world (Du et al., 2018).
Opportunities using weather APIs
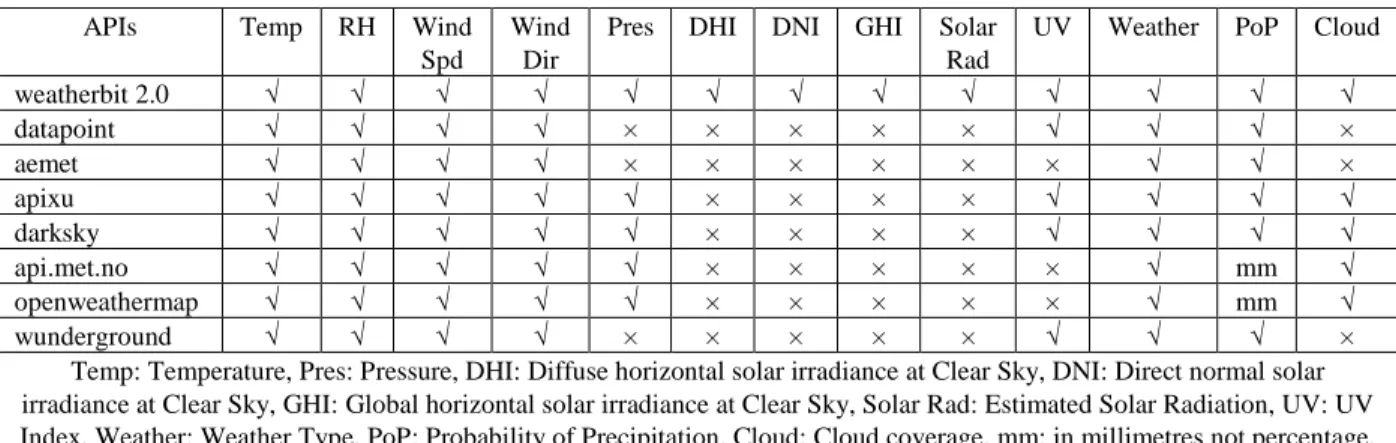
From December 2018, Weatherbit API started offering hourly solar radiation forecasts for the next 48 hours. Table 2 listed the key parameters for building simulation which are available from popular APIs around the world. It shows that Weatherbit is the first and only API provider that offering such service freely available to the public. This paper, therefore, is focused on the application of Weatherbit API to building simulation due to its large-scale application potential and the significances in the most recent update on solar radiation nowcast.
Methodology
To understand the prediction accuracy on indoor temperature and heating load, this work involves three steps:
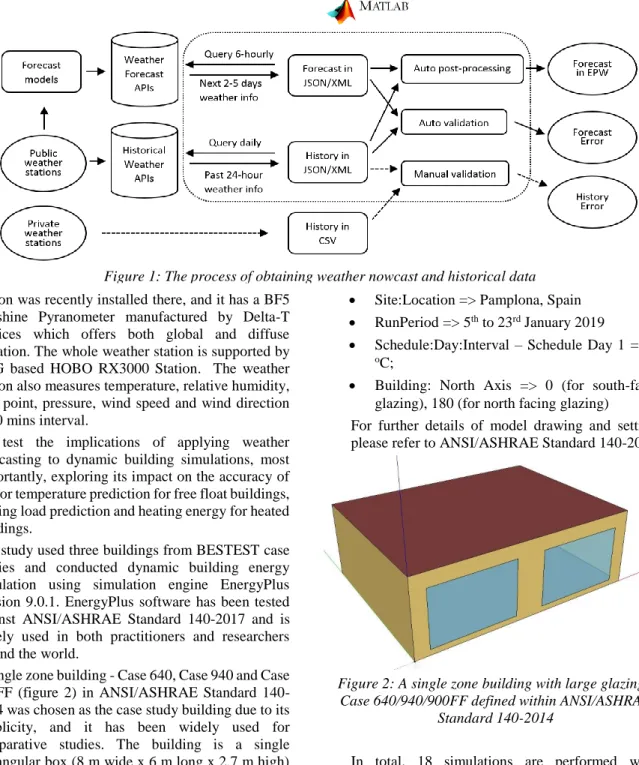
1. Exam the accuracy of weather nowcasting. This includes the comparisons between observed variables from a local weather station, historical weather data from weather API, and nowcasting data from weather API. The process of obtaining rolling latest weather data (both yesterday and next 6-hour) are shown in figure 1. The detailed process of producing weather data has been published in a journal article (Lucas et al., 2019).
To obtain the latest weather data, a programme was developed in Matlab to automatically collect data on 6-hourly frequency from 5th Jan to 23rd Jan 2019 (19
days).
This paper used Pamplona, Spain as the example because a high accuracy calibrated local weather
Table 2: Key parameters for building simulation from different APIs (updated on 5th Jan 2019)
APIs Temp RH Wind
Spd
Wind Dir
Pres DHI DNI GHI Solar
Rad
UV Weather PoP Cloud
weatherbit 2.0 √ √ √ √ √ √ √ √ √ √ √ √ √ datapoint √ √ √ √ × × × × × √ √ √ × aemet √ √ √ √ × × × × × × √ √ × apixu √ √ √ √ √ × × × × √ √ √ √ darksky √ √ √ √ √ × × × × √ √ √ √ api.met.no √ √ √ √ √ × × × × × √ mm √ openweathermap √ √ √ √ √ × × × × × √ mm √ wunderground √ √ √ √ × × × × × √ √ √ ×
Temp: Temperature, Pres: Pressure, DHI: Diffuse horizontal solar irradiance at Clear Sky, DNI: Direct normal solar irradiance at Clear Sky, GHI: Global horizontal solar irradiance at Clear Sky, Solar Rad: Estimated Solar Radiation, UV: UV Index, Weather: Weather Type, PoP: Probability of Precipitation, Cloud: Cloud coverage, mm: in millimetres not percentage.
station was recently installed there, and it has a BF5 Sunshine Pyranometer manufactured by Delta-T Devices which offers both global and diffuse radiation. The whole weather station is supported by a 3G based HOBO RX3000 Station. The weather station also measures temperature, relative humidity, dew point, pressure, wind speed and wind direction at 10 mins interval.
2. To test the implications of applying weather nowcasting to dynamic building simulations, most importantly, exploring its impact on the accuracy of indoor temperature prediction for free float buildings, heating load prediction and heating energy for heated buildings.
The study used three buildings from BESTEST case studies and conducted dynamic building energy simulation using simulation engine EnergyPlus Version 9.0.1. EnergyPlus software has been tested against ANSI/ASHRAE Standard 140-2017 and is widely used in both practitioners and researchers around the world.
A single zone building - Case 640, Case 940 and Case 900FF (figure 2) in ANSI/ASHRAE Standard 140-2014 was chosen as the case study building due to its simplicity, and it has been widely used for comparative studies. The building is a single rectangular box (8 m wide x 6 m long x 2.7 m high) with no interior partitions and 12 m2 of south-facing
windows. All buildings have walls with U-value of 0.514, roof U-value of 0.318 and floor U-value of 0.039 W/m2K. Case 940 is identical to Case 640
except for high mass walls and floor. Case 900FF is similar to Case 900 except that it is a free float building which means not heating and cooling. The detailed descriptions of the differences are listed in table 3.
Heating and cooling set points were applied in Case 640 and Case 940 to test the energy implications of the heating load. Due to the nature of testing, the following changes have been made in Case 640 and Case 940 models. For Case 900FF, only location and run period were changed.
• Site:Location => Pamplona, Spain • RunPeriod => 5th to 23rd January 2019
• Schedule:Day:Interval – Schedule Day 1 => 22
oC;
• Building: North Axis => 0 (for south-facing glazing), 180 (for north facing glazing)
For further details of model drawing and settings, please refer to ANSI/ASHRAE Standard 140-2014.
Figure 2: A single zone building with large glazing - Case 640/940/900FF defined within ANSI/ASHRAE
Standard 140-2014
In total, 18 simulations are performed within EnergyPlus 9.0.1. They are covering three sets of weather data (local observation from the weather station, historical data from weather API and forecast weather data from API), three case studies (Case 640, 940 and 900FF) and two orientations (south facing and north facing glazing). These simulation results can inform the impact of weather data on indoor temperature and heating load predictions. Two orientations were introduced to investigate the sensitivity of solar heat gain through windows. 3. The indoor temperature simulation results from Case
900FF and heating load simulation results from Case 640/940 were used for comparative studies in the results section. The prediction errors Root Mean
Square Error (RMSE) is used for comparing observation and prediction.
Table 3: Differences in three cases Model Short descriptions
Case 640
Low mass building with the wall made of 12mm plasterboard (950 kg/m3) and 66mm fiberglass
(12 kg/m3), and floor made of 25mm timber (650
kg/m3).
Case 940
Case 940 is identical to Case 640, except that high mass walls are made of 100mm concrete block (1400 kg/m3) and 6.15 mm form insulation
(10 kg/m3), and floor is made of 80mm concrete
slab (1400 kg/m3).
The overall U-value is roughly same as Case 640. Case
900FF
Case 900FF is identical to Case 940, except that there is no mechanical heating or cooling system.
Results and discussion
Comparison of outdoor weather variables
Authors’ previous study (Du et al., 2018) shows that different weather APIs as different accuracy, and accuracy varies depending on the location. For example, the UK Met Office provides an excellent forecast for the UK, whereas, other API providers such as DarkSky or Weatherbit makes the best forecast for Pamplona in Spain. Therefore, it is essential to understand the accuracy of weather prediction before using it for building simulation. As shown in figure 1, the forecast error and historical data error from API are worth to investigate. This section presents the errors for each of the weather variables including temperature, RH, pressure and most importantly solar radiation (both global and diffuse). Figure 3 illustrates three types of outdoor temperatures over the study period 5th – 23rd January 2019. Evidence
shows that prediction (blue line) is close to observation (black line). However, it misses the peaks on 5th and 16th
Jan. Statistical analysis in figure 4 and table 4 shows that the R2 between local observation and forecast is 0.7768
which means 77.68% forecast can be explained by the linear regression model (yellow line). Table 4 also revealed that the historical data from API are very accurate (R2 of 0.9518). This is also evidenced in figure 4
(see the closeness between black and red lines). Both indicate that when the weather station is difficult to set up for this location, historical data from API could be used to replace observation data and it still can maintain a high level of confidence. The results show that the most recent update of weather API includes meaningful solar radiation prediction.
Figure 3: Temperature forecast vs observation.
Figure 4: Comparison of observed and forecasted temperature for Pamplona, Spain.
Table 4: R squared between forecast and observations - temperature
R Squared History from API Forecast from API Local
Observation
0.9518 0.7768
History from API 0.8155
Figures 5-6 show that the forecast and observations for RH and pressure are also in good agreement. Although they are less important for EnergyPlus simulation, they could be useful information to guide the air conditioning operations.
Figure 5: RH forecast vs observation
Figure 6: Pressure forecast vs observation
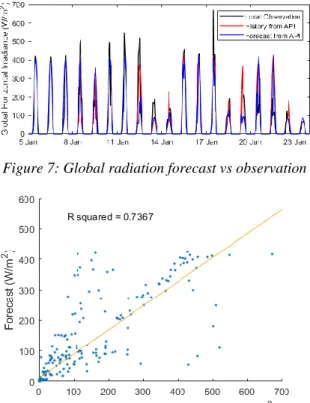
Figures 7-8 show the value and statistical analysis of global solar radiation. Observation during noon is slightly higher than the prediction. The correlation coefficient (R2
of 0.7367) is higher than the method used in the previous study (R2 of 0.66) which was based on the RH regression
model (Du et al., 2017a). Further research in table 5 shows that historical data from API has slightly better R2.
However, the historical solar radiation from API is not as good as the historical temperature from API which has R2
Figure 7: Global radiation forecast vs observation
Figure 8: Comparison of observed and forecasted Global Horizontal Irradiance for Pamplona, Spain. Table 5: R squared between forecast and observations -
Global Horizontal Irradiance
R Squared History from API Forecast from API Local
Observation
0.7700 0.7367
History from API 0.8622
Diffuse forecasts from API are illustrated in figure 9. The regular trend (evidenced in blue line) shows that it could not capture the peak values during noon. Also note that the historical diffuse solar radiations from API is same as the API’s forecasts, therefore red line is overlapped with the blue line.
Figure 9: Diffuse horizontal irradiance forecast vs observation
Comparison of indoor temperature
This section presents the indoor temperature simulation results from Case 900FF including the building with south facing glazing (figure 10) and the building with north facing glazing (figure 11). The solid blue lines show simulation results using observed weather variables, whereas the blue dash lines show simulation results from
predicted weather variables. For comparison purpose, yellow lines illustrate outdoor global radiation. In figure 10 (south facing), the temperature drops when outdoor radiation is not strong enough.
The prediction Root Mean Square Error (RMSE) is used for comparing indoor temperature from observed outdoor weather and indoor temperature from predicted outdoor weather. The RMSE for the building with south facing glazing is significantly higher than the building with north facing glazing (RMSE 0.79 oC). The results show that if
the building does not have a large south facing glazing, the indoor temperature predictions from dynamic models are reasonably accurate. However, if there are large south facing glazing, the RMSE could rise to 2.68 oC. Please
note that although a 2-3 degree of difference is noticeable in the figures, the predicted temperature trend is identical comparing with the simulation using observed data. Therefore, the indicative trend from prediction is still valuable for optimisation and control purpose even for south facing buildings.
Figure 10: Indoor temperature prediction on building with south facing glazing (RMSE=2.68 oC)
Figure 11: Indoor temperature prediction on building with north facing glazing (RMSE=0.79 oC)
Comparison of heating load
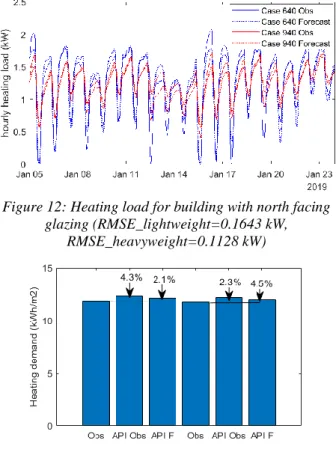
For the building with north facing glazing, the heating load results from both lightweight and heavyweight buildings are shown in figure 12. Solid lines show simulation results using observed weather variables, and the dot lines show simulation results from predicted weather variables. The predicted heating profile is similar to heating profile from observed weather data (with very like RMSE values).
In term of heating energy demand over the study period (5th to 23rd January 2019), the difference between
prediction and observation is 4.5% for the heavyweight north facing building, and 2.1% for the lightweight north facing building (figure 13). For a heavyweight building
with south facing glazing, the difference could be up to 13.7%.
Figure 12: Heating load for building with north facing glazing (RMSE_lightweight=0.1643 kW,
RMSE_heavyweight=0.1128 kW)
Figure 13: Heating energy demand for building with north facing glazing (19 days, 5-23 Jan 2019)
Conclusion
The paper demonstrated the use of the latest weather forecast API (including solar radiation nowcasting) for building simulation and indoor temperature and heating load prediction.
The results show that the most recent update of weather API does include a meaningful short-term prediction for global solar radiation. For the building without large south facing glazing, the indoor temperature and heating load predictions from dynamic models are reasonably accurate (RMSE=0.79 oC for indoor temperature and RMSE
=0.1643 kW for lightweight building heating load). For the building with large south facing glazing, the development of more accurate solar radiation nowcasting methods is needed, particularly for diffuse horizontal irradiance. The current weather API offers diffuse horizontal irradiance under clear sky condition. This could be adjusted according to cloud cover prediction. Authors expect to continue the monitoring and plan to exam the solar radiation forecast’s impact on cooling load and indoor temperature in summer 2019.
This manuscript is part of ongoing work to develop nowcasting methods for solar radiations including both diffuse and direct. Authors are in the process to validate and enhance the low-cost nowcasting methods developed through the European Union's Seventh Programme DNIcast project (€3m, 2013-2017) and the INTEGRATE
project funded by the United State Department of Energy ($6.5m, 2014-2017). More results are expected to be published in a journal paper.
Acknowledgement
This research has received funding from the Welsh Government's Sêr Cymru (Stars Wales) fellowship programme and the European Union´s Horizon 2020 research and innovation programme under grant agreement No 768735. The authors thankfully acknowledge weather data provided by www.weatherbit.io/api.
References
Antonanzas, J., Osorio, N., Escobar, R., Urraca, R., Martinez-De-Pison, F. J. & Antonanzas-Torres, F. 2016. Review of photovoltaic power forecasting.
Solar Energy, 136, 78-111.
ASHRAE 2001. ANSI/ASHRAE Standard 140-2001: standard method of test for the evaluation of building energy analysis computer programs. Atlanta: ASHRAE.
Cao, J. & Lin, X. 2008. Application of the diagonal recurrent wavelet neural network to solar irradiation forecast assisted with fuzzy technique. Engineering Applications Of Artificial Intelligence, 21, 1255-1263. Cervantes, M., Krishnaswami, H., Richardson, W. & Vega, R. 2016. Utilization of low cost, sky-imaging technology for irradiance forecasting of distributed solar generation. 2016 IEEE Green Technologies
Conference (GreenTech), Kansas City, MO, 2016, pp.
142-146.
Chen, C., Duan, S., Cai, T. & Liu, B. 2011. Online 24-h solar power forecasting based on weather type classification using artificial neural network. Solar Energy, 85, 2856-2870.
Chu, Y., Li, M., Pedro, H. T. C. & Coimbra, C. F. M. 2015. Real-time prediction intervals for intra-hour dni forecasts. Renewable energy, 83, 234-244.
Corpening, S. L., Reppen, N. D. & Ringlee, R. J. 1973. Experience with weather sensitive load models for short and long-term forecasting. IEEE transactions on
power apparatus and systems, Pas-92, 1966-1972.
Diagne, M., David, M., Lauret, P., Boland, J. & Schmutz, N. 2013. Review of solar irradiance forecasting methods and a proposition for small-scale insular grids. Renewable And Sustainable Energy Reviews, 27, 65-76.
Du, H., Jones, P. & Ng, B. Understanding the reliability of localized near future weather data for building performance prediction in the UK. 2016 IEEE International Smart Cities Conference (ISC2), 12-15 Sept. 2016. 1-4.
Du, H., Barclay, M. & Jones, P. Generating high resolution near-future weather forecasts for urban scale building performance modelling. Proceedings of
Building Simulation 2017: 15th Conference of IBPSA, San Francisco, USA, 7-9August, 2017a.
Du, H., Jones, P. & Long, C. A novel approach to predict real-time urban heat island effect and indoor overheating. Passive Low Energy Architecture (PLEA), 3-5 July 2017b.
Du, H., Jones, P., Segarra, E. L. & Bandera, C. F. Development of a rest API for obtaining site-specific historical and near-future weather data in epw forma.
Building Simulation and Optimization 2018, 2018 Emmanuel College, University of Cambridge. Hammer, A., Heinemann, D., Lorenz, E. & Lückehe, B.
1999. Short-term forecasting of solar radiation: a statistical approach using satellite data. Solar Energy, 67, 139-150.
Inman, R. H., Pedro, H. T. C. & Coimbra, C. F. M. 2013. Solar forecasting methods for renewable energy integration. Progress In Energy And Combustion Science, 39, 535-576.
Jiang, H. & Dong, Y. 2016. A nonlinear support vector machine model with hard penalty function based on glowworm swarm optimization for forecasting daily global solar radiation. Energy Conversion And
Management, 126, 991-1002.
Lara-Fanego, V., Ruiz-Arias, J. A., Pozo-Vázquez, D., Santos-Alamillos, F. J. & Tovar-Pescador, J. 2012. Evaluation of the wrf model solar irradiance forecasts in andalusia (southern spain). Solar Energy, 86, 2200-2217.
Lazos, D., Sproul, A. B., & Kay, M. (2014). Optimisation of energy management in commercial buildings with weather forecasting inputs: a review. Renewable And
Sustainable Energy Reviews, 39, 587–603.
Lorenz, E., Hammer, A. & Heinemann, D. Short term forecasting of solar radiation based on satellite data.
Eurosun2004 (ISES Europe Solar Congress), 2004. 841-848.
Lucas S., E., Du, H., Ramos R., G. & Fernández B., C. (2019) Methodology for the Quantification of the Impact of Weather Forecasts in Predictive Simulation Models. Energies 12, 1309.
Marquez, R. & Coimbra, C. F. M. 2013. Intra-hour dni forecasting based on cloud tracking image analysis.
Solar Energy, 91, 327-336.
Mathiesen, P., Collier, C. & Kleissl, J. 2013. A high-resolution, cloud-assimilating numerical weather prediction model for solar irradiance forecasting.
Solar Energy, 92, 47-61.
Mathiesen, P. & Kleissl, J. 2011. Evaluation of numerical weather prediction for intra-day solar forecasting in the continental united states. Solar Energy, 85, 967-977.
Nonnenmacher, L. & Coimbra, C. F. M. 2014. Streamline-based method for intra-day solar
forecasting through remote sensing. Solar Energy, 108, 447-459.
Paoli, C., Voyant, C., Muselli, M. & Nivet, M.-L. 2010. Forecasting of preprocessed daily solar radiation time series using neural networks. Solar Energy, 84, 2146-2160.
Peng, Z., Yu, D., Huang, D., Heiser, J., Yoo, S. & Kalb, P. 2015. 3d cloud detection and tracking system for solar forecast using multiple sky imagers. Solar Energy, 118, 496-519.
Perez, R., Kivalov, S., Schlemmer, J., Hemker, K., Renné, D. & Hoff, T. E. 2010. Validation of short and medium term operational solar radiation forecasts in the US. Solar Energy, 84, 2161-2172.
Renno, C., Petito, F. & Gatto, A. 2016. ANN model for predicting the direct normal irradiance and the global radiation for a solar application to a residential building. Journal Of Cleaner Production, 135, 1298-1316.
Richardson, W., Krishnaswami, H., Vega, R. & Cervantes, M. 2017. A low cost, edge computing, all-sky imager for cloud tracking and intra-hour irradiance forecasting. Sustainability, 9, 482.
Sfetsos, A. & Coonick, A. H. 2000. Univariate and multivariate forecasting of hourly solar radiation with artificial intelligence techniques. Solar Energy, 68, 169-178.
Sharma, V., Yang, D., Walsh, W. & Reindl, T. 2016. Short term solar irradiance forecasting using a mixed wavelet neural network. Renewable Energy, 90, 481-492.
US Department Of Energy 2016. Energplus energy simulation software.
Willy. M et al., 2018, "Short-term forecasting for solar irradiation based on the multi-layer neural network with the Levenberg-Marquardt algorithm and meteorological data: application to the Gandon site in Senegal," 2018 7th ICRERA, Paris, 2018, pp. 869-874. Yang, D., Jirutitijaroen, P. & Walsh, W. M. 2012. Hourly solar irradiance time series forecasting using cloud cover index. Solar Energy, 86, 3531-3543.
Yang, D., Kleissl, J., Gueymard, C. A., Pedro, H. T. C. & Coimbra, C. F. M. 2018. History and trends in solar irradiance and pv power forecasting: a preliminary assessment and review using text mining. Solar Energy, 168, 60-101.
Yang, H. & Kleissl, J. 2016. Preprocessing WRF initial conditions for coastal stratocumulus forecasting.
Solar Energy, 133, 180-193.
Yang, H., Kurtz, B., Nguyen, D., Urquhart, B., Chow, C. W., Ghonima, M. & Kleissl, J. 2014. Solar irradiance forecasting using a ground-based sky imager developed at UC San Diego. Solar energy, 103, 502-524