THE USE OF DATA MINING FOR
PREDICTION OF CUSTOMER LOYALTY
Andri Wijaya
1and Abba Suganda Girsang
2Master of Information Technology, Binus Graduate Programs, Bina Nusantara University Jakarta 11480, Indonesia
Email:1[email protected],2[email protected]
Abstract—This article discusses the analysis of cus-tomer loyalty using three data mining methods: C4.5, Naive Bayes, and Nearest Neighbor Algorithms and real-world empirical data. The data contain ten attributes related to the customer loyalty and are obtained from a national multimedia company in Indonesia. The dataset contains 2269 records. The study also evaluates the effects of the size of the training data to the accuracy of the classification. The results suggest that C4.5 algorithm produces highest classification accuracy at the order of 81% followed by the methods of Naive Bayes 76% and Nearest Neighbor 55%. In addition, the numerical evaluation also suggests that the proportion of 80% is optimal for the training set.
Keywords: Customer loyalty; Attribute analysis; C4.5; Naiv¨e Bayes; Nearest Neighbor Algorithm
I. INTRODUCTION
For business entities, it is important to be able to predict the amount of income they may obtain from their active customers. For this purpose, they need models that capable of identifying whether the customer loyal or disloyal to the company and to predict the number of customers who will leave the company and turn to its competitors.
The cost associated with customer acquisition is usually higher than the cost associated with customer retention. The prediction on customer loyalty can be directed to identify customers who will turn to any of its customer competitors. This capability is essential, particularly, for modern telecommunication operator. So far, the main approach to predict individual cus-tomer loyalty is by using the predictive model as demonstrated by Ref. [1].
Another body of work related to the customer loyalty prediction was Ref. [2]. It was focused on multimedia-on-demand (MOD) customers. MOD is an interactive system to provide values and add services on TV services. The reference used data mining technique. Reference [3] utilized discriminant analysis, decision
Received: May 07, 2016; received in revised form: May 16, 2016; accepted: May 20, 2016; available online: May 31, 2016.
tree, and neural network for predicting the customer feasibility of paying their services.
This study proposes a customer loyalty predictive model and evaluates the use of three data mining algorithms: C4.5, Naive Bayes, and Nearest Neighbor algorithms. The study utilizes a dataset obtained from a national-level multimedia company residing in Jakarta, Indonesia. The dataset consists of 2269 data with nine attributes. This study also considers the importance of each attribute to the prediction accuracy.
II. RESEARCH METHOD
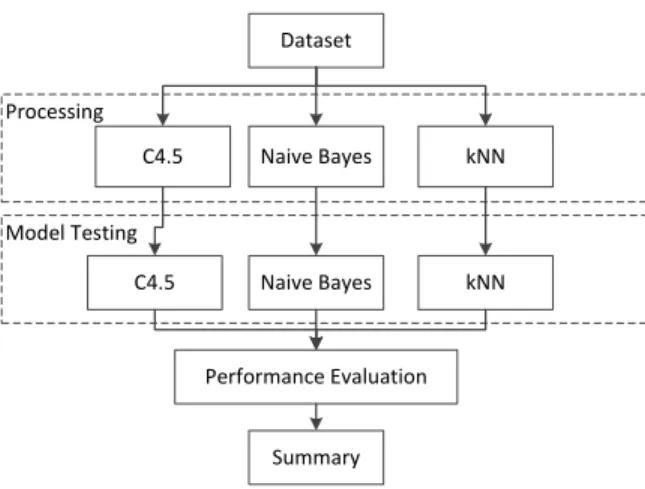
The current research procedure was shown in Fig. 1. The first stage was the data collection in which the data that would be used were collected a multimedia com-pany. The second stage was preprocessing including the deletion of the empty and incomplete data. The third stage was testing by using the C4.5, Naive Bayes and Nearest Neighbor algorithms. The fourth stage was the result evaluations using a confusion matrix. The fifth stage showed which attributes that affect and which do not affect the data mining processes in the prediction of customer loyalty. The evaluated attributes are tabulated in Table I. The last stage was a comparison on the accuracy of the results from those three algorithms, attributes evaluation and dataset portions that have been used.
A. Data Mining
Data mining is defined as the process of finding patterns in data and is automatic or (usually) semi-automatic [4]. Data are always supposed to be in in large size. Data mining is the process of finding meaningful new correlations, patterns, and trends by sifting through large amounts of data stored in the repository, using the technology of reasoning patterns and techniques of statistical and mathematical [5].
The term data mining has the nature of a discipline whose primary goal is to discover, explore, or mine the knowledge of the data or information [6]. For the
TABLE I
THETENEVALUATEDATTRIBUTES.
No Attribute Content Information
1 discon-nect reason
switch, temporary, not interest, price, move, trial & service
The reason customers stop.
2 product Internet, tv, cable & combo
The products are used by customer.
3 Transfer call Transfer & no transfer Indicator of customers who took the initiative to contact the center.
4 disc service DisconnectTV, Dicon-nectNet, Disconnect-Combo
The service will be stopped, it stops the whol subsectiption (disconnect combo) or stop the TV or stop the internet.
5 rate x Customer billing.
6 aging 0, . . . ,4 Customer debt measured in months.
7 balance n The balance of the customer settles.
8 cust age n The duration of a subscription measured in month.
9 ever disc 1, 2 An indicator of whether the customer disconnect ever before (1 meaning never stops, 2 means never).
10 retain loyalty No, Loyal Customer who successfully retained the loyal customers “LOYAL”, and customers who fail to maintain loyal customer “NO”.
purpose of classification, data mining is a method of learning the data to predict the value of a group of attributes. The classification algorithm will produce a set of rules for predicting the class of the data [7].
B. C4.5 Algorithm
C4.5 algorithm is a suitable algorithm for classifica-tion problems in machine learning and data mining [8]. In the decision tree, the node in the center of the attributes of the data being tested (tuple), the branch is the result of the test attributes, and the leaves are formed class [9].
C. Naiv¨e Bayes Algorithm
Naiv¨e words, which seem condescending, derived from the assumption of independence of the influence of the value of an attribute of the class probalilitas given against the value of other attributes Refs. [5, 10].
D. Nearest Neighbor Method
Reference [11] utilized the nearest neighbor ap-proach to find cases by calculating the closeness be-tween the new cases with old cases, which is based on matching the weight of a number of existing features.
E. Confusion Matrix
In the domain of machine learning, a confusion matrix is a tabular representation that provides a
vi-sualization of the performance of classification algo-rithms [12]. It is mathematically written:
Accuracy = TP + TN
TN + FN + TP + FP, (1) where TP denotes the number of positive instances categorized as positive, FP denotes the number of negative instances categorized as positive,FNdenotes the number of positive instances categorized as nega-tive, andTNdenotes the number of negative instances categorized as negative.
F. Customer Loyalty
Behavior disloyal customers who left the company became one of the company’s revenue loss [13]. With more and more ISPs, therefore the competition is getting tougher and customers are demanding more rights, and frequently switching ISP [14].
G. Cross-Industry Standard Process for Data Mining
Cross-Industry Standard Process for Data Mining (CRISP-DM) is a standard that has been developed in 1996 with a purpose to make the process of analysis of an industry as a problem-solving strategy of the business or research unit [15]. For data that can be processed by the CRISP-DM, there are no provisions or particular characteristics, because the data will be processed back to the phases inside. There are six
phases in CRISP-DM described in Figure 2, and the explanations of the stages are described of the follow-ing.
1) Business Understanding Phase: Data for this study were collected from one of service companies engaged in cable TV and internet in Indonesia. The data that would be studied are about the customers who request to unsubscribe to the services. The purpose of this research is to predict the loyal customers that should be preserved. The data used were taken from an application that records complaints and unsubscribe requests from the customers.
2) Data Understanding: Data Understanding is a phase in which data were collected and studied with the purpose to recognize and to identify the data. This phase discussed the data that would be used for data mining processes. In accordance with what was mentioned in the previous phase, the data used were the data of customers who requested to unsubscribe to the services. In the current study, the data consist of
Start Collect Data Testing of C4.5 Testing of Naïve Bayes Preprocessing C4.5 test result Naïve Bayes test result
Comparison: Algorithms, Evaluation attributes, the portion of the dataset.
End Testing of Nearest Neighbor Nearest Neighbor test result C4.5 Evalution atribut NB Evaluation atribut NN Evaluation atribut
Fig. 1. Research Framework.
2269 records in comma-separated-values (csv) format.
3) Data Preparation Phase: In data mining, the incomplete, inconsistent, and unorderly attributes could not be processed systematically by the data mining algorithms. Therefore, it was necessary to conduct validation process in order to find and convert the data so that it could be used in data mining algorithms. In the dataset that would be used, the validation of the data that would be used was by eliminating the incomplete data. In the data validation phase, the customers data was incomplete because the customers had already unsubscribed. The incomplete data would be eliminated so that would not interfere with the accuracy of the data processing later. The very large data of subscription products would also be narrowed down to the main products that are internet, cable TV or combo to make it easier to apply some of the algorithms. The duration of the customers would be converted into months.
The classification of the attributes’ values was also done on the reason that the customers request to un-subscribe would be diverse, so that would be classified into the following categories:
• Switch: move to other company, • Temporary: temporary unsubscribe,
• Not Interest: not interested or will not use the
services anymore,
• Price: too expensive,
• Move: the customers had moved to other
domi-cile,
• Trial: only trial and are not satisfied, and • Service: the service is less satisfactory.
Fig. 3. The Data Processing Process.
TABLE II
PORTIONS OFDATA FORTRAINING ANDTESTINGPHASES.
Scenario Portion of Data Training Phase Testing Phase
1 90 10
2 80 20
3 70 30
4 60 40
4) Modelling Phase: Each algorithm modeling was done by using 2269 records, in which used a predeter-mined algorithm. It was done by referring to a form of data and objectives / outcomes that would be achieved from the application of data mining, which was to measure customer loyalty, which could be described in Fig. 3.
In Figure 3, it explained that it was starting with dataset, then the dataset 2269 records were separated for the training and testing phases following the pro-portions listed in Table II.
In Table II, it explained that this research would attempt to determine the optimum size for the training data. Next, the testing of C4.5, Naiv¨e Bayes and Near-est Neighbor algorithms. At this Near-establishment of the modeling with training data and testing data there were also several experiments performed by eliminating the attributes used to determine which significant attributes that affected the value of the resulted performance evaluation, that later would produce a performance evaluation in the form of confusion matrix and AUC ta-bles. Then on those three used algorithms performance evaluation results were compared, then it would draw the conclusions from this comparison
5) Evaluation Phase: The research that will be conducted in this experiment is to use a computer to perform the calculation of the proposed model. The process of experiment and testing models used a part of the existing dataset. All datasets were then tested by the method proposed in the application AGPL-licensed Rapid miner 7 Open source (GNU Affero General Public License) version 3. The first ranked data mining software in the poll by KDnuggets, a data-mining portal in 2010-2011. On the website http://www.siliconafrica.com/the-best-data-minning-tools-you-can-use-for-free-in-your-company/, it is written that RapidMiner is in the first rank as the best and widely-used free data mining tool in various companies. The specification of the computer used is shown in Table III. In this phase, there were some
TABLE III
SPECIFICATION OF THECOMPUTER.
Processor Intel Core i3
Memory 2 GB
Hardisk 750 GB
OS Microsoft Windows 7
Application Rapid Miner7
tests on the models that have a purpose to get the most accurate models. Evaluation and validation were conducted by using the confusion matrix and the receiver operating characteristic (ROC) curve.
6) Deployment Phase: In this deployment phase, it will make a report on the results of the overall data mining activities conducted. This report will contain the obtained knowledge or the recognition of the patterns on the data that has been processed with data mining.
III. RESULTS AND DISCUSSION In this section, we discuss the analysis results using the methods of C4.5 (Section III-A), Na¨ıve Bayes (Section III-B), andk-Nearest Neighbor (Section III-C) algorithms. In addition, we also study the effects of the training-data size to the accuracy.
A. Using C4.5 Algorithm
In this research, the analysis was conducted by using algorithm C4.5 by conducting some experiments with the determination on the portions of the training data and testing data from the dataset used. This research will also conduct the experiment to eliminate the at-tributes that will be used in the conducted data mining processes, to determine which attributes that are really significant in affecting the results of the performance
TABLE IV
THEANALYSISRESULTS USINGC4.5 ALGORITHM USING
60–90% PROPORTIONS OFDATA FORTRAINING. ‘ALL−
aging’DENOTES THE ANALYSIS INVOLVING ALL ATTRIBUTES EXCEPTagingATTRIBUTE. SIMILAR CONSENSUS IS ADOPTED
FOR THE REMAINDER OF THE ROWS.
No Atributte Accuracy Precision Recall Training using 90% Proportions of the Data.
1 All 0.81 0.77 0.89 2 All−aging 0.78 0.76 0.85 3 All−balance 0.81 0.77 0.89 4 All−cust_age 0.81 0.76 0.92 5 All−disconnect_reason 0.52 0.52 1.00 6 All−disc_service 0.80 0.77 0.87 7 All−ever_disc 0.81 0.77 0.89 8 All−product 0.69 0.63 0.96 9 All−rate 0.79 0.75 0.89 10 All−transfer_call 0.81 0.77 0.89
Training using 80% Proportions of the Data.
1 All 0.81 0.76 0.93 2 All−aging 0.80 0.76 0.92 3 All−balance 0.81 0.76 0.93 4 All−cust_age 0.81 0.76 0.93 5 All−disconnect_reason 0.53 0.53 1.00 6 All−disc_service 0.81 0.76 0.92 7 All−ever_disc 0.81 0.76 0.93 8 All−product 0.79 0.73 0.95 9 All−rate 0.81 0.76 0.93 10 All−transfer_call 0.81 0.76 0.93
Training using 70% Proportions of the Data.
1 All 0.77 0.76 0.85 2 All−aging 0.75 0.75 0.80 3 All−balance 0.77 0.77 0.82 4 All−cust_age 0.77 0.74 0.87 5 All−disconnect_reason 0.53 0.53 1.00 6 All−disc_service 0.77 0.77 0.84 7 All−ever_disc 0.77 0.76 0.85 8 All−product 0.74 0.77 0.73 9 All−rate 0.79 0.75 0.91 10 All−transfer_call 0.80 0.76 0.91
Training using 60% Proportions of the Data.
1 All 0.76 0.72 0.90 2 All−aging 0.75 0.71 0.86 3 All−balance 0.78 0.72 0.93 4 All−cust_age 0.77 0.72 0.91 5 All−disconnect_reason 0.52 0.52 1.00 6 All−disc_service 0.77 0.73 0.90 7 All−ever_disc 0.76 0.72 0.90 8 All−product 0.78 0.72 0.94 9 All−rate 0.77 0.72 0.92 10 All−transfer_call 0.77 0.72 0.93
evaluation, which later will be explained in Section IV.
B. Na¨ıve Bayes Algorithm
In this research, the analysis was conducted by using algorithm Nave Bayes by conducting some ex-periments with the determination on the portions of the training data and testing data from the dataset used. This research will also conduct the experiment to eliminate the attributes that will be used in the conducted data mining processes, to determine which attributes that are really significant in affecting the results of the performance evaluation, which later can be explained in the following sub-chapter.
TABLE V
THEANALYSISRESULTS USINGNA¨IVEBAYESALGORITHM USING60–90% PROPORTION OFDATA FORTRAINING. ‘ALL−
aging’DENOTES THE ANALYSIS INVOLVING ALL ATTRIBUTES EXCEPTagingATTRIBUTE. SIMILAR CONSENSUS IS ADOPTED
FOR THE REMAINDER OF THE ROWS.
No Atributte Accuracy Precision Recall Trainign using 90% Proportions of the Data.
1 All 0.76 0.71 0.91 2 All−aging 0.73 0.68 0.92 3 All−balance 0.75 0.71 0.87 4 All−cust_age 0.76 0.71 0.90 5 All−disconnect_reason 0.70 0.66 0.84 6 All−disc_service 0.77 0.71 0.93 7 All−ever_disc 0.77 0.71 0.93 8 All−product 0.75 0.70 0.92 9 All−rate 0.77 0.71 0.92 10 All−transfer_call 0.76 0.70 0.93
Trainign using 80% Proportions of the Data.
1 All 0.76 0.71 92 2 All−aging 0.75 0.69 94 3 All−balance 0.78 0.75 87 4 All−cust_age 0.76 0.70 94 5 All−disconnect_reason 0.67 0.66 78 6 All−disc_service 0.75 0.69 93 7 All−ever_disc 0.76 0.71 92 8 All−product 0.74 0.69 93 9 All−rate 0.76 0.71 92 10 All−transfer_call 0.75 0.70 92
Trainign using 70% Proportions of the Data.
1 All 0.75 0.72 0.90 2 All−aging 0.74 0.71 0.87 3 All−balance 0.75 0.75 0.80 4 All−cust_age 0.76 0.73 0.89 5 All−disconnect_reason 0.63 0.65 0.68 6 All−disc_service 0.74 0.69 0.94 7 All−ever_disc 0.75 0.71 0.90 8 All−product 0.74 0.69 0.94 9 All−rate 0.76 0.71 0.91 10 All−transfer_call 0.74 0.71 0.88
Trainign using 60% Proportions of the Data.
1 All 0.75 0.70 0.91 2 All−aging 0.73 0.69 0.89 3 All−balance 0.74 0.72 0.83 4 All−cust_age 0.75 0.71 0.88 5 All−disconnect_reason 0.59 0.59 0.68 6 All−disc_service 0.74 0.68 0.95 7 All−ever_disc 0.75 0.69 0.92 8 All−product 0.74 0.68 0.95 9 All−rate 0.74 0.69 0.91 10 All−transfer_call 0.74 0.69 0.90
In scenario 1 of the research conducted experiments of eliminating the attributes in the dataset processing with a portion of training data of 80% and testing data of 20%, with the Nave Bayes algorithm to compare whether the attributes used affected the performance evalution or not, that can be seen in Table V.
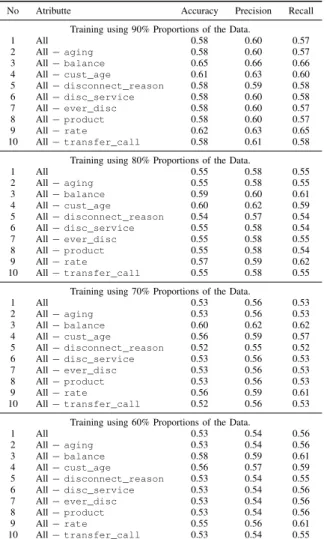
C. Nearest Neighbor Algorithm
The classification results usingk-Nearest Neighbor algorithm for the proportion of training data of 60% to 90% are shown in Table VI. Generally, the results suggest that the size of the training data are not significantly affect the accuracy.
TABLE VI
THEANALYSISRESULTS USINGNEARESTNEIGHBOR
ALGORITHM FOR60–90% PROPORTION OFDATA FOR
TRAINING. ‘ALL−aging’DENOTES THE ANALYSIS INVOLVING
ALL ATTRIBUTES EXCEPTagingATTRIBUTE. SIMILAR CONSENSUS IS ADOPTED FOR THE REMAINDER OF THE ROWS.
No Atributte Accuracy Precision Recall Training using 90% Proportions of the Data.
1 All 0.58 0.60 0.57 2 All−aging 0.58 0.60 0.57 3 All−balance 0.65 0.66 0.66 4 All−cust_age 0.61 0.63 0.60 5 All−disconnect_reason 0.58 0.59 0.58 6 All−disc_service 0.58 0.60 0.58 7 All−ever_disc 0.58 0.60 0.57 8 All−product 0.58 0.60 0.57 9 All−rate 0.62 0.63 0.65 10 All−transfer_call 0.58 0.61 0.58
Training using 80% Proportions of the Data.
1 All 0.55 0.58 0.55 2 All−aging 0.55 0.58 0.55 3 All−balance 0.59 0.60 0.61 4 All−cust_age 0.60 0.62 0.59 5 All−disconnect_reason 0.54 0.57 0.54 6 All−disc_service 0.55 0.58 0.54 7 All−ever_disc 0.55 0.58 0.55 8 All−product 0.55 0.58 0.54 9 All−rate 0.57 0.59 0.62 10 All−transfer_call 0.55 0.58 0.55
Training using 70% Proportions of the Data.
1 All 0.53 0.56 0.53 2 All−aging 0.53 0.56 0.53 3 All−balance 0.60 0.62 0.62 4 All−cust_age 0.56 0.59 0.57 5 All−disconnect_reason 0.52 0.55 0.52 6 All−disc_service 0.53 0.56 0.53 7 All−ever_disc 0.53 0.56 0.53 8 All−product 0.53 0.56 0.53 9 All−rate 0.56 0.59 0.61 10 All−transfer_call 0.52 0.56 0.53
Training using 60% Proportions of the Data.
1 All 0.53 0.54 0.56 2 All−aging 0.53 0.54 0.56 3 All−balance 0.58 0.59 0.61 4 All−cust_age 0.56 0.57 0.59 5 All−disconnect_reason 0.53 0.54 0.55 6 All−disc_service 0.53 0.54 0.56 7 All−ever_disc 0.53 0.54 0.56 8 All−product 0.53 0.54 0.56 9 All−rate 0.55 0.56 0.61 10 All−transfer_call 0.53 0.54 0.55
D. Comparison of the Accuracy of the Three Methods
The comparison of the classification accuracy of the three methods is shown in Table VII. The table only shows the results of analysis using all attributes. The data size for training is varied from 60% to 90%. The results indicate that C4.5 algorithm provides the highest classification accuracy, and respectively followed by the Na¨ıve Bayes and Nearest Neighbor algorithms. The table also suggests that the amount of 1800 records of training data, about 80%, is sufficient to provide a reliable model.
IV. CONCLUSIONS
Importance of the mathematical/computational model to predict the customer level of loyality for
TABLE VII
COMPARISON OF THEACCURACIES OF THETHREEMETHODS. No Portion of the Data Accuracy (%)
C4.5 Nai¨ve Bayes Nearest Neighbor 1 90% data training, 10% data testing 0.81 0.76 0.58 2 80% data training, 20% data testing 0.81 0.76 0.55 3 70% data training, 30% data testing 0.77 0.75 0.53 4 60% data training, 40% data testing 0.76 0.75 0.53
business is not disputable. Such model would allow company to better predict the future revenue of their line of businesses. With the proliferation of information technology and databases in businesses, ample amount of related data can be established easily and quickly. Within this perspective, data mining offers a practical approach to establish the predictive model. In this work, such approach is demonstrated using empirical data collected from an Indonesia national-level multimedia company. The results suggest that the predictive model having rather high predictive accuracy can be established using the C4.5 algorithm. The numerical assessment revealed that the algorithm could reach 80% of the accuracy level. It also showed that the accuracy was affected by the size of the training dataset. Despite of this, using at least 1800 records for training, the dependecy of the accuracy on the size seems to be rather less relevant.
REFERENCES
[1] Y. Richter, E. Yom-Tov, and N. Slonim, “Predict-ing customer churn in mobile networks through analysis of social groups.” inProceedings of the 2010 SIAM International Conference on Data Mining, vol. 2010. SIAM, 2010, pp. 732–741. [2] C.-F. Tsai and M.-Y. Chen, “Variable selection by
association rules for customer churn prediction of multimedia on demand,”Expert Systems with Applications, vol. 37, no. 3, pp. 2006–2015, 2010. [3] S. Daskalaki, I. Kopanas, M. Goudara, and N. Avouris, “Data mining for decision support on customer insolvency in telecommunications business,”European Journal of Operational Re-search, vol. 145, no. 2, pp. 239–255, 2003. [4] I. H. Witten and E. Frank,Data Mining: Practical
machine learning tools and techniques. Morgan Kaufmann, 2005.
[5] D. T. Larose, An introduction to data mining, 2005, vol. 2.
[6] S. Susanto and D. Suryadi, Pengantar Data Mining: Menggali Pengetahuan dari Bongkahan Data. Andi Publisher, 2010.
[7] V. Carlo,Business intelligence: data mining and optimization for decision making. John Wiley and Sons, 2009.
[8] X. Wu, V. Kumar, J. R. Quinlan, J. Ghosh, Q. Yang, H. Motoda, G. J. McLachlan, A. Ng, B. Liu, S. Y. Philip et al., “Top 10 algorithms in data mining,”Knowledge and information sys-tems, vol. 14, no. 1, pp. 1–37, 2008.
[9] J. Han, J. Pei, and M. Kamber, Data mining: concepts and techniques. Elsevier, 2011. [10] M. Bramer,Principles of data mining. Springer,
2007, vol. 180.
[11] Kusrini and E. Taufiq, Algoritma Data Mining. Andi Offset, 2009.
[12] S. Ghosh, S. Biswas, D. Sarkar, and P. P. Sarkar, “A tutorial on different classification techniques
for remotely sensed imagery datasets.”Smart CR, vol. 4, pp. 34–43, 2014.
[13] R. J. Jadhav and U. T. Pawar, “Churn prediction in telecommunication using data mining technol-ogy,” International Journal of Advanced Com-puter Science and Applications, vol. 2, no. 2, pp. 17–19, 2011.
[14] A. A. Khan, S. Jamwal, and M. Sepehri, “Ap-plying data mining to customer churn prediction in an internet service provider,” International Journal of Computer Applications, vol. 9, no. 7, pp. 8–14, 2010.
[15] P. Chapman, J. Clinton, R. Kerber, T. Khabaza, T. Reinartz, C. Shearer, and R. Wirth, “Crisp-dm 1.0 step-by-step data mining guide,” The CRISP-DM consortium, Tech. Rep., Aug. 2000. [Online]. Available:
![Fig. 2. Cross Standard Industries Process for Data Mining [15].](https://thumb-us.123doks.com/thumbv2/123dok_us/489530.2557966/3.894.145.472.555.1067/fig-cross-standard-industries-process-data-mining.webp)