Network Attack Detection using an Unsupervised Machine Learning
Algorithm
Avinash Kumar
Cyber Forensics Intelligence Center Dept of Computer Science Sam Houston State University
William Bradley Glisson Cyber Forensics Intelligence Center
Dept of Computer Science Sam Houston State University
Ryan Benton Dept of Computer Science
School of Computing University of South Alabama
Abstract
With the increase in network connectivity in today's web-enabled environments, there is an escalation in cyber-related crimes. This increase in illicit activity prompts organizations to address network security risk issues by attempting to detect malicious activity. This research investigates the application of a MeanShift algorithm to detect an attack on a network. The algorithm is validated against the KDD 99 dataset and presents an accuracy of 81.2% and detection rate of 79.1%. The contribution of this research is two-fold. First, it provides an initial application of a MeanShift algorithm on a network traffic dataset to detect an attack. Second, it provides the foundation for future research involving the application of MeanShift algorithm in the area of network attack detection.
1. Introduction
Globally, the number of internet users continues to increase and is reaching new highs in various areas, such as social media, online banking, and online streaming [1]. The rise in internet users appears to correlate with an escalation in cyber-crimes, which creates a risk for the organization’s information security [2]. Detecting and responding to security incidents interest both industry and academicians [3-6]. According to a report by Forrester’s, government, retail, and technology industries constituted 95% of the breached records in 2016, which included personal identifying information [7].
A study conducted by SecurityScorecard, a security rating company, indicates that over 75% of the healthcare industry was affected by malware attacks putting infrastructures at risk [8]. Yahoo announced that 500 million user's account information which includes names, date of births, email addresses, phone numbers,
security questions, and encrypted passwords were stolen by the hackers [9].
Research by Juniper predicts that by the year 2023, over 146 billion records will be stolen by cybercriminals [10]. Identity theft statistics by Javelin Strategy and Research shows that nearly 15 million Americans were affected in 2017 [11]. In 2017, Equifax confirmed that the identification information of 147.9 million U.S. consumers was stolen by the attackers [12]. Coupling this with Ponemon Institute’s report indicating that the average cost of a data breach is rising exponentially, stresses the need for companies to be able to detect data breaches [13]. This study estimated that the cost of a data breach to a US company is around $7.91 million and that it takes 196 days on an average to identify any data breach. Research by Positive Technologies suggested that the number of unique cyber incidents rose by 47 percent in the second quarter of 2018 when compared to the second quarter of 2017 [10]. It is estimated, that by 2022, security breaches will exceed over $8 trillion in fines to the businesses [2].
According to a study by Bromium [14], the annual revenue of the cybercrime economy exceeds 1.5 trillion dollars. This is a large incentive for attackers to find ways to breach an organization’s network; these breaches can range from malicious activity to policy violations [15]. As a countermeasure, intrusion detection systems have been designed and deployed to raise alarms if any malicious activity is detected. One drawback is that while Intrusion Detection Systems (IDS) are often effective in detecting known attacks, unknown attacks may go unidentified [16]. To increase the ability to handle unknown attacks, IDSs have typically had anomaly mechanisms to detect new attacks. However, these mechanisms can generate false positives, where legitimate operations are treated as an attack [17].
This environment prompts the hypothesis that the application of a MeanShift algorithm can help to detect an attack in an offline network traffic dataset. In order Proceedings of the 53rd Hawaii International Conference on System Sciences | 2020
to address this hypothesis, the following research questions are derived:
1. Can the MeanShift algorithm detect an attack in an offline network traffic dataset?
2. What is the MeanShift algorithm detection rate? 3. What is the MeanShift algorithm accuracy rate? The remaining of the paper is organized as follows. Section two presents relevant research in the field of network forensics analysis. Section three describes the research methodology. Section four discusses the result and findings. Section five draws conclusions, and section six proposes future research.
2. Literature Review
Intrusion detection systems collect network traffic and store it in a repository which can be further used for network forensic analysis [18]. Network forensics systems are designed to analyze large volumes of network traffic data, which includes log files from sources like routers, servers, and switches [19]. There are various operational and cost overheads associated with these systems [20]. From an operational perspective, human intervention is required at each and every step. Operational cost is also visible from a data storage viewpoint; log files can become very difficult to manage as volume increases. Increased storage requirements introduce additional cost as this prompts the need for organizations to acquire additional storage and processing resources.
Gogoi et al. [21] performed a literature analysis investigating various existing machine learning approaches and the ability to detect attacks in network traffic data using unsupervised and supervised learning approaches. Their analysis indicates that unsupervised learning has a higher detection rate than supervised learning; however, the results of their analysis indicates that they are prone to a high false-positive rate.
Mukkamala et al. [22] apply an artificial intelligence technique that involves the Artificial Neural Network (ANN) and the Support Vector Machine (SVM) algorithms to detect a network traffic attack. Both SVM and ANN achieved accuracies better than 99%. The SVM had slightly higher performance, although not statistically significant. However, the SVM was significantly faster than the ANN. For training the SVM training took 52 seconds to 211 seconds versus the ANN requiring 30 minutes to 38 minutes For testing, the SVM took 1 second to 16 seconds while the ANN again took over 30 minutes. In addition to comparing the performance of the SVMs and ANNs , they ranked the input features by applying feature selection approach. The authors argue that the ranking of input features helps to eliminate insignificant inputs, which further
simplifies the problem and results in similar detection accuracy.
Peddabachigari et al. [23] implement Support Vector Machine (SVM) and Decision Trees algorithms for intrusion detection. The authors propose a hybrid intrusion detection model (DT-SVM), where the SVM augmented the input data with the predictions of the DT. They also propose an ensemble approach using Decision Tree, SVM, and DT-SVM. Their experimental result indicates that the Decision Trees has a better or equal performance when compared to SVM and DT-SVM; the ensemble method had the best overall results.
Abadeh et al. [24] propose a parallel genetic local search algorithm to detect intrusive behavior. At the same time, it efficiently reduces the false positives in the network intrusion detection system. Their algorithm divides the global population into subpopulations, and each subpopulation is assigned a separate processor. In addition to that, each subpopulation consists of an identical class that is comprised of fuzzy rules where they evolve independently using the proposed algorithm. Their experimental result indicates that the proposed algorithm is able to increase the detection rate to 96.3 percent and reduce the false alarm rate to 0.29 percent in an intrusion detection system.
Zhang et al. [25] propose an approach to handle imbalanced intrusions in a network intrusion detection system by applying the random forest algorithm. Their experiment involved the down sampling of the original dataset by randomly selecting ten percent of Normal and Denial of Service (DOS) classes to make it balanced. They have compared the performance of a random forest algorithm on balanced and original datasets, and the result indicated improvement in reducing the overall error rate from 1.92 percent in the original dataset to 0.05 percent in the balanced dataset.
Lee et al. [26] propose a data mining framework to detect an attack in an intrusion detection system. They have first applied data mining algorithm to compute frequent patterns, extract features, and then applied classifiers on the extracted features to construct a detection model. In addition to that, they have built classification models using different feature sets. The different classification models consist of a time-based traffic model to detect DOS and Probe attacks, a host-based traffic model to detect slow Probe attacks, and a content model to detect R2L and U2R attacks. Their experimental result indicates that the proposed model was able to detect new Probe and U2R attack types which were not there in the training dataset with 96.7 percent and 81.8 percent accuracy.
Patil et al. [27] propose a hybrid model with Fuzzy C-Means clustering and Hidden Markov Model to identify intruder activity. Their approach is based on the assumption that intruder activity patterns will be
different than normal usage patterns. Chandrashekhar et al. [28] propose a hybrid model involving Fuzzy C-Means clustering, Fuzzy Neural network, and Radial Bias Function (RBF) to detect an attack in an intrusion detection system. The proposed model was applied to different types of attacks such as Probe, Denial of Service (DOS), Remote to Local (R2L), and User to Root (U2R) and they found that the model attained 99% accuracy for DOS attack and above 97% for Probe, R2L, and U2R. Eesa [29] applies a combination of feature selection methods based on Cuttlefish Algorithm (CFA) and Decision Tree (DT) as a classifier to detect an attack in intrusion detection systems. Their model’s detection rate is more than 90 percent when the number of features is less than or equal to 20. However, their detection rate is less than 80 percent as the number of features increased to 25.
Li [30] proposed a Genetic Algorithm (GA) for network intrusion detection systems. Their approach uses both spatial and temporal information of network connections that helps in identifying a complex anomaly in a network. They have proposed an architecture to apply a GA into intrusion detection and also addressed the factors affecting the Genetic Algorithm. However, the attack detection rate was not provided. Lisehroodi et al. [31] propose a hybrid learning approach involving an Artificial Neural Network (ANN) Multi-Layer Perceptron (MLP) and K-Means clustering to develop an advanced network intrusion detection system. Their hybrid model has achieved an attack detection rate of 99 percent. Dhanabal et al. [32] perform an analysis of NSL-KDD [33] dataset by applying machine learning classification algorithms such as Naïve Bayes, J48, and Support Vector Machine (SVM). The result of their analysis shows that J48 performed the best among all with a detection rate exceeding 97 percent for all attack types while the Naïve Bayes performed the least with a detection rate around 74 percent.
Ingre et al. [34] apply an Artificial Neural Network (ANN) to the NSL-KDD dataset to measure the performance. Their analysis involved both the binary class and the five-class classification from the dataset. Their approach achieves detection rate exceeding 81 percent and 79 percent for the intrusion detection and attack type classification type. Pajouh et al. [35] propose a two-tier classification model which combines a family of classifiers such as Naïve Bayes, KNN, and Linear Discriminant Analysis to reduce the dimension in the NSL-KDD dataset. Their model achieved low computation time and provided a better detection rate particularly for the close to normal attack types which are hard to detect such as User to Root (U2R) and Remote to Local (R2L).
Ranjan et al. [36] apply K-medoids method of clustering to overcome the limitations of the K-Means
clustering algorithm in an intrusion detection system. The authors have improved the K-Means algorithm implementation by overcoming various disadvantages like centroid dependency and the number of cluster dependency. Their result indicates a detection rate of more than 90 percent; however, according to the authors, the detection rates for Probe and User to Root attack can be further enhanced by applying efficient clustering approaches.
There is ample research applying various machine learning algorithms for offline intrusion detection evaluation. However, minimal academic research takes into consideration the application of MeanShift algorithm for offline intrusion detection evaluation.
3. Methodology
A controlled experiment, as defined by Shadish et al. [37], was utilized to test the hypothesis that a MeanShift algoritm can detect attacks within an offline network traffic dataset. For the purpose of this research, the MeanShift algorithm is applied to the KDD 99 dataset. According to Ozgur et al. [38], this dataset is widely used in machine learning and intrusion detection systems research. Hence the KDD dataset was selected for this research based on the use of the dataset in numerous publications and author access to the dataset.
3.1. KDD 99 Dataset
Stolfo et al. [39] prepared this dataset, which is based on the 1998 DARPA intrusion detection evaluation program. DARPA in agreement with MIT Lincoln Laboratory created this dataset by simulating a U.S. Air Force local area network for the purpose of network intrusion detection evaluation program. This dataset consists of TCP dump data. The local area network was attacked from outside by various attacks. This dataset consists of seven weeks of training data and two weeks of test data. The training dataset consists of 4,895,000 connection records which were processed out of four gigabytes of compressed TCP dump where each connection is 100 bytes. Two weeks of test data consist of 1,998,760 connection records. Here, the connection is defined as the sequence of TCP packets, which flows from source to target IP addresses and vice versa.
The training dataset and test dataset are from different probability distributions. The test dataset has an additional fourteen (14) attack types which are not in the training dataset. Each of the connections consists of forty-one (41) features and is labeled as either normal or a specific attack type. Also, the attributes, which fall into three major groups, are composed of either discrete
or continuous values. The first group contains the features of a network connection such as prototype, service, and duration, number of bytes from target and source IP addresses, and flags. The second group contains the content features of a network connection, and the third group contains the statistical features of network connections.
There are twenty-two (22) different types of attacks in the KDD 99 dataset. These attack types fall into four main categories as follows:
1. Denial of Service Attack (DOS) [40]: It is an attack in which an attacker floods the host machine with superfluous requests which makes it difficult for the host to fulfill a legitimate request.
2. Remote to Local Attack (R2L) [41]: This is an attack in which an attacker tries to access the machine over the internet by sending the packets in order to expose the vulnerabilities to gain local user privilege on that machine. There are various ways such as sendmail, guest, phf, xlock, to achieve this attack.
3. User to Root Attack (U2R) [42]: This attack tries to gain access to the machine as a normal user by performing various techniques such as social engineering, sniffing passwords, or a dictionary attack. Once the attack is successful, attackers typically attempt to gain the root user access. 4. Probing Attack (Probe) [43]: It is an attack in
which an attacker tries to identify the vulnerabilities or weaknesses in a network in order to compromise the network. There are various tools to perform network scan such as Nmap, port sweep, mscan, etc. to expose the network vulnerabilities.
Table 1 provides the list of attack types in the KDD dataset along with their category. Table 2 provides the features available in KDD 99 dataset along with the type of data they can hold.
Table 1: List of attacks by categories Attack Category Types of Attacks
DOS Land, Back, Neptune, Pod,
Smurf, Teardrop
R2L Ftp Write, Guess Passwd,
IMAP, multihop, PHF, Spy, Warezclient, Warezmaster
U2R Perl, Buffer Overflow, Module
Load, Rootkit
Probe Ip-sweep, Nmap, Port Sweep, Satan
A discrete data type can hold only integer values, while continuous data type can hold any numerical values [44]. For example, the number of professors in a university will be discrete because there cannot be half professor. However, a professor’s height will be continuous, i.e., not only certain fixed integer values.
Table 2: List of features and their data type Feature Name Data Type
duration continuous protocol_type discrete service discrete flag discrete src_bytes continuous dst_bytes continuous land discrete wrong_fragment continuous urgent continuous hot continuous num_failed_logins continuous logged_in discrete num_compromised continuous root_shell continuous su_attempted continuous num_root continuous num_file_creations continuous num_shells continuous num_access_files continuous num_outbound_cmds continuous is_host_login discrete is_guest_login discrete count continuous srv_count continuous serror_rate continuous srv_serror_rate continuous rerror_rate continuous srv_rerror_rate continuous same_srv_rate continuous diff_srv_rate continuous srv_diff_host_rate continuous dst_host_count continuous dst_host_srv_count continuous dst_host_same_srv_rate continuous dst_host_diff_srv_rate continuous dst_host_same_src_port_rate continuous dst_host_srv_diff_host_rate continuous dst_host_serror_rate continuous dst_host_srv_serror_rate continuous dst_host_rerror_rate continuous dst_host_srv_rerror_rate continuous
3.2. MeanShift Clustering Algorithm
MeanShift algorithm is a sliding-window-based algorithm which tries to find the dense areas in a dataset [45]. This algorithm is also called a nonparametric clustering technique which doesn’t need to know the number of clusters in advance, and it doesn’t put a restriction on the shape of the cluster. It is a
centroid-based algorithm where the main purpose is to find the center of each group in the dataset. The center of each group is updated by calculating the mean of all data points in the sliding window until convergence is met.
Given a set of n data points xi, i = 1,..., n on a d -dimensional space Rd, the MeanShift algorithm works as
follows:
1. MeanShift algorithm works as a circular sliding window having the center of the window at any random data point selected from the set of points and radius k as the kernel. MeanShift involves shifting the kernel to a high-density area in each iteration until convergence.
2. In every iteration, the sliding window is shifted towards the higher density region by changing the center to the mean of the points within that window. 3. This process of shifting the sliding window
continues until there is no more movement in the sliding window.
4. The steps above are repeated with multiple sliding windows in the dataset moving towards the high-density area until convergence.
This process discovers the clusters in the dataset with their individual cluster centers, also called cluster centroids [45]. Algorithm 1 illustrates the steps involved in the MeanShift algorithm implemented in this project, which is explained by Cheng [45].
Algorithm 1: MeanShift Clustering Algorithm
Given a set of n connections xi, i = 1,..., n on a d
-dimensional space Rd.
1. Initialize the random seed. 2. Initialize the window.
3. Find the centroid of the window by using the following equation.
𝑀𝑒𝑎𝑛 =1
𝑁∑ (𝑐𝑜𝑛𝑛𝑒𝑐𝑡𝑖𝑜𝑛𝑗)
𝑁
𝑗=1
4. Shift the window towards the new centroid. Repeat the window initialization until convergence.
There are a couple of advantages of MeanShift algorithm [45]. Most importantly, it is an application-independent data analysis tool that can be applied in a wide array of application areas. The shape of the clusters is also not fixed, which is very important because it can be applied to any unknown datasets. This algorithm is also capable of handling any number of features in a dataset, which makes it very useful for an environment having multiple features. Finally, the MeanShift algorithm automatically computes the total number of clusters based on the density of the data.
3.3. Data Preprocessing
The research involves the dataset preprocessing followed by data normalization. The 10% KDD 99 dataset contains forty-one (41) attributes, which falls under continuous and discrete data type. For example, the protocol_type feature of the dataset is having values like TCP, UDP, and ICMP. This research uses only thirteen attributes out of all the attributes present in the dataset because Eldos et al. [46] proposed that not all the attributes are significant. They have identified that only thirteen attributes are significant. Those attributes are protocol_type, service, flag, src_bytes, dst_bytes, wrong_fragment, logged_in, num_compromised, is_guest_login, count, srv_count, dst_host_srv_count, and dst_host _same_src_port_rate respectively. The reduced number of attributes are considered more relevant to the data, which likely will lead to a decrease in the dataset noise. This reduction can potentially enhance detection rate and accuracy.
3.4. Data Normalization
Data normalization is the next step after the data preprocessing process. It is necessary to normalize the dataset to reduce the chance that one feature will dominate the others in the distance calculation. Algorithm two, which was used previously in the evaluation of K-Means clustering for intrustion detection, will be used to normalize the dataset before applying MeanShift algorithm [47] .
Algorithm 2: Normalization Algorithm
Find the mean of each connection record using the equation given below.
𝑚𝑒𝑎𝑛 =1
𝑁∑ (𝑐𝑜𝑛𝑛𝑒𝑐𝑡𝑖𝑜𝑛𝑗)
𝑁 𝑗=1
1. Find the standard deviation from all the connection records using the equation given below.
𝑠𝑡𝑑 = ( 1 𝑁 − 1∑ (𝑐𝑜𝑛𝑛𝑒𝑐𝑡𝑖𝑜𝑛𝑗− 𝑚𝑒𝑎𝑛) 2) 𝑁 𝑗=1 1/2
2. Replace every connection record by the new record by using the below equation.
𝑛𝑒𝑤 𝑐𝑜𝑛𝑛𝑒𝑐𝑡𝑖𝑜𝑛 =𝑜𝑙𝑑 𝑐𝑜𝑛𝑛𝑒𝑐𝑡𝑖𝑜𝑛 − 𝑚𝑒𝑎𝑛
𝑠𝑡𝑑
3.5. Research Scope
This research involves the application of MeanShift algorithm to detect an attack in KDD 99 dataset. The ability of the proposed algorithm to detect an attack is solely tested on the KDD 99 dataset. The normalization
technique applied in this research may show different results on other datasets. In addition, the application of other normalization approaches to this dataset is considered out of scope for this research.
3.6.
Controlled Experiment
The experiment to test the effectiveness of MeanShift algorithm to detect an attack in KDD 99 dataset involved the setting up of an environment that comprised of the following components.
1. Python 2.7.0 [47]: A high-level and interpreted programming language that contains a machine learning library that helps in the efficient implementation and execution of code.
2. Scikit-learn 0.21.1 [48]: It is a free, open-source machine-learning library built on top of Python programming language. This library consists of algorithms such as clustering, classification, and regression.
3. Numpy 1.16.4 [49]: It is a python library, which has inbuilt support for high dimensional matrices, arrays, and mathematical functions that operate on matrices and arrays.
4. Matplotlib 3.0.3 [50]: A python library used to create plots and diagrams.
The experiment starts with the data preprocessing, followed by the data normalization and the generation of a class label of each connection record of the dataset. Then, the normalized KDD 99 training dataset was provided as an input to the MeanShift algorithm. The algorithm generates two clusters with their individual cluster centers. This step is followed by the generation of a cluster label of each connection record using the computed cluster centers. Once the cluster label is generated, the confusion matrix is generated from the cluster labels and the class labels of each connection records. Based on the confusion matrix, detection rate, and detection accuracy are calculated. The above steps are performed using the scikit-learn library.
4. Results and Analysis
This experiment involves two phases, which are the clustering phase, followed by finding the performance of the algorithm. In the clustering phase, MeanShift algorithm is applied on the 10% normalized KDD 99 dataset to find the clusters. The second phase of the algorithm provides the effectiveness of the MeanShift algorithm in terms of detection rate and detection accuracy. Detection rate and detection accuracy will help in evaluating the performance of the MeanShift algorithm by providing the percentage of intrusions detected and the number of erroneous classifications. As
used and explained by Nalavade et al. [51], the following metrics are used to evaluate the performance of the MeanShift algorithm.
1. False Positive (FP): This is when an intrusion detection system signals an alarm even though no attack has taken place in reality.
2. False Negative (FN): FN occurs when an intrusion detection system fails to detect an actual attack. 3. True Positive (TP): TP is considered as the
genuine attack detected by an intrusion detection system.
4. True Negative (TN): TN is a case when there is no attack and no alarm raised by the intrusion detection system.
5. False Alarm Rate (FAR): FAR is defined as the total number of normal connections detected as an attack divided by the total number of normal connections.
6. Detection Rate (DR): DR is calculated by dividing the total model count of intrusions detected by the total number of intrusions present in the dataset. 7. Accuracy: Accuracy is defined as the sum of TP
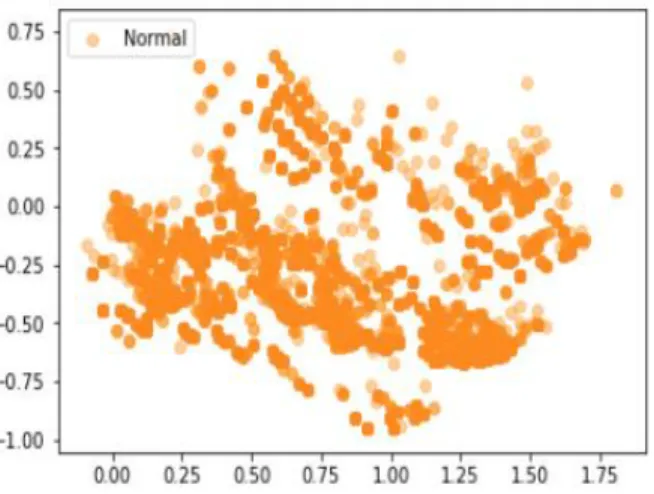
and TN divided by the sum of TP, TN, FP, and FN. Figure 1 shows the distribution of normal connections in the KDD 99 dataset after applying the principal component analysis. This analysis helps to reduce the dimension of the large dataset by keeping the majority of the information in the dataset [52]. Reducing the dimensionality from the dataset will make the dataset easier to visualize.
Figure 1: Distribution of Normal Connections Figure 2 shows the distribution of major attack types in KDD 99 dataset, which is also visualized after applying the principal component analysis. Figure 3 illustrates the clustering of the MeanShift algorithm on the KDD 99 dataset. The application of this algorithm generated two clusters with the cluster centers marked as a circle in Figure 3.
Figure 2: Distribution of Attacks
Looking at the cluster plot, it can be analyzed that the data points in green have the majority of data and vice-versa. There are some attack connections which are clustered together with the normal data connections. Particularly, the User to Root (U2R) and Remote to Local (R2L) attack types. Since the algorithm has detected the DOS with the maximum rate among all the attack types, the data points in blue are mostly Denial of Service (DOS) attack.
Figure 3: Clustering Plot of MeanShift Algorithm Figure 4 shows the detection rate and detection accuracy of the MeanShift algorithm. The histogram depicts the detection rate and detection accuracy, respectively. The algorithm was able to detect an attack in a dataset with a detection rate of 79.1 percent. The detection accuracy was 81.2 percent. This result was obtained with a bandwidth value of four in the MeanShift algorithm. Figure 5 shows the performance of MeanShift algorithm to detect attacks in the KDD 99 dataset.
The algorithm performance has a recall value close to one and False Negative value close to zero. Precision value is close to 0.75, while True Negative and False Positive values are close to 0.2 and 0.25, respectively. The True Positive value is 0.63.
Figure 4: MeanShift Algorithm Evaluation Normal connections have a detection rate of 99.9 percent. Denial of Service (DOS) has a detection rate of 72.6 percent. However, the algorithm couldn’t detect the Remote to Local (R2L) and User to Root (U2R) attacks. The detection rate for the Probe attack was 6.5 percent. Figure 6 shows the performance of MeanShift algorithm in terms of detection accuracy in the KDD 99 dataset.
Figure 5: Performance Evaluation of MeanShift Algorithm
Figure 6: Detection Rate of Attack Types Table 3 summarizes the unsupervised learning algorithm performance comparison data for MeanShift,
78 78.5 79 79.5 80 80.5 81 81.5
Detection Rate Detection Accuracy
0 0.2 0.4 0.6 0.8 1 1.2 0 20 40 60 80 100 120
K-Means, and Fuzzy C-Means. The performance of the MeanShift algorithm is better than K-Means and is just below the Fuzzy C-Means in terms of detection accuracy. In addition to detection accuracy, the detection rate of the MeanShift algorithm is lower than the K-Means algorithm.
However, the benefit of a MeanShift algorithm is that it can automatically detect dataset clusters based on data density minimizing the occurrence of empty clusters impacting data analysis. The detection rate and detection accuracy of the MeanShift algorithm could have been impacted by the normalization technique that was implemented. Hence, the algorithm can potentially be improved by implementing other normalization and transformation techniques such as min-max normalization and decimal scaling. The feature selection implemented in this experiment could impact detection and accuracy rates. Potential improvements in performance will investigate the impact of different feature selections.
Table 3: Performance Comparison Unsupervised Algorithm Detection Rate Detection Accuracy MeanShift 79.1% 81.2% K-Means [36] 82.3% 77.2% Fuzzy C-Means [36] 84.6% 82.1%
5. Conclusion
This research implements a MeanShift algorithm to detect an attack in a network traffic dataset. The experiment is comprised of two phases, which are clustering and performance evaluation. The clustering phase uses a normalized 10% KDD 99 training dataset, which consisted of 494,021 connection records. The application of a MeanShift Algorithm on this normalized dataset produced two clusters. The performance evaluation phase determines the effectiveness of MeanShift Algorithm in detecting an attack in network traffic dataset.
The performance of MeanShift algorithm is evaluated using two metrics. These metrics are detection rate and detection accuracy, respectively. The results answer three research questions. First, the MeanShift algorithm can detect an attack in a network traffic dataset. Second, the detection rate of the MeanShift Algorithm is 79.1 percent. Third, the detection accuracy of the MeanShift Algorithm is 81.2 percent. Hence, the results from this research support the hypothesis that the MeanShift algorithm can detect an attack in a network traffic dataset. Further analysis of the detection rate of individual attack types reveals that the detection rate was 72.6 percent for DOS. The MeanShift algorithm detection rate for a probing attack was only 6.5 percent.
In addition, the analysis also indicates that the MeanShift algorithm did not detect the R2L and U2R attack types.
6. Future Work
Future work will investigate the improvement of the performance of the MeanShift Algorithm on Remote to Local and User to Root attack types. This algorithm will be applied to other intrusion data sets to examine the performance of the proposed MeanShift algorithm.
Future work will also investigate the application of the MeanShift algorithm model in live network environments to detect attacks. Investigating the scalability and adaptability of MeanShift algorithm towards varying sizes and distributions of datasets will be an area of further research. A hybrid model using a K-Means Algorithm and a MeanShift algorithm will be developed and tested on the KDD 99 dataset to explore improving detection accuracy.
This work will also take into consideration cost factors, like developmental and operational, along with impact probability and cost that are associated with attack detection. A weighting system will be developed and implemented to assist in assessing the overall impact of individual factors and groups of factors. Depending on the cost for each factor, an algorithm will be developed that takes into account each factor’s cost and probability. If developmental and operational costs are too high, the algorithm can remove individual factors from the intrusion detection equation. On the other hand, if the probability and impact of a successful attack are high, the factor can be assigned a higher weight. The implementation of this solution will be virtualized.
7. References
[1] Team, H. Internet Stats & Facts for 2019. 2018. Internet Stats & Facts for 2019. Date of Last Access: 06/15.
[2] Juniper Research. Cybercrime & Data Breaches to Cost Businesses $8 Trillion Over the Next 5 Years. 2017.
https://www.juniperresearch.com/press/press-releases/cybersecurity-data-breaches. Date of Last Access: 06/15.
[3] Grispos, G., W.B. Glisson, and T. Storer, How Good is Your Data? Investigating the Quality of Data Generated During Security Incident Response Investigations. arXiv preprint arXiv:1901.03723, 2019.
[4] Grispos, G., W.B. Glisson, D. Bourrie, T. Storer, and S. Miller, Security incident recognition and reporting (SIRR): an
industrial perspective. arXiv preprint arXiv:1706.06818, 2017.
[5] Grispos, G., W.B. Glisson, and T. Storer, Enhancing security incident response follow-up efforts with lightweight agile retrospectives. Digital Investigation, 2017. 22: p. 62-73.
[6] Watts, T., R. Benton, W. Glisson, and J. Shropshire. Insight from a Docker Container Introspection. in Proceedings of the 52nd Hawaii International Conference on System Sciences. 2019.
[7] Vigliarolo, B. Forrester: What can we learn from a
disastrous year of hacks and breaches? 2017.
https://www.techrepublic.com/article/forrester-what-can-we-learn-from-a-disastrous-year-of-hacks-and-breaches/. Date of Last Access:
[8] SecurityScorecard. Report Reveals Healthcare Industry Lacking in Basic Security Awareness Among Staff, Putting
Entire Medical Infrastructure At Risk. 2016.
https://www.prnewswire.com/news-releases/report-reveals- healthcare-industry-lacking-in-basic-security-awareness- among-staff-putting-entire-medical-infrastructure-at-risk-300352485.html. Date of Last Access: 06/15.
[9] Perlroth, N. Yahoo Says Hackers Stole Data on 500 Million
Users in 2014. 2016.
https://www.nytimes.com/2016/09/23/technology/yahoo-hackers.html. Date of Last Access: 06/15.
[10] Smith, S. Juniper Research: Cybersecurity Breaches to Result in Over 146 Billion Records Being Stolen by 2023. 2018.
https://www.businesswire.com/news/home/20180808005033/ en/Juniper-Research-Cybersecurity-Breaches-Result-146-Billion. Date of Last Access: 06/15.
[11] Weber, J. Identity Fraud Hits All Time High With 16.7 Million U.S. Victims in 2017, According to New Javelin
Strategy & Research Study. 2018.
https://www.javelinstrategy.com/press-release/identity-fraud- hits-all-time-high-167-million-us-victims-2017-according-new-javelin. Date of Last Access: 06/15.
[12] Equifax Releases Updated Information on 2017
Cybersecurity Incident. 2018.
https://www.equifaxsecurity2017.com/2018/03/01/equifax-releases-updated-information-2017-cybersecurity-incident/. Date of Last Access: 06/15.
[13] Ponemon, L. Calculating the Cost of a Data Breach in
2018, the Age of AI and the IoT. 2018.
https://securityintelligence.com/ponemon-cost-of-a-data-breach-2018/. Date of Last Access: 06/15.
[14] Alexander, B., S. Haseeb, and A. Baranchuk, Are
implanted electronic devices hackable? Trends in
Cardiovascular Medicine, 2018.
[15] Hanna, S., L. Huang, E. Wu, S. Li, C. Chen, and D. Song. Juxtapp: A scalable system for detecting code reuse among android applications. in International Conference on Detection of Intrusions and Malware, and Vulnerability Assessment. 2012. Springer.
[16] Douligeris, C. and D.N. Serpanos, Network security: current status and future directions. 2007: John Wiley & Sons. [17] Ilgun, K., R.A. Kemmerer, and P.A. Porras, State transition analysis: A rule-based intrusion detection approach. IEEE transactions on software engineering, 1995(3): p. 181-199.
[18] Palmer, G., A road map for digital forensics research-report from the first Digital Forensics Research Workshop (DFRWS). Utica, New York, 2001.
[19] Garfinkel, S., Network forensics: Tapping the internet. IEEE Internet Computing, 2002. 6: p. 60-66.
[20] Lunt, T.F., A survey of intrusion detection techniques. Computers & Security, 1993. 12(4): p. 405-418.
[21] Gogoi, P., B. Borah, and D.K. Bhattacharyya, Anomaly detection analysis of intrusion data using supervised & unsupervised approach. Journal of Convergence Information Technology, 2010. 5(1): p. 95-110.
[22] Mukkamala, S., G. Janoski, and A. Sung. Intrusion detection: support vector machines and neural networks. in proceedings of the IEEE International Joint Conference on Neural Networks (ANNIE), St. Louis, MO. 2002.
[23] Peddabachigari, S., A. Abraham, C. Grosan, and J. Thomas, Modeling intrusion detection system using hybrid intelligent systems. Journal of network and computer applications, 2007. 30(1): p. 114-132.
[24] Abadeh, M.S., J. Habibi, Z. Barzegar, and M. Sergi, A parallel genetic local search algorithm for intrusion detection in computer networks. Engineering Applications of Artificial Intelligence, 2007. 20(8): p. 1058-1069.
[25] Zhang, J. and M. Zulkernine. Network Intrusion Detection using Random Forests. in Pst. 2005. Citeseer. [26] Lee, W. and S.J. Stolfo, A framework for constructing features and models for intrusion detection systems. ACM transactions on Information and system security (TiSSEC), 2000. 3(4): p. 227-261.
[27] Patil, A.S. and D.R. Patil, Offline Host Based Intrusion Detection based on Analysis of System Calls.
[28] Chandrashekhar, A. and K. Raghuveer, Fortification of hybrid intrusion detection system using variants of neural networks and support vector machines. International Journal of Network Security & Its Applications, 2013. 5(1): p. 71.
[29] Eesa, A.S., Z. Orman, and A.M.A. Brifcani, A novel feature-selection approach based on the cuttlefish optimization algorithm for intrusion detection systems. Expert Systems with Applications, 2015. 42(5): p. 2670-2679. [30] Li, W., Using genetic algorithm for network intrusion detection. Proceedings of the United States Department of Energy Cyber Security Group, 2004. 1: p. 1-8.
[31] Lisehroodi, M.M., Z. Muda, and W. Yassin. A hybrid framework based on neural network MLP and K-means Clustering for Intrusion Detection System. in 4th International Conference on Computing and Informatics, ICOCI. 2013. [32] Dhanabal, L. and S. Shantharajah, A study on NSL-KDD dataset for intrusion detection system based on classification algorithms. International Journal of Advanced Research in Computer and Communication Engineering, 2015. 4(6): p. 446-452.
[33] Tavallaee, M., E. Bagheri, W. Lu, and A.A. Ghorbani. A detailed analysis of the KDD CUP 99 data set. in 2009 IEEE Symposium on Computational Intelligence for Security and Defense Applications. 2009. IEEE.
[34] Ingre, B. and A. Yadav. Performance analysis of NSL-KDD dataset using ANN. in 2015 International Conference on Signal Processing and Communication Engineering Systems. 2015. IEEE.
[35] Pajouh, H.H., R. Javidan, R. Khayami, D. Ali, and K.-K.R. Choo, A two-layer dimension reduction and two-tier classification model for anomaly-based intrusion detection in IoT backbone networks. IEEE Transactions on Emerging Topics in Computing, 2016.
[36] Ranjan, R. and G. Sahoo, A new clustering approach for anomaly intrusion detection. International Journal of Data Mining & Knowledge Management Process (IJDKP), 2014.
4(2).
[37] Shadish, W.R., T.D. Cook, and D.T. Campbell, Experimental and quasi-experimental designs for generalized causal inference. 2002.
[38] Özgür, A. and H. Erdem, A review of KDD99 dataset usage in intrusion detection and machine learning between 2010 and 2015. PeerJ Preprints, 2016. 4: p. e1954v1.
[39] Stolfo, S.J., W. Fan, W. Lee, A. Prodromidis, and P.K. Chan. Cost-based modeling for fraud and intrusion detection: Results from the JAM project. in Proceedings DARPA Information Survivability Conference and Exposition. DISCEX'00. 2000. IEEE.
[40] NCCIC. Security Tip (ST04-015)
Understanding Denial-of-Service Attacks. 2009.
https://www.us-cert.gov/ncas/tips/ST04-015. Date of Last Access: 06/15.
[41] Rashid, F.Y. Feds Seize Alternative Android App Markets For App Piracy. 2012. https://www.securityweek.com/feds-seize-alternative-android-app-markets-app-piracy. Date of Last Access: 09/03.
[42] Paliwal, S. and R. Gupta, Denial-of-service, probing & remote to user (R2L) attack detection using genetic algorithm. International Journal of Computer Applications, 2012. 60(19): p. 57-62.
[43] Rouse, M. probe.
https://searchsecurity.techtarget.com/definition/probe. Date of Last Access: 06/15.
[44] Crussell, J., C. Gibler, and H. Chen. Attack of the clones: Detecting cloned applications on android markets. in European Symposium on Research in Computer Security. 2012. Springer.
[45] Cheng, Y., Mean shift, mode seeking, and clustering. IEEE transactions on pattern analysis and machine intelligence, 1995. 17(8): p. 790-799.
[46] Eldos, T., M.K. Siddiqui, and A. Kanan, On the KDD'99 Dataset: Statistical Analysis for Feature Selection. Journal of Data Mining and Knowledge Discovery, 2012. 3(3): p. 88.
[47] Python 2.7.0 Release. 2010.
https://www.python.org/download/releases/2.7. Date of Last Access: 06/15.
[48] Pedregosa, F., G. Varoquaux, A. Gramfort, V. Michel, B. Thirion, O. Grisel, M. Blondel, P. Prettenhofer, R. Weiss, and V. Dubourg, Scikit-learn: Machine learning in Python. Journal of machine learning research, 2011. 12(Oct): p. 2825-2830.
[49] NumPy. 2019. https://www.numpy.org. Date of Last Access: 06/15.
[50] Lakshmanan, R. ‘Agent Smith’ malware replaces legit Android apps with fake ones on 25 million devices. 2019.
https://thenextweb.com/security/2019/07/10/agent-smith- malware-replaces-legit-android-apps-with-fake-ones-on-25-million-devices/. Date of Last Access: 09/03.
[51] Nalavade, K. and B. Meshram, Evaluation of k-means clustering for effective intrusion detection and prevention in massive network traffic data. International Journal of Computer Applications, 2014. 96(7).

![Table 3: Performance Comparison Unsupervised Algorithm Detection Rate Detection Accuracy MeanShift 79.1% 81.2% K-Means [36] 82.3% 77.2% Fuzzy C-Means [36] 84.6% 82.1% 5](https://thumb-us.123doks.com/thumbv2/123dok_us/519479.2561215/8.918.118.436.468.562/performance-comparison-unsupervised-algorithm-detection-detection-accuracy-meanshift.webp)