DESIGN AND DEVELOPMENT OF A RECTANGULAR SUPERSONIC WIND TUNNEL FACILITY FOR THE STUDY OF SHOCK/BOUNDARY LAYER INTERACTIONS
BY
WILBUR CHANG
THESIS
Submitted in partial fulfillment of the requirements for the degree of Master of Science in Aerospace Engineering
in the Graduate College of the
University of Illinois at Urbana-Champaign, 2011
Urbana, Illinois
Advisers:
Professor J. Craig Dutton Professor Gregory S. Elliott
ii
Abstract
The research work of this thesis was part of the low-boom supersonic inlet project conducted by NASA, Gulfstream Aerospace Corporation, Rolls-Royce, and the University of Illinois. The low-boom supersonic inlet project itself was part of a new supersonic business jet design. The primary goal of the low-boom supersonic inlet group was to reduce the sonic boom of the new jet by improving the performance of the inlets. The objective of the experimental team at the University of Illinois was to provide testing support to evaluate simple, passive, and bleedless inlet shock wave/boundary layer interaction control options, called micro-vortex generators.
A new supersonic wind tunnel was designed and built on the University of Illinois campus to enhance high-speed flow testing capabilities used for studying these flow-control devices. A newer and larger tunnel will also contribute to expand the College of Engineering’s tools for studying and understanding high-speed fluid mechanics and applications to aerodynamics and propulsion technologies. The new wind tunnel is a rectangular testing facility with a 5” by 5” cross-sectional area in the test section. It is a blowdown, intermittent, open-loop facility, capable of operating at Mach numbers of 1.4 and 2, with the theoretical capability of reaching Mach 3. The wind tunnel was assembled and installed in the west wing of Aeronautical Lab A, and shares the same air supply system with an existing axisymmetric supersonic wind tunnel and an open jet anechoic testing chamber. The run time for the tunnel at Mach 1.4 is approximately 120 seconds, with a turnaround time of approximately 10 minutes.
A brief study and experimental testing of a set of micro-vortex generators, in the form of ramped vanes, were performed to demonstrate the capabilities of the new tunnel. A 5° expansion diffuser was situated downstream of the vortex generators to model the effects of a supersonic external compression inlet and diffuser. The incoming boundary layer profiles of the top and bottom walls were characterized through particle image velocimetry. Visual diagnostic techniques of schlieren imaging, surface oil flow visualization, and particle image velocimetry were conducted to study the effects of the ramped vanes on shock wave/boundary layer interactions. The vanes were observed to produce two distinct vortex pairs that entrained and mixed higher momentum air into the boundary layer. Higher velocity air was observed to lie closer to the diffuser surface from the turbulent mixing caused by the vortex generators.
iii
Acknowledgements
This project was made possible by the support of Gulfstream Aerospace Corporation and Rolls-Royce Plc. I would like to acknowledge Tim Conners, Tom Wayman, and Robbie Cowart from Gulfstream and John Whurr from Rolls-Royce.
I would like to thank my advisors, Dr. Elliott and Dr. Dutton. The machine shop guys, Greg, Kent, David, Dustin, Steve. My colleagues and friends, Brad, Tommy, Todd, Blake, Eli, Nachiket, Ruben, Ryan. The undergraduates, John, Brock, Richie. Other friends that helped me on the project, Colin, Aaron, Yeong. I would also like to thank Jeannette for helping me recover from my broken left arm in the first year of the project. Lastly, I’d like to acknowledge my family.
iv
Table of Contents
Nomenclature ... vi
Chapter 1 Introduction ... 1
1.1 Motivation ... 1
1.2 Supersonic Wind Tunnel Fluid Mechanics ... 3
1.3 Supersonic Wind Tunnel Background ... 5
Chapter 2 Larger Rectangular Supersonic Wind Tunnel Component Design ... 7
2.1 Design Constraints ... 7
2.2 Driving Design Factors ... 8
2.3 High Pressure Air Supply and Storage System ... 12
2.4 Upstream Piping ... 14
2.5 Stagnation Chamber ... 16
2.6 Wind Tunnel ... 17
2.6.1 Overview ... 17
2.6.2 Inlet and Flow Straighteners ... 20
2.6.3 Nozzle ... 21
2.6.4 Test Section ... 24
2.6.5 Windows ... 25
2.7 Diffuser ... 25
2.8 Downstream Ducting and Gate Inserts ... 27
2.9 CAD Illustrations ... 30
Chapter 3 Wind Tunnel Operation and Testing ... 31
3.1 Data Acquisition Hardware – Sensors, Instrumentation, Control Box ... 31
3.2 Safety Considerations ... 32
3.3 LabVIEW ... 34
Chapter 4 Experimental Flow Diagnostics Setup ... 38
4.1 Pressure and Temperature Measurements ... 38
4.2 Schlieren Photography ... 38
4.3 Surface Flow Visualization ... 40
4.4 Particle Image Velocimetry ... 41
Chapter 5 Wind Tunnel Characterization Results ... 43
v
5.2 Schlieren Photography ... 43
5.3 Surface Flow Visualization ... 45
5.4 Particle Image Velocimetry ... 45
5.5 Summary of Wind Tunnel Operation Properties ... 47
Chapter 6 Passive Flow-Control Device Testing ... 48
6.1 Micro-Vortex Generator Design ... 48
6.2 Diffuser Expansion Design ... 48
6.3 Experimental Setup ... 49
6.4 Results and Discussion ... 50
6.4.1 Schlieren Photography ... 50
6.4.2 Surface Flow Visualization ... 54
6.4.3 Particle Image Velocimetry ... 56
Chapter 7 Conclusions ... 62
References ... 63
APPENDIX A: TECHNICAL DOCUMENTATION ... 65
APPENDIX B: ENGINEERING DRAWINGS ... 68
AXISYMMETRIC SUPERSONIC TUNNEL MODIFICATIONS ... 68
CONTROL BOX PART ... 71
FLOW-CONTROL TEST SECTION PARTS ... 72
UPSTREAM PIPING ... 77
ORIGINAL LARGER RECTANGULAR SUPERSONIC TUNNEL PARTS ... 78
vi
Nomenclature
AST axisymmetric supersonic tunnel A* sonic throat areaA test section area
a speed of sound
CCD charged couple device Cf skin friction coeffcient H incompressible shape factor HST hypersonic tunnel
h nozzle contour height at throat L total length of subsonic nozzle spline LRST larger rectangular supersonic tunnel p static pressure
p1 static pressure upstream of normal shock p2 static pressure downstream of normal shock pf final tank pressure
pi initial tank pressure pt stagnation pressure
M1 Mach number upstream of normal shock
M Mach number
NI National Instruments
n polytropic exponent of expansion PIV particle image velocimetry
R gas constant
SBLI shock/boundary layer interaction SRST smaller rectangular supersonic tunnel T static temperature
Ti initial air supply tank temperature Tt stagnation temperature
t run time
U freestream velocity u streamwise velocity
u+ streamwise velocity in wall coordinates u’v’ Reynolds shear stress
V air supply tank volume VI virtual instrument x streamwise coordinate y transverse coordinate y+ transverse wall coordinate δ boundary layer thickness δ*
incompressible displacement thickness γ specific heat ratio
µ Mach angle
μVG micro-vortex generator Π wake strength parameter
σ standard deviation
1
Chapter 1
Introduction
1.1 Motivation
Well-performing supersonic inlets on gas turbine engines must provide uniform, stable, and subsonic flow before the engine face for compression and combustion. The supersonic air is decelerated by the inlet through a system of shocks. The performance of the engine inlet is largely affected by the shock/boundary layer interactions (SBLIs). Shock-induced separation and adverse pressure gradients may cause total pressure losses, flow distortions, and unsteadiness in heating and pressure loads, which will degrade the performance of the engine or may even lead to engine unstart.
The low-boom supersonic inlet project of NASA, Gulfstream Aerospace Corporation, Rolls-Royce, and the University of Illinois has been investigating flow-control devices that will improve the efficiency of supersonic business jet engine inlets. The main goals of the flow-control devices are to improve the cruise efficiency, reduce distortions, increase shock stability, reduce separation, and increase total pressure recovery of the inlet, while minimizing the sonic boom signature of the aircraft. Past flow-control techniques have used methods of bleed to extract the lower momentum fluid close to the wall in order to reduce separation. However, this reduces the effective mass flow rate of the engine, and therefore needs to be counterbalanced with larger inlets that incur more drag and are ultimately less efficient.
Past studies and research have shown that micro-vortex generators (μVGs) have potential in improving the SBLIs in the inlets of supersonic engines 1-5. These flow-control devices are passive and bleedless. The attractiveness of the VGs comes from their simplicity, robustness, and ease of implementation. The VGs are designed to energize the boundary layer by means of entraining and mixing the high momentum air from the freestream into the low momentum fluid within the boundary layer. This aims to improve the health of the boundary layer and to suppress or eliminate flow separation downstream of the VGs. The μVGs are specifically designed with device heights less than the boundary layer thickness, reducing their cost of parasitic drag.
2
An array of the μVGs, arranged in the spanwise-direction of the flow, is positioned upstream of the shock-induced separation region. Some typical VG geometries are shown in Figure 1 1, 5. Since the fluid mechanics of these flow-control devices are not fully understood at the fundamental level, the process of optimizing the array arrangement, number of VGs, and device size for any given application is ongoing. Even determining the optimal geometry design of the VGs is still a work in progress. More recent studies have demonstrated that the ramped vane designs may be the most effective at reducing separation as they produce stronger vortices, when compared to the other VG geometries 4, 5.
A) B) C) D)
Figure 1. Typical VG geometries, A) ramp, B) split-ramp, C) vanes, D) ramped-vanes
Experimental testing of the μVGs has been performed on the University of Illinois campus with the existing Smaller Rectangular Supersonic Tunnel (SRST) 3, 6. It was planned that these studies and experiments on the μVGs were to be expanded upon. In addition, it was desirable to further the general experimental supersonic fluids testing capabilities of the university. Therefore, incentives to build a larger wind tunnel facility arose.
There are a number of advantages to installing and implementing a larger supersonic wind tunnel testing facility. A larger tunnel will reduce the potential three-dimensional sidewall effects and wave reflections disturbing the measurement region. The wind tunnel will be able to achieve flows of higher Reynolds numbers and hence expand the possible testing regimes. A larger tunnel will also be able to produce results with a higher spatial resolution of data. A variety of different high-speed flow and aerodynamics testing purposes can also be accommodated with a larger test section that offers greater
3
flexibility. The tunnel will allow for testing of larger arrays and multiple rows of μVGs. In addition, the new wind tunnel will be used for testing a wide range of high-speed aerodynamics applications in the future.
1.2 Supersonic Wind Tunnel Fluid Mechanics
A supersonic wind tunnel is a test bed for examining the fluid mechanics and associated fluid phenomena for air travelling faster than the speed of sound. In order for the air inside the tunnel to reach supersonic conditions, the flow must be accelerated from rest through a converging-diverging nozzle 7. The Mach number produced in the test section is dependent on the area ratio between the test section and the throat of the nozzle 7. In high-speed wind tunnel theory, since the air is travelling at high velocities through the nozzle and test section, it can be assumed that the air flow is adiabatic. No heat is exchanged into or out of the wind tunnel. In addition, the acceleration of the flow is caused by extremely smooth changes of the surface contour of the nozzle. Neglecting dissipative frictional and viscous effects, it can be assumed that the flow in the wind tunnel is both reversible and adiabatic, and hence isentropic 8. This ideal assumption is useful in determining theoretical physical characteristics of the flow in the wind tunnel for design purposes. In reality the viscous and dissipative effects cannot be ignored. The isentropic assumption also breaks down in the vicinity of any shock waves.
A pressure difference across the upstream end and the downstream end of the piping supplies the energy, or power required to operate the tunnel. Often engineers specify the pressure ratio of the stagnation pressure to the back pressure required to start the tunnel. The flow inside the tunnel is naturally quiescent if the pressures are equal. However, once the pressure ratio increases, the air starts moving, and the wind tunnel progresses through stages until it is fully started. The first stage occurs when the pressure ratio is increased such that the air starts flowing through the wind tunnel. The flow is subsonic everywhere throughout the tunnel. Increasing the pressure ratio more will cause the flow to accelerate.
4
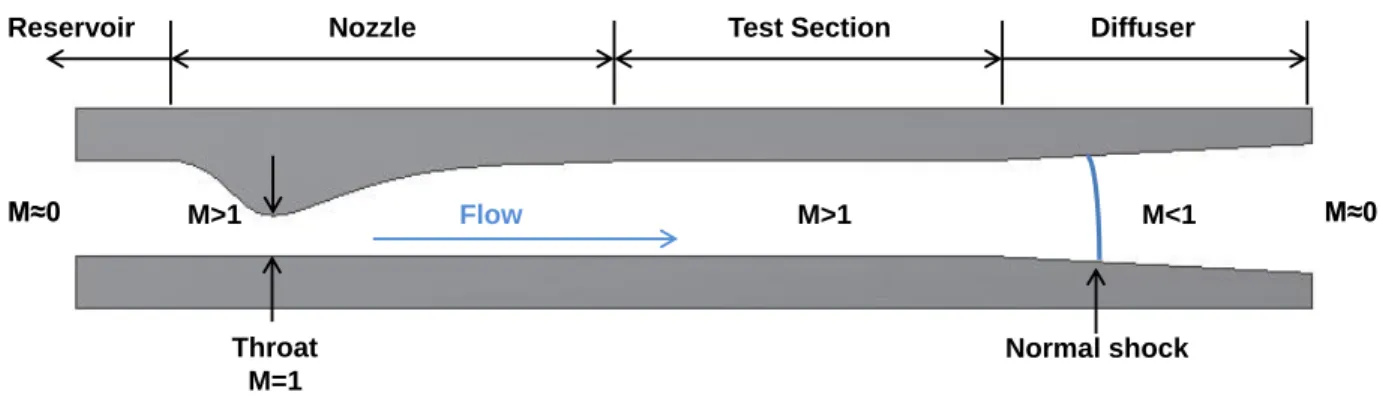
Increasing the ratio up to a critical point will cause a normal shock to form at the nozzle throat, choking the flow. The flow will be subsonic upstream of the throat, sonic at the throat, and subsonic again downstream of the throat. Increasing the pressure ratio further will drive the normal shock farther downstream into the tunnel. The flow will always remain subsonic upstream of the throat, sonic at the throat, supersonic between the throat and the normal shock, and subsonic again downstream of the normal shock. At the point that the pressure ratio increases enough to drive the normal shock fully past the test section, the tunnel is considered fully started. As the tunnel is fully started, the normal shock will be positioned in the diffuser of the wind tunnel. The diffuser is responsible for decelerating the flow and to improve total pressure recovery of the flow. A schematic of a fully started wind tunnel is shown in Figure 2.
Figure 2. Wind tunnel with single-wall nozzle at fully started conditions
It should be noted that in designing supersonic wind tunnels the flow field is modeled as quasi-one-dimensional flow. This means that the flow properties are assumed uniform across any given cross-section of the flow, and are only dependent on the streamwise coordinate. It is obvious that quasi-one-dimensional flow is an approximation to the actual more complicated physics of the flow 8, which contains oblique waves, viscous effects, and boundary layer regions.
Reservoir Nozzle Test Section Diffuser
M≈0 M>1 M>1 M<1 M≈0
Throat M=1
Flow
5
1.3 Supersonic Wind Tunnel Background
There are three main categories of supersonic wind tunnels, differentiated by how the pressure ratio between the inlet and exhaust is achieved and controlled. The first type is known as an indraft tunnel. In an indraft tunnel, the inlet pressure is at atmospheric pressure, while the exhaust is at a lower vacuum pressure. The second type of tunnel, the blowdown facility, has the opposite pressure setup; high pressure is stored at the inlet, and the exhaust is at atmospheric pressure. The third type of facility, termed the pressure-vaccum tunnel, combines both a high pressure inlet and a lower pressure vacuum at the exhaust. In most cases, pressure-vacuum tunnels are hypersonic tunnels, given the amount of power they must exert on the flow. The indraft and blowdown tunnels each have their own advantages and disadvantages. For indraft tunnels, the supply air conditions (total temperature and pressure) are more consistent and stable. Vacuum is also safer to handle than high pressure air. For the blowdown tunnel, it can be more flexible in achieving different Reynolds numbers for a given Mach number. The cost of a blowdown tunnel is also generally lower than an indraft tunnel operating at equal Reynolds numbers.
There are a number of existing supersonic wind tunnel facilities in the United States used for aeronautical testing purposes. A brief list of these facilities is presented in Table 1. The focuses of use of these tunnels vary widely from studying fundamental supersonic fluid mechanics, to validating computational fluid dynamics, to evaluating advanced aircraft concepts and components, to testing aircraft and spacecraft propulsion systems.
6
Table 1. Non-exhaustive list of supersonic wind tunnels in the United States 9-20
Institution Size Type Mach number (s) Other operating conditions
NASA Glenn 1’×1’ Continuous,
blowdown
1.3-6
NASA Glenn 8’×6’ Continuous,
blowdown
0-0.1, 0.25-2
NASA Glenn 10’×10’ Continuous,
blowdown
0-0.36, 2-3.5
NASA Ames 9’×7’ Continuous,
blowdown 1.55-2.55 University of Texas at Arlington 6”×6” Intermittent, Blowdown
1.5-4 ~45 s run time for Mach 2.5 University of Michigan 4”×4” Intermittent, indraft 1.3-4.6 Virginia Tech 23 cm ×23 cm (9.055”×9.055”) Intermittent, Blowdown
0.2-0.8, 2.4-4 Run time range is 8-60 s
Lockheed Martin Missiles and Fire
Control
4’×4’ Intermittent, blowdown
0.3-1.8, 1.6-4.8 Run time range is 15-110 s Wichita State University 9”×9” Intermittent, blowdown 0.9-1.3, 2-4 Run time ~30 s University of Illinois (HST) 5”×5” Intermittent, blowdown
4 Run time ~ 4 min
University of Illinois (SRST)
2.543” × 2.500” Intermittent, blowdown
1.4, 2.5, 3 Run time ~20 min
University of Illinois (LRST)
5”×5” Intermittent, blowdown
1.4-3 Run time ~ 2 min for Mach 1.4
7
Chapter 2
Larger Rectangular Supersonic Wind Tunnel Component Design
2.1 Design Constraints
The major engineering constraint of developing the new Larger Rectangular Supersonic Tunnel (LRST) was influenced by the existing facility hardware and infrastructure already in place. The new wind tunnel was required to be joined to the existing infrastructure. The infrastructure that was already in place included the high pressure air supply system and the downstream exhaust duct. The high pressure air supply system included the Ingersoll-Rand compressors, dryers, air supply tanks, and the supply air manifold feeding into Aeronautical Lab A. The downstream exhaust duct connects to the same exhaust system used by the Axisymmetric Supersonic Tunnel (AST) already in the lab facility. Therefore, the total length of the wind tunnel from the air supply manifold connection to the exhaust connection was fixed. This total length is 16’-5.25”. Additionally, the height that the LRST must sit off the ground was also fixed by the height of the exhaust system. This design height is 61.23”.
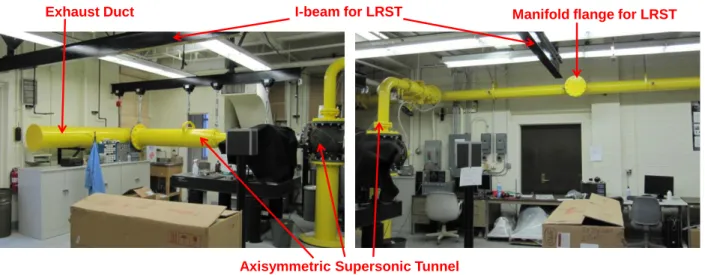
Aeronautical Lab A was already designed previously to support an additional wind tunnel facility. The manifold had an unused flange connection to join additional piping to it. An I-beam support from the ceiling is also centered over this flange connection. Photographs of the inside of Aeronautical Lab A before the installation of the LRST are shown in Figure 3. The LRST would start from the manifold flange, run under the I-beam, and end at the exhaust duct.
8
A) B)
Figure 3. View in Aeronautical Lab A before installation of LRST, A) looking northwest, B) looking east
2.2 Driving Design Factors
The key driving design factors for the new wind tunnel can be summarized as follows. The wind tunnel must be able to produce uniform supersonic flow at the design Mach number in the test section. It must have the flexibility of being able to operate within a range of specified Mach numbers. The test section size must be sufficiently large compared to previous wind tunnel facilities on campus. The run time must also be sufficient for testing purposes. Lastly, the test section must have sufficiently large optical access for visual diagnostics.
A larger test section area means that the wind tunnel flow will be able to achieve higher Reynolds numbers for testing. A higher spatial resolution of data can be obtained, and flow structures can be better defined, visualized, and measured. In addition, a larger test section will also reduce the influence of reflected waves from the walls and the effect of corner flows that could disturb the measurement region. The design factors of test section size and run time are inversely related. The larger the test section size, the greater the mass flow rate, and hence the lower the run time becomes. The Smaller Rectangular Supersonic Tunnel (SRST) was the existing wind tunnel on the University of Illinois campus used to
Exhaust Duct
Axisymmetric Supersonic Tunnel
9
study the effect of μVGs on SBLIs. Its test section rectangular cross-sectional area measures 2.543” × 2.500” (height by width). The newer wind tunnel must be larger than this in order to make a noticeable improvement, while keeping the run time at a reasonable level as well.
Theoretical run time calculations were performed in order to decide on the test section size. The derivation of the theoretical run time equation is found in Pope 7. The basic fluid mechanics assumptions made for the flow in the wind tunnel include:
Fluid is air
Flow is isentropic in the tunnel
Ideal gas
Air in the tanks undergoes polytropic expansion
The run time of a supersonic wind tunnel, t, can be represented by equation (1),
1 1/ 2( 1) * 1 1 1 1 2 n f t i i t i p T p V t R T p A p
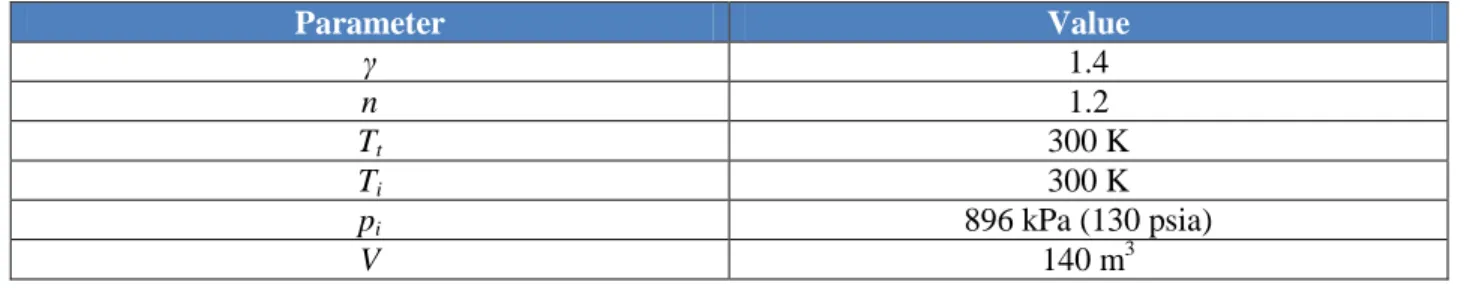
(1)where γ is the specific heat ratio, R is the gas constant, Tt is the stagnation temperature, Ti is the initial air supply tank temperature, pi is the initial tank pressure, pt is the total or stagnation pressure, V is the air supply tank volume, A* is the area of the sonic throat, pf is the final tank pressure, and n is the polytropic exponent of expansion. The parameters that were taken to be of constant value are tabulated in Table 2. pf was taken to be 15% greater than pt.
Table 2. Parameters of constant value for calculating wind tunnel run time
Parameter Value γ 1.4 n 1.2 Tt 300 K Ti 300 K pi 896 kPa (130 psia) V 140 m3
10
The next assumption made was that a single normal shock at the end of the test section would increase the static pressure back to atmospheric conditions. Therefore, the change in static pressure is represented from the normal shock relation,
2 1 2 1 ( 1) 2 ( 1) p p M
(2)where p1 is the pressure upstream of the shock, p2 is the pressure downstream of the shock, and M1 is the Mach number upstream of the shock. p2 was taken to have a value of 101.3 kPa. From isentropic relations, one can relate the test section static pressure to the stagnation pressure, given by equation (3).
1 2 1 1
1
1
2
tp
p
M
(3)The area-Mach relation is used to relate the sonic throat area to the test section area, A, and to the test section Mach number, M. In this case, M=M1.
1 2( 1) 2 *
1
1
1
1
2
1
2
M
A
AM
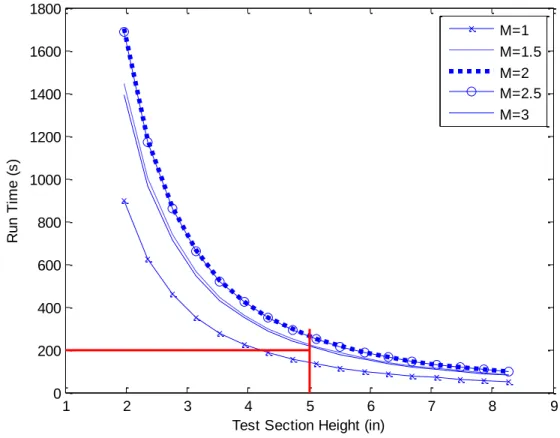
(4)Combining equations (2), (3), and (4) into equation (1), one obtains the wind tunnel run time as a function of test section area and Mach number. By varying these last two parameters, calculations were made for the wind tunnel run time; the results for a square cross-section wind tunnel are plotted in Figure 4.
11
Figure 4. Theoretical wind tunnel run time plot
It was decided that the test section will have a square cross-sectional area measuring 5”×5”. The predicted run times would be longer than 200 seconds. An interesting note is that the run time predictions for Mach 2 and Mach 2.5 flow are very closely matched. The mass flow rates are roughly the same; for a higher Mach number, the higher required pressure is balanced out by the decreasing sonic throat area.
With the test section size known, the rest of the wind tunnel dimensions were determined and scaled accordingly. The next important design decision made was that the stagnation chamber design of the LRST will be the same as the AST’s design. With the downstream exhaust duct system already in place, this additional constraint would set the length of the rest of the tunnel. The dimensions of the inlet, the nozzle length, the test section length, and diffuser length were determined accordingly and iteratively. The test section and converging-diverging nozzle held priority for available sizing. It was desirable for the test section to be long enough to be a flexible and adaptable testing platform. It was also necessary for the
1 2 3 4 5 6 7 8 9 0 200 400 600 800 1000 1200 1400 1600 1800
Test Section Height (in)
R u n Ti m e ( s ) M=1 M=1.5 M=2 M=2.5 M=3
12
nozzle to be long enough so the tunnel can reach higher Mach numbers with the use of different nozzles. Once a balanced decision was made on the sizes of the test section and nozzle, the inlet and diffuser lengths were determined. A general schematic of the LRST is shown in Figure 5.
Figure 5. Basic schematic of LRST with key section lengths
2.3 High Pressure Air Supply and Storage System
The high pressure air supply and storage system was already in place on the University of Illinois campus when the LRST was designed. This system includes the two compressors, the two dryers, the tank farm, and the piping manifold that feeds the supply air into Aeronautical Lab A. The compressors and dryers are located in the basement of Mechanical Engineering Laboratory. Mechanical Engineering Laboratory is located half a block west of Aeronautical Lab A. Each compressor sends high pressure air through its corresponding dryer. The model specifications of the compressors and dryers are tabulated in Table 3. Photographs of the compressors and dryers are displayed in Figure 6. The air is compressed by the compressors to a maximum pressure of 130 psia. The air then reconnects and is stored in the supply tanks, located just outside the west entrance of Aeronautical Lab A. The volume of the supply tanks is
Stagnation Chamber
29.25”
Inlet & flow conditioning, nozzle, test section
72”
Diffuser 49.313” Air from tanks
13
140 m3. The air is then fed from the tanks into the laboratory through an 8” diameter carbon steel supply air manifold. A picture of the supply air tanks is displayed in Figure 7.
Table 3. Compressors and dryers for the LRST
Compressor Corresponding Dryer
Ingersoll-Rand SSR-1200 Pall type HV Heat-Les Dryer 751HV1 Ingersoll-Rand SSR-HPE300 Ingersoll-Rand DBP-1050
A) B)
C) D)
Figure 6. Compressors and dryers, A) compressor SSR-1200, B) dryer 751HV1, C) compressor SSR-HPE300, D) dryer DBP-1050
14
Figure 7. Supply air tank farm
2.4 Upstream Piping
The AST was already in place in the lab facility before the LRST was designed. Since this facility was already fully operational, and operated at a Mach number reasonably close to the design Mach number of the new rectangular tunnel, the upstream piping design of this facility was emulated for the new supersonic tunnel. As the air is supplied through the manifold, it passes through a transitional piping piece from 8” to 6” in diameter. This piping is Schedule 40, 150# class carbon steel. The air passes through a series of two valves downstream of this transitional piece. The first valve is the manual shutoff valve. This valve is a class 125, 6” iron body gate valve, Crane figure 461. It has a non-rising stem to conserve valuable laboratory space while the wind tunnel is in operation.
The second valve is the automatic control valve. It is a 6” Flowserve Valtek Mark One globe-style pneumatic control valve. The material of the body and bonnet is carbon steel, 150# class. The cylinder actuator is 50 in2. The actuator is controlled by an XL analog positioner. A pair of Siemens flow boosters is also connected to the actuator for augmented performance of the response time. House air,
15
supplied at 80 psig, which passes through a pressure regulator, is used for stroking of the actuator. The house air is supplied both to the positioner and the two flow boosters according to the schematic in Figure 8. The positioner accepts an input current range of 4-20 mA. A 4 mA or lower signal corresponds to a fully closed valve; a 20 mA signal corresponds to a fully open valve. For safety reasons, the valve is configured as fail-close. More in depth technical documentation for the two valves is given in Appendix A.
Figure 8. Flow booster installation schematic with cylinder actuator 21
A schedule 40, 150# class 6” carbon steel piping elbow is connected to the downstream flange of the control valve. The pipe turns 90º towards the floor. Three Female NPT 1” ports are located upstream of the start of curvature of the elbow. One is situated vertically. The other two are situated horizontally on either side of the pipe. Each one is equipped with a ball valve for seeding the flow for optical diagnostic purposes, if needed. At the end of this segment is another piping piece that feeds directly into the stagnation chamber. It is also schedule 40, 150# class. This piece is a 6” pipe passing through a 12” flange and terminates with a 45º elbow turning back towards the direction of the manifold. A photograph of the constructed upstream piping is displayed in Figure 9. The detailed engineering drawing can be found in Appendix B.
16
Figure 9. Upstream piping and stagnation chamber
2.5 Stagnation Chamber
The stagnation chamber of the wind tunnel is a 12” carbon steel, schedule 40, 150# class flanged pipe cross. The pipe cross sits on a 12” flanged pipe of the same material. The top flange of the pipe stand is blind to seal off the pipe cross. Vibrational damping pads (McMaster-Carr part # 60015K41) are situated beneath the pipe stand. The back of the pipe cross is sealed off with another blind flange. The 45º elbow from the immediately upstream 6” pipe feeds the air to the back of the cross, acting as a flow spreader. The centerline of the cross is at a nominal design height of 62.73” off the ground. Note that there is a 1.5” difference between the centerline height of the pipe cross and the aforementioned centerline height of the exhaust system. This offset is due to the inlet cross-section and one-sided nozzle design of the tunnel. The detailed engineering drawing for the stagnation chamber can be found in Appendix B.
17
A custom flange was fabricated for connecting the exit of the pipe cross to the rest of the tunnel. The inlet dimensions are smaller than the pipe cross opening; therefore, quarter-cylinder converging arcs were fabricated and bolted onto the upstream face of the custom flange to prevent the shedding of unwanted vortices downstream into the inlet. The custom flange and converging arcs are made out of aluminum 7075. A CAD rendition of the four converging arc pieces assembled onto the custom flange is shown in Figure 10. An O-ring is situated along the opening on the downstream face of the upstream flange to prevent leaks. The groove is designed for static face seal applications for O-rings of 1/4” fractional width (nominal). The material of the O-ring used is Buna-N.
Figure 10. Upstream flange and inlet converging transitional arcs assembly
2.6 Wind Tunnel
2.6.1 Overview
The portion of the LRST that covers the inlet, the nozzle, and the test section is of paramount importance. It is the heart of the LRST and required the most design work. All of these components and parts were fabricated out of aluminum 7075. Aluminum 7075 was chosen because it offers the desired characteristics of light-weight, high-strength, and relative ease of machinability. The wind tunnel and
18
diffuser are suspended along the center of their I-beam of the lab facility from six turnbuckles with 3/4”-10 pitch thread, made out of galvanized steel. The mass of the tunnel and diffuser was calculated in Autodesk Inventor to be 1020 pounds. The I-beam is able to support a weight of roughly 2000 pounds. The additional weight of the fasteners and turnbuckles do not present a problem to the I-beam’s load capacity. The discussion of this section focuses on the inlet, the nozzle, and the test section. A half-section view of this assembly is shown in Figure 11. The diffuser will be discussed in the following section.
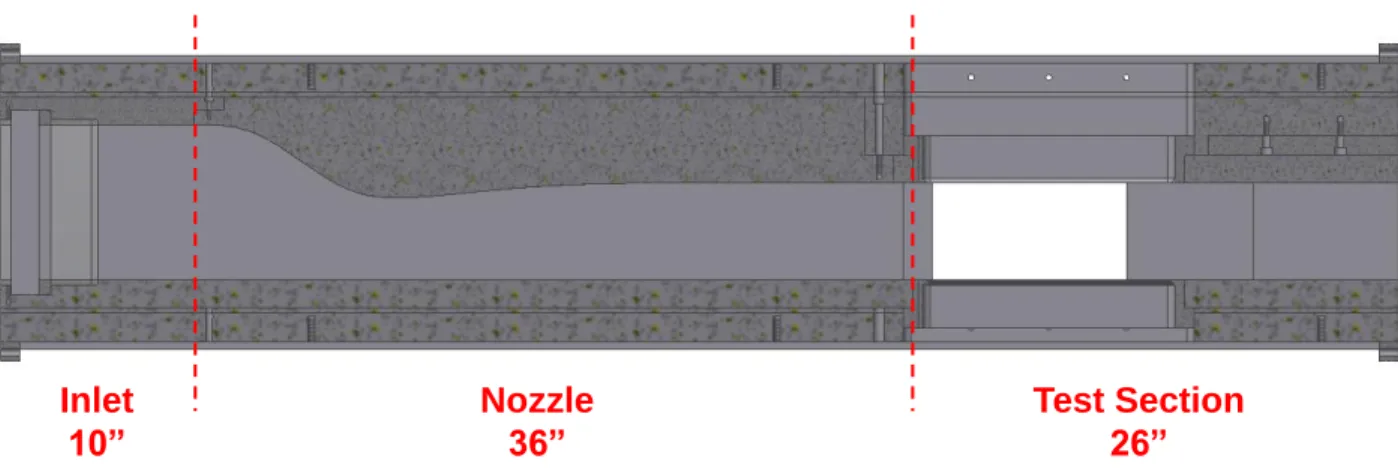
Figure 11. Half-section view of wind tunnel with Mach 1.4 nozzle installed. Lengths of each segment are indicated.
The general assembly configuration of the tunnel can be stated as follows. Four sets of walls of the tunnel are bolted together to produce the rectangular cross section. The converging-diverging nozzle is contoured at only the top wall of the wind tunnel. The side walls are each one complete piece. The top and bottom walls involve more parts and assembly of their own. In both of these cases, there is an exterior plate and a 1/4” shim plate. For the nozzle side, the interior wall is one complete piece. So the non-nozzle wall of the tunnel is composed of three components: the exterior plate, the shim plate, and the interior wall. The wall with the nozzle side has a more complicated configuration. In addition to the exterior plate and 1/4” shim, the interior surfaces are divided into the inlet, the nozzle, and the test section. The test section is further subdivided into separate reconfigurable components. A CAD rendition
Inlet 10” Nozzle 36” Test Section 26”
19
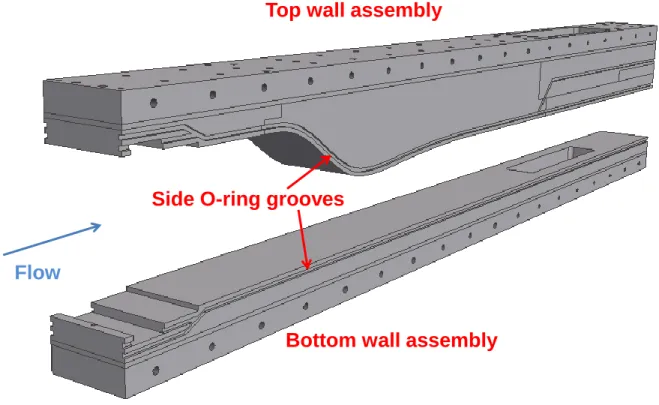
of the top and bottom wall assemblies is shown in Figure 12. Exploded views of the assembly of the wind tunnel can be found in Appendix B.
The different LRST pieces are fastened together by grade 8 steel standard Allen socket head cap screws with black oxide finishes. This section of the wind tunnel is bolted to the upstream flange by means of four mounting brackets, one along the outer edge of each wall. It is similarly bolted to the diffuser’s upstream rectangular plate. O-rings run along the inside edges of the top and bottom surface components to prevent side air leaks, as shown in Figure 12. These O-ring grooves were originally designed for static face seal applications for O-rings of 3/16” fractional width (nominal). However, the width of these O-rings was too large for the side walls to compress properly against. O-ring materials of Buna-N and soft silicon were both tried. In the end, metric size Buna-N O-Ring material of 4.5 mm nominal width was used instead.
Figure 12. CAD rendition of the top and bottom wall assemblies
Flow
Bottom wall assembly
Top wall assembly
20
2.6.2 Inlet and
Flow Straighteners
The air flow from the stagnation chamber enters into the inlet. The inlet dimensions are 8” height by 5” width by 10” length. The inlet has an increased cross-sectional area to reduce the velocity of air in the settling chamber. There is a 0.53” length spacer frame directly at the entrance of the inlet for filling in the distance to the honeycomb. This spacer frame is held in place by slots of depth 0.25” taken from the four interior walls. Honeycomb core is used in the inlet for the first stage of flow conditioning. Slots of 0.4” depth were machined into the side walls and slots of 0.75” depth were machined into the interior top and bottom walls to hold the honeycomb in place.
Two honeycomb options were explored in the process of developing the LRST. The old honeycomb failed twice after a number of test runs. A photograph of the second damaged honeycomb core is exhibited in Figure 13. A comparison of the characteristics of the old and present honeycomb is presented in Table 4. It should be noted that the exact material of the present honeycomb core is not known, but it is definitely significantly stronger than the old honeycomb. No evidence of damage to the new honeycomb has been found so far at the time of this writing.
21
Table 4. Comparison of old honeycomb with present honeycomb
Old honeycomb Present honeycomb
Material Aluminum Stainless Steel (high certainty)
Cell size (inches) 0.25 0.115
Cell wall thickness (inches) 0.0025 0.0065
% open area 97% 86%
Thickness (inches) 2.00 1.40
The new stainless steel honeycomb section is not as thick as the old honeycomb. Therefore, an additional frame of length 0.6” for the honeycomb slot was fabricated so that the new honeycomb could be installed correctly.
At a distance of 2.1” downstream of the honeycomb frame, wire screens act as the second stage of flow conditioning. The selection of the screen was largely guided by Reshotko 22. The technical form of the screens is woven wire cloth. Its material is stainless steel type 316. The wire diameter is 0.0065”, and the square/rectangle size is 0.0229”. The area is 60.7% open. The screen is sandwiched between two separate frames. The two frames and screen are bolted together by #6-32 UNC socket cap screws. The frames are held in place in the inlet by slots of depth 0.25” on the four interior walls. The flow conditioning components terminate 5” into the length of the inlet. The rest of the inlet is an open area of 8” in height and 5” in width for settling the flow before the nozzle.
2.6.3 Nozzle
Following the inlet is the nozzle. The nozzle is a one-sided surface contour. The total nozzle length is 36". Two nozzles were designed and fabricated. One was designed for a Mach 1.4 flow, the other was designed for a Mach 2 flow. It was known beforehand that energy losses, ideal and non-isentropic conditions, and boundary layer growth in experimental testing would reduce the total energy and available area of the flow. This essentially decreases the actual Mach number produced in the test
22
section. To compensate for this, the actual design Mach number for the nominal Mach 1.4 case was in reality 1.5. Similarly, the actual design Mach number for the nominal Mach 2 case was in reality 2.15.
As the desired Mach number in the test section is dictated by the area ratio of the throat to test section area, the throat height for a given Mach number-producing nozzle was first calculated. Equation (4) was utilized, assuming γ=1.4, and A=25 in2. For M=1.5, A*=21.255 in2; for M=2.15, A*=13.031 in2. The throat height is then simply given by A*/5, for a 5” wide rectangular cross section. The converging, or subsonic portion of the nozzle was then designed by fitting the contour according to the 5th order polynomial spline of equation (5), where x and y are the Cartesian coordinates, h is the height of the contour at the throat, and L is the total length of the spline 22, 23. L is taken to be 1.25 times the larger inlet dimension, which would make L=10 inches in this case. An example of the spline and the geometrical constraints at the two ends in which the gradient and curvatures must be smooth is shown in Figure 14.
3 4 5
( )
10
x
15
x
6
x
y x
h
L
L
L
(5)Figure 14. Subsonic nozzle portion spline and constraints
x=0 x=L
y(0)=y’(0)=y’’(0)=0
y’(L)=y’’(L)=0 y=h
23
The diverging, or supersonic portion of the nozzle was designed by employing a computer program called “Nozcs” that utilizes the method of characteristics. This program outputted contour coordinates of the diverging portion of the nozzle normalized to the nominal throat height. To obtain the dimensional full-size coordinates, the normalized coordinates were simply multiplied by the throat height. Piecing the subsonic portion coordinates together with the supersonic portion yields the contour coordinates for the nozzle profile. These coordinates were used for both the CAD design in Autodesk Inventor and for the fabrication by machinists. CAD models of the two nozzles are shown in Figure 15. It is interesting to note the differences in the contours and the throat height.
Figure 15. CAD renditions of the produced nozzles
Horizontal segments were added to the profiles at the end of the diverging portions to complete the total required 36” of the nozzle. This was done because the length of the diverging portion of the nozzle, where the contour actually has curvature, is dependent on the design Mach number. A larger Mach number design will have the divergence terminate farther downstream and closer to the full 36” than a lower Mach number design. For the specific case of the LRST, the converging portion is always 10”. With the addition of the diverging portion, the total length of the nozzle will not exceed 36” unless approaching a design Mach number of 3.55. Therefore, a conservative estimate of the upper limit of the LSRT’s speed capability is around Mach 3.
Mach 1.4 nozzle
24
2.6.4 Test Section
Downstream of the nozzle is the test section. The test section of the wind tunnel is 26” long. Due to the single-sided nozzle design of the wind tunnel, there is a 3” thick layer of material on the wall of the nozzle-side to account for the difference between the height of the test section and the inlet. This extra volume of material is called the outer test section piece on the nozzle-side. The complementary piece, the inner test section piece on the nozzle-side, is bolted onto the outer piece to form the test section surface of the top wall. In addition, a section of 9.8 inches by 0.99 inches was machined from the outer piece to produce a replaceable cavity, called the flat spacer. A CAD rendition of the test section top wall assembly is shown in Figure 16. This side of the test section offers great flexibility for reconfiguring various experimental setups. There is available space for the use of expanding diffusers, cavities, etc. The other three walls of the test section are each individual single pieces that span the entire length of the wind tunnel section, and so geometrical reconfiguration for testing models and setups will be impractical on these walls.
Figure 16. Rectangular test section color-coded assembly
Nozzle
Outer piece
Inner piece Flat spacer
25
Substantial optical access to the test section was a key design factor for the wind tunnel. All four of the walls have openings for optical access to the test section. The openings for the two side walls are identical. These opening dimensions are 18” in length, and 10” in height. The openings for the top and bottom walls are also identical. These opening dimensions are 14” in length, and 2.5” in width. It would be possible to use these openings for inserting specifically machined test section setups and models. In the original configuration of the wind tunnel, however, test section windows were designed and fabricated for optical access.
2.6.5 Windows
The top and bottom windows have an effective viewing area measuring 12.50” in length by 1” in width. The side windows have an effective viewing area measuring 10” in length by 7” in height. The viewing area of the side windows is not centered in the streamwise direction of the window frames. However, these window frames can be flipped around in their side wall slots, depending on where the point of interest is in the test section. This ability yields a total effective side viewing length of 15”. The window frames are made from aluminum 7075. During normal wind tunnel operating conditions, the test section pressure will become sub-atmospheric. The slots for the glass on the frames are beveled as a cautionary measure to prevent the window glass from being sucked into the test section. The material of the window glass is BK7 optical quality glass. The glass thickness for the top, bottom, and side windows is 0.75”. This thickness was calculated from Pope 7
, using a safety factor of 10. The window glass was epoxied into the frames with 3M Scotch-Weld Two-part 2216 Gray Epoxy.
2.7 Diffuser
Downstream of the test section is the diffuser. The diffuser is also made from aluminum 7075. Its total length is 49.313”. The central part of the diffuser is assembled by bolting the top, bottom, and side
26
walls together. There is an upstream rectangular plate that fastens these four walls together, and is also responsible for joining the upstream tunnel to the diffuser. There is also a downstream flange that fastens the four walls of the diffuser together at the other end. O-rings are situated on the axial faces of the upstream rectangular plate of the diffuser, and the downstream diffuser flange. These grooves are designed for static face seal applications for O-rings of 1/4” fractional width (nominal). The material of the O-rings used is Buna-N.
The main purpose of the diffuser is to decelerate the supersonic flow from the wind tunnel, so that the air can recover close to atmospheric conditions again before being exhausted outside of the facility. This deceleration is achieved by designing the diffuser with a 6º total expansion, according to the diffuser handbook 24. The diffuser was also designed with the flexibility of having more than one configuration. In similar fashion to the test section design, which has an excess of material on the nozzle-side, the diffuser was also designed with extra material on the nozzle-side. This gives the capability for reconfiguring the diffuser to accommodate expansion ramps from the test section.
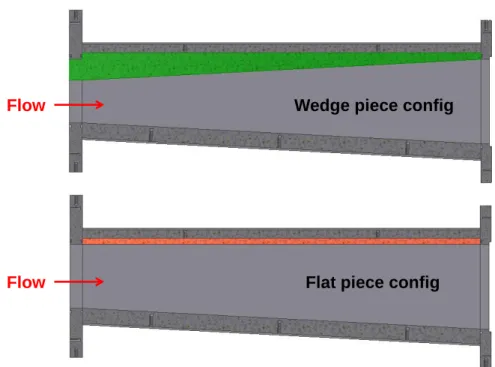
The interior wall of the diffuser on the nozzle-side is an interchangeable piece that bolts onto the exterior plate on the top side. The first fabricated interior component was a wedged shape piece with a step in it. The ramp of this wedge expands by 3º. The second interior component fabricated was simply a flat plate that lined the top wall of the diffuser. For the original 5” square test section area configuration, the interior wedge piece was used. The wall on the non-nozzle, or bottom side, expands by 3º, giving the combined total expansion of 6º. The two different diffuser configurations are illustrated in Figure 17.
27
Figure 17. Diffuser configurations, with interchangeable pieces color-coded
2.8 Downstream Ducting and Gate Inserts
The downstream flange of the diffuser is joined to the existing exhaust duct system by a steel spiral duct elbow. The exhaust system consists of a steel spiral duct that also channels the exhaust air from the AST, as shown in the photograph of Figure 18. This duct system then turns outside of the laboratory building, and is joined by carbon steel piping that turns the flow vertically upwards. The air passes through a muffler and exits above the lab building. A weather cap is used to shield the interior of the exhaust system from weather hazards. A photograph of the exhaust piping outside the lab is shown in Figure 19.
Flow
Flow
Wedge piece config
28
Figure 18. Aeronautical Lab A wind tunnel exhaust duct system
Figure 19. Aeronautical Lab A external exhaust piping
Elbow
Spiral duct AST diffuser
LRST diffuser
Flow Flow Flow exits building
29
The main concern for the exhaust system is that it is shared by both the LRST and AST. As one wind tunnel is in operation, the other wind tunnel must be isolated from the exhaust duct to prevent air from being blown upstream into it. A convenient and efficient way was needed to switch between operation of the two tunnels. Design modifications on the downstream diffuser flanges of both the LRST and AST were made to accomplish this. Slots were machined on the downstream faces of the flanges for special gate inserts. Two gate inserts were fabricated for each wind tunnel, as depicted in Figure 20.
Figure 20. Modified flange, A) flange alone, B) with open gate, C) with closed gate
One gate insert is termed the “open” gate insert, which would be inserted into the flange of the tunnel that will be in operation. This insert essentially has an open hole of the same opening area as the flange to allow the passage of air. The other gate insert is termed the “closed” gate insert, which would be inserted into the flange of the tunnel to be blocked off from the air flow. The face of the “closed” insert is blind. The upstream surface of the “closed” insert has two relief channels to provide minor relief for air pressure buildup upstream of the flange. The gates are designed so that they can be slotted in and out from the flanges after removing and loosening some of the bolts joining the flanges to the steel duct. The inserts are fastened onto the flanges again by the same bolts.
30
2.9 CAD Illustrations
The LRST’s inlet, nozzle, test section, and diffuser were all designed and modeled using Autodesk Inventor. CAD renditions of these parts of the tunnel are displayed in Figure 21 and Figure 22. The detailed engineering drawings, along with exploded views of the more intricate assemblies can be found in Appendix B.
Figure 21. Side half-section view of wind tunnel and diffuser assembly
31
Chapter 3
Wind Tunnel Operation and Testing
3.1 Data Acquisition Hardware – Sensors, Instrumentation, Control Box
Measurements of pressure and temperature are taken during wind tunnel operation. The pressures that are measured are the test section static pressure, the stagnation chamber pressure, and the tank farm pressure. The stagnation temperature is also measured. The information from each sensor is sent to a digital meter display and to the National Instruments (NI) data acquisition module. The digital display meters are simply used to facilitate the operation of the wind tunnel. The actual raw pressure and temperature data are collected and stored on the personal desktop computer through the NI hardware and software interface. A National Instruments data output module is also used to send a current signal to open and close the control valve. The National Instruments hardware is mounted to a USB chassis that communicates with the personal desktop computer. All of these hardware components are enclosed in a steel instrument enclosure case, as shown in Figure 23. A detailed summary of the sensors, display meters, and data acquisition hardware is provided in Table 5.
A) B)
32
Table 5. Component list of measurement and controller module
Quantity Part Use
1 NI cDAQ-9174, CompactDAQ chassis USB chassis for the NI input and output modules
1 NI 9201 8-channel, analog input module Voltage input module for pressure and temperature readings
1 NI 9265 4-channel, current output module Current output module for controlling the Valtek valve
1 Omega PX309-200A5V Pressure transducer for tank farm
1 Omega PX409-100A5V Pressure transducer for stagnation chamber
1 Omega PX409-015A5V Pressure transducer for test section
3 Precision Digital PD765-6R2-10 Pressure meter displays
1 Omega TJ72-ICSS-116E-4 Thermocouple for stagnation chamber
temperature
1 Omega DP26-TC-A Temperature differential meter display
3.2 Safety Considerations
There are a number of aspects of safety that need to be taken into consideration when running a supersonic wind tunnel. One of the more obvious concerns is the high pressure air system throughout the entire facility. Eye protection must be worn during all times of operation. Additionally, the pressurized air passing through the piping and tunnel generates high levels of aerodynamic and turbulent noise. Therefore ear protection must also be worn during all times of operation.
The sharing of the exhaust system by the two supersonic wind tunnels in Aeronautical Lab A is one of the larger safety concerns of the lab facility. As mentioned in section 2.8, gate inserts were designed to increase the efficiency of switching between the operation of the two tunnels. However, this leaves the possibility for human error to run one of the tunnels with the incorrect gate inserted downstream. The gate should always be open for the active tunnel, and closed for the other idle tunnel. The most catastrophic case of having the incorrect gates installed would be having the closed gate installed downstream of an active tunnel. The pressure build up could potentially cause great harm to the
33
personnel working in the laboratory. It could also cause great damage to any equipment in the laboratory, and it could damage the wind tunnel itself.
Several different levels of safety checks were implemented. The first safety measure taken was relatively basic. The different gates were color-coded to reduce human error. The open inserts were painted green on the sides; the closed inserts were painted red on the sides. This visual difference should help to distinguish the different gate inserts.
The second level of safety check was the installation of switches between the circuitry of the control valves of the AST and LRST. The type of switch installed is a key-actuated safety switch. It is a double-pole, single-throw switch. Before switching, one circuit is normally open, and the second circuit is normally closed. The two circuits are controlled by one single mechanical actuation of the key; the circuits switch when the key is inserted into the housing of the switch. One switch was installed on each of the downstream diffuser flanges of the AST and LRST. The key for each switch is attached to the respective open gate insert of each tunnel by a nylon-coated stainless steel wire. The control valves for the two tunnels are both configured as fail-close. If the electrical connection is open, the valve will automatically close. The electrical circuits for the two control valves are interlinked according to Figure 24.
Figure 24. Circuit for the control valves of the AST and LRST. In the current case, a key is inserted in switch 1, and not inserted in switch 2. Hence, the LRST is operational, while the AST is idle.
LRST control valve AST control valve
Key switch 1 Key switch 2
+
-+
-34
Basically a tunnel can only operate if its key is inserted into its switch at the duct entrance, while the other key is not inserted into the second switch on the other tunnel. As the keys are only attached to the open gate inserts, this setup eliminates the possibility of the most catastrophic scenario occurring. The tunnels will never become over-pressurized due to a gate insert error.
The key switch is a preventative measure that comes into effect before the wind tunnels start operating. In the event that the LRST does become over-pressurized for whatever reason, there are safety checks to automatically shut off air to the tunnel system anytime during operation. Relay switches have been programmed into the digital display meters of the control box. A switch has been programmed into the digital meter measuring the stagnation pressure. If the stagnation pressure ever exceeds the threshold of 50 psia, the switch is tripped, and the circuit that controls the control valve is opened. The valve will then automatically shut. Another switch has been programmed into the digital meter measuring the test section static pressure. The threshold value for this relay is set at 15 psia. If this value is exceeded, the valve automatically shuts. In addition, this same type of safety check has also been implemented in the LabVIEW code for running the wind tunnel. At any time during operation, if the measured stagnation pressure and test section pressure exceed 50 psia and 15 psia, respectively, the algorithm will close the valve.
3.3 LabVIEW
National Instruments’ software package, LabVIEW, was used to create a program that controls the operation of the wind tunnel. The program is responsible for acquiring the pressure and temperature measurements of the tunnel, and for controlling the control valve to achieve desired run conditions. The LabVIEW Virtual Instrument (VI) acquires the pressure from the tanks, the stagnation chamber pressure, the test section pressure, and stagnation temperature at all times during operation. The VI also records the magnitude of current outputted to the control valve. These values can be saved at the end of each run at
35
the option of the user. A screenshot of the front panel of the VI is shown in Figure 25. There are two options for running the LRST through LabVIEW, automatic mode and manual mode. Manual mode is used when the user wants full control over the control valve. The user is able to decide exactly the amount of current to output to the valve at any point in time. It essentially works by opening and closing the valve manually. This mode is less commonly used as it is only effective for specific run purposes.
Automatic mode aims to open the valve to maintain the stagnation pressure at a user-defined set point. Designing the automatic controller for the LRST was a significant challenge. The air flow system is unsteady and nonlinear in nature. The compressors cannot pump air into the tanks as fast as the wind tunnel consumes it.
36
To maintain the stagnation pressure at a specific set point, the valve must be opened faster towards the end of runs when the pressure in the tanks is lower. A small rise time, high accuracy, and nonlinear controller could not be developed by implementing a simple proportional-integral-derivative controller.
The automatic controller algorithm is divided into two stages. The initial stage is responsible for opening the valve to the neighborhood region of the set point. The main purpose of this phase is to decrease the rise time of opening the valve, so consumption of air during startup is minimized, and run time is maximized. It employs a two-dimensional bicubic spline interpolation scheme based on pre-calibrated data. The two inputs into this portion of the algorithm are the desired stagnation pressure set point and the initial tank pressure. The output is the magnitude of current to be sent to the control valve. This phase only lasts for 2.5 seconds in the original code.
The second phase of the automatic controller operation is a customized feedback controller. The feedback that this algorithm takes in includes the instantaneous tank pressure and the instantaneous stagnation pressure. The error between the target stagnation pressure and the measured stagnation pressure is multiplied by a proportional multiplier, and the product is used to adjust the magnitude of current sent to the control valve. This proportional multiplier changes based on a function of the ratio of the current tank pressure to the initial tank pressure. This makes the controller more aggressive towards the end of runs when air supply is low. Another key characteristic of the controller is that it can only operate in one direction; under the operation of the controller, the valve will only be able to open further or remain at the current point, but it will not be able to close. This can be allowed because the LRST will always consume the supply air at a faster rate than it can be replenished. This particular characteristic decreases tendencies of oscillation about the set point.
Finally, there are a few important caveats and nuances that should be mentioned regarding the LabVIEW controller. The original starting proportional multiplier value should be fine-tuned for varying stagnation pressure targets. For a target ranging around 24 psia, the initial multiplier value of 5e-6 worked
37
well. This kept the standard deviation of the stagnation pressure around 0.10 psia. For a target ranging around 19 psia, the initial multiplier value of 2.38e-6 worked well. This kept the standard deviation of the stagnation pressure under 0.08 psia. A sample time plot of the measured stagnation pressure during a trial run with an automatic control target of 24 psia is shown in Figure 26.
Regarding the temporal resolution of acquiring and outputting data in the VI, there is an inherent overhead time of around 100 ms for each iteration loop. This large overhead time is primarily due to the hardware use of the USB DAQ interface. Regarding the performance of the controller with relation to which compressor is turned on, the standard deviation of the stagnation pressure remains around the same magnitude independent of the number of working compressors. What is affected is the accuracy of the achieved pressure. The achieved stagnation pressure in the case with one compressor is slightly lower than the pressure achieved with two compressors.
Figure 26. Sample automatic controller performance test run. Target stagnation pressure=24 psia.
0 20 40 60 80 100 120 140 14 16 18 20 22 24 26 Time (s) S ta g n a ti o n P re s s u re ( p s ia )
38
Chapter 4
Experimental Flow Diagnostics Setup
4.1 Pressure and Temperature Measurements
The pitot tube for measuring the stagnation pressure is located downstream of the flow conditioning screen and upstream of the converging portion of the nozzle. The pitot probe is simply a 1/8” stainless steel tube bent 90° upstream facing the incoming flow. It is held in place on the right side wall with a modified 1/4” male pipe-to-tube, double-sleeved compression fitting adapter. The hole on the pipe side of the fitting was enlarged to allow the 1/8” tubing to pass through it. The thermocouple responsible for measuring the stagnation temperature is located below the pitot probe. It is also held in place on the side wall with the same type of modified compression tube fitting. Figure 27 shows the pitot tube and thermocouple mounted on the side wall of the wind tunnel. In order to measure the static pressure of the test section, a static pressure tap was machined in the top and bottom window frames. 1/8” stainless steel tubing was epoxied into the pressure tap slot with 3M Scotch-Weld Two-part 2216 Gray Epoxy.
Figure 27. Pitot probe and thermocouple on side wall
4.2 Schlieren Photography
Schlieren imaging was used as the basic visual diagnostic technique to qualitatively identify flow structures in the test section. Schlieren imaging utilizes the refraction of light to detect density gradients
39
in the flow field. It can therefore illuminate unique flow structures such as shock waves, expansion fans, turbulent eddies, and other flow structures. Schlieren imaging works by passing collimated light through the test section perpendicularly. The light will bend towards the normal of the regions with higher densities. Through a series of optics, the light exiting the test section is then refocused down to a focal point. At this point in space a knife edge is placed to strategically block the rays of light that are bent. The light is then captured by a camera. Since parts of the light rays are blocked with the knife edge, the captured image will show lighter regions in which the light bends away from the knife edge; the darker regions indicate where the light bends into the knife edge. The direction of density gradients emphasized through Schlieren photography is dependent on the orientation of the knife edge. A horizontal knife edge emphasizes vertical density gradients; a vertical knife edge emphasizes horizontal density gradients.
Schlieren imaging was used to both characterize the LRST and to perform diagnostics on the flow-control device afterwards. The Z-type setup was used in both cases. A general schematic of the setup is shown in Figure 28. It should be noted that the apparatus used for tunnel characterization differed somewhat from the apparatus used in the μVG experiments. The apparatus and setup discussed here pertain to the experiments performed on the μVGs. The light source used was a Xenon Corporation- model 437B nanopulser. A flat mirror with 2” diameter (not shown in the figure) redirected the light from the source onto a 12” diameter parabolic mirror with 8’ focal length, manufactured by Edmund Optics. This first parabolic mirror was strategically positioned at its focal length away from the light source so it will reflect collimated light. The collimated light shines through the test section and hits an identical parabolic mirror on the other side of the wind tunnel. The reflected light from the second parabolic mirror hits a 2” square flat mirror, which is directed over the knife edge and into the camera. The knife edge is strategically placed at a distance of 8’ from the second parabolic mirror. The camera is a charged couple device (CCD) PCO 1600 camera that connects to the computer through an IEEE 1394 FireWire cable. An NA C-mount adapter was used for mounting the Nikon Nikkor 135 mm, F# 2 lens on the camera. The camera exposure time was set to 5 µs.
40
Figure 28. Schematic of a Z-type schlieren setup 19
4.3 Surface Flow Visualization
Surface flow visualization was used to both characterize the tunnel and perform experiments on the flow-control devices. The oil mixture consisted of STP oil treatment, SAE 10W-30 motor oil, and fluorescent leak detector dye. The fluorescent dye is illuminated under black light. In order to obtain sufficient contrast between the test section surface and the oil, the aluminum surfaces of the test section were spray-painted with a black automobile primer.
The first use of surface flow was for characterizing the corner flows of the LRST. A portion of the test section surfaces surrounding a corner edge was spray-painted black. A 50/50 mixture of STP and motor oil with a few drops of fluorescent dye was then applied on the surface of this region. After the wind tunnel finished running under fully started conditions, a digital photograph was taken from the side window slot at an oblique angle.
The second use of surface flow was for observing the effects of the flow-control devices. The camera used was a PCO 1600 CCD camera. The lens used was an M2514-MP, 25 mm, F# 1.4, 2/3”
41
diameter lens. The camera exposure was set to 5 ms for all cases. The camera viewed the top surface of the test section through the bottom window. Black lights illuminated the test section through the side windows while the wind tunnel was running.
Three cases were investigated. The first two cases investigated the surface at the expansion shoulder, or the start of the diffuser. The wind tunnel was run with the conditions such that the normal shock was to be positioned at the shoulder. Before these runs, the spray-painted test section surface was first wiped down with motor oil. A 50/50 mixture of STP and