Mind Maps and Scoring Scale for Environmental Gains in Science
Education
Özgül Kele
ş
Aksaray University (Turkey)
ozgulkeles@gmail.com
Abstract
Elementary level science and technology program was developed based on constructivist approach. For students to achieve the objectives set by the program, student-centered teaching methods and techniques should be employed. One of these techniques is mind maps. Given the effects of mind maps on meaningful learning, it is believed that they can be an effective teaching method for students to acquire new information and raise their awareness of the current environmental problems. For students who will be our future to be individuals who can find solutions to these environmental problems and discuss the possible outcomes of these problems, teachers need sample materials to be used to help their students to achieve the target environmental gains. Though the number and severity of the local, national and global problems are rapidly increasing, the number of materials to be used to help students to achieve environmental gains in the class is limited in Turkey. Thus, the present study aims to develop sample mind maps that can be used by teachers while teaching environmental issues. Within the framework of the present study, first, the content of the environmental topics included in the science and technology curriculums of 6th, 7th and 8th graders was analyzed. Among the topics included in these curriculums, mind maps were developed for ecosystem, biodiversity and animals, water, water pollution, air pollution, acid rain, soil, soil pollution, light pollution, recycling and global warming. Moreover, in order to evaluate the students’ ability to use mind maps, sample “Mind Map Scoring Scale” was developed and its development stages were presented. The mind maps developed within the framework of the present study are believed to be samples for the practitioners who want to teach basic concepts related to today’s global and local environmental problems.
Keywords: mind map, mind map scoring scale, environmental education, science and technology
1. Introduction
Elementary level science and technology program was developed based on constructivist approach. For students to achieve the objectives set by the program, student-centered teaching methods and techniques should be employed. Because of this teachers utilize various instructional strategies to be effective in assisting students’ learning. One of these techniques is mind maps. Mind mapping is a note-taking, organizational technique, which allows individuals to “organize facts and thoughts” in a map format. It allows an individual to manipulate pictures, create relationships, and arrange information in various hierarchical, vertical, and horizontal positions [1].
During teaching and learning, a mind map also helps teachers to explain why they are focusing on a particular aspect of a topic. From the mind maps that students make, teachers may learn whether their students understand the topic and whether the student is able to organize and construct a suitable structure for that knowledge. So it is a very useful tool for the teaching of environmental science and also as a powerful device for the student in constructing a framework for making sense of that knowledge. The knowledge base of environmental science has proved difficult for students to
comprehend, for a number of reasons [2]. Education starting from the primary school has an important role in imparting environmental thought, attitude and responsible behavior to children, and transforming love for nature and sense of environmental protection into permanent behaviors and life style. Environmental education is process of clarifying thoughts and approving values to develop important attitudes and skills for people to understand and appreciate the relations between the culture and bio-physical environment [3]. Environmental education given at schools has an important role in the education of environmentally sensitive generations and having a sustainable future [4]. Due to rapidly increasing local and global environmental problems, environment education has gained great importance for the well-being of the future generations. Though it is a well-known fact, the number of the visual and instruction materials that can be used by teachers for environment education is highly limited. Mind maps can be highly effective teaching materials as they enable students to make connections among environment-related concepts, to develop creative solutions to environment problems, to remember and retain the information gained for longer periods. From the viewpoint of teachers, it is believed that mind maps can have great contributions to their effort to achieve the objectives of environment education by helping to summarize the subjects and facilitate meaningful learning and improve creativity. However, given that teachers have great difficulties in finding ready-to-use materials suitable for the subject they teach, design of such mind maps to be ready-to-used by teachers in their lessons to teach the environment-related concepts will be great support to teachers’ teaching effort. Hence, the aim of the present study is to develop ready-to-use mind maps to be used by teachers while teaching environment-related subjects in their courses. With the renewal of teaching programs, one of the alternative assessment techniques, rubrics started to be used. It is believed that teachers will need sample rubrics to give them some insight when they want to evaluate student made mind maps. Therefore, second aim of the study is to present a sample mind map scoring scale to inform teachers about evaluation criteria.
2. Methodology
Within the framework of the present study, first, the content of the environmental topics included in the science and technology curriculums of 6th, 7th and 8th graders was analyzed. When the program of the science and technology course given at 6-8 grades is investigated, it is seen that the environment-related subjects are presented in six units. Within these units, the intention is to inform students about national and international environmental problems, connections between living organisms and energy, recycling and renewable and non-renewable energy sources, space pollution, water pollution, land pollution and global warming. In order to support the teaching of these topics, sample mind maps were developed by the researcher. Among the topics included in these curriculums, mind maps were developed for ecosystem, biodiversity, water, water pollution, air pollution, acid rain, soil, soil pollution, light pollution, recycling and global warming. These mind maps were shared with the science and technology teachers (with job experience ranging from 1 to 15) from three different elementary schools in Aksaray. Based on the feedback taken from the teachers, required corrections were made on the mind maps and final forms were given. Moreover, in order to evaluate the students’ ability to use mind maps, sample “Mind Map Scoring Scale” was developed and its development stages were presented. While designing the mind map scoring scale (evaluation rubric), mind map evaluation rubrics in the literature and the opinions of the teachers having examined the mind maps were used. While constructing the performance criteria of the rubric designed for the purpose of evaluating students’ mind map using skills, steps proposed by Buzan (2002) to be used to create a mind map were flowed. The sample mind map scoring scale was developed in the form of a four-point Likert type scale consisting of 12 performance criteria.
3. Findings
The mind map samples developed within the context of the present study are presented below: due to page limitation, some of the mind map samples are not given here, yet, they will be shared with the participants during the presentation.
Fig.1. Mind map for the concept of global warming
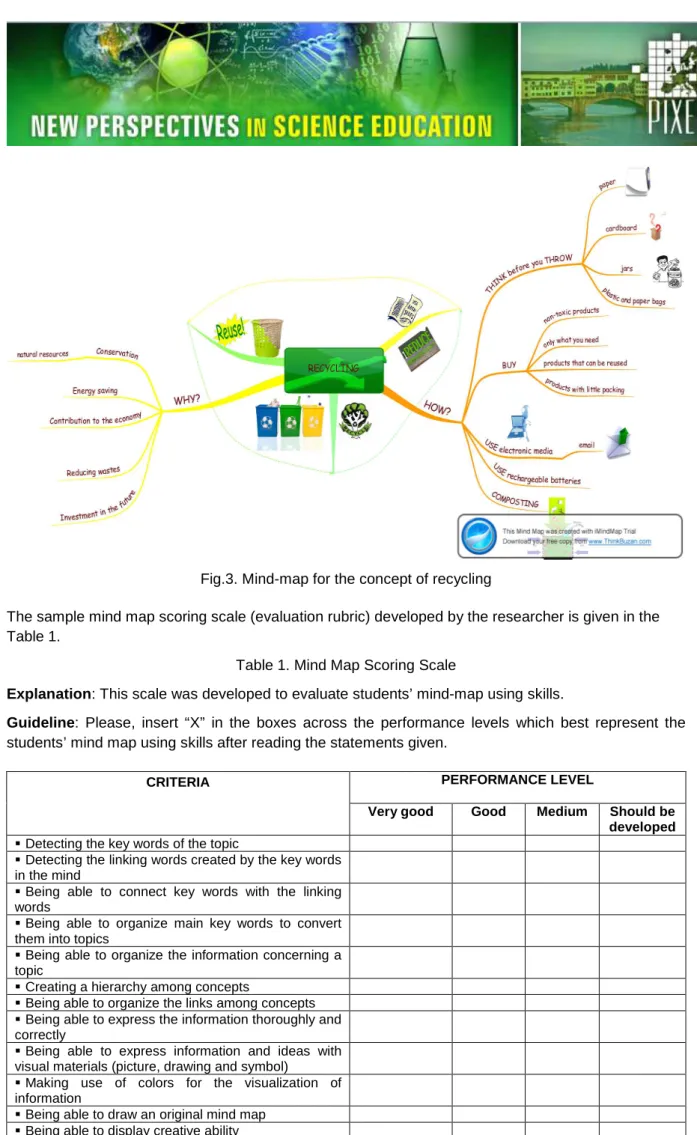
Fig.3. Mind-map for the concept of recycling
The sample mind map scoring scale (evaluation rubric) developed by the researcher is given in the Table 1.
Table 1. Mind Map Scoring Scale
Explanation: This scale was developed to evaluate students’ mind-map using skills.
Guideline: Please, insert “X” in the boxes across the performance levels which best represent the students’ mind map using skills after reading the statements given.
CRITERIA PERFORMANCE LEVEL
Very good Good Medium Should be developed
Detecting the key words of the topic
Detecting the linking words created by the key words in the mind
Being able to connect key words with the linking words
Being able to organize main key words to convert them into topics
Being able to organize the information concerning a topic
Creating a hierarchy among concepts
Being able to organize the links among concepts Being able to express the information thoroughly and correctly
Being able to express information and ideas with visual materials (picture, drawing and symbol)
Making use of colors for the visualization of information
Being able to draw an original mind map Being able to display creative ability
4. Conclusions and Discussions
In the present study, sample mind maps for environmental concepts and evaluation rubric to evaluate these maps were developed to give support to the teachers of science and technology. In line with the constructivist approach, teaching materials and equipments should be developed for teachers to realize their roles as guide and facilitator in teaching of environment-related topics. By using concept and mind mapping methods, the students’ active and collaborative learning approaches are emphasized, and their skills of sense making and knowledge integration within a multi-disciplinary subject are developed. The constructivist teaching models, if used in the teaching of environmental science, can give the students a broader perspective on the ways in which the different aspects of our human environment interact with each other, and provide the student with the relevant skills and abilities to become the effective environmental managers of the future which are so urgently needed. Therefore, it is important, effective and useful for students to structure their understanding of environmental concepts in a way which can help the students to be effective note takers and which can generate new ideas and associations that they have not thought of before [2]. Graphic organizers assist learning by providing an opportunity for visual stimuli, brainstorming, recording information in a nonlinear fashion, assessment, checking understanding, problem solving, elaboration, creating analogies, note taking, summarizing, illustrating sequence of events, and other creative ways of instruction [5], [6], [7]. There are studies showing that mind maps contribute to longer retention of the information through mind maps [8], [9], [10]; help students to see the connections among the pieces of information [11], [12]; enable students to create meaningful links among the pieces of information presented in texts [13]; enhance students’ academic achievement and support the formation of conceptual understanding [14] and how the mind map assessment systems should have[15], [16]; in light of these findings, mind maps are thought to be useful for teachers while teaching enviromental concepts. The present study is limited to the units covering environmental issues. Hence, it is believed that there is a need for further research to investigate the use of mind maps in teaching different topics. Moreover, there is a need for further studies including the applications of various techniques to provide samples to be followed by teachers.
References
[1] Buzan, T. (2002). How to mind map. Great Britain: Thorsons.
[2] Zhao, Y. (2003). The use of a constructivist teaching model in environmental science at Beijing Normal University. The China Papers, July, 78-83.
[3] Palmer, J. (1998). Environmental education in the 21st century: Theory, practice, progress and promise. New York: Routledge.
[4] Loughland, T., Reid, A., Walker, K., & Petocz, P. (2003). Factors influencing young people’s conceptions of environment. Environmental Education Research, 9(1), 3-20.
[5] Bromley, K., Irwin-DeVitis, L., & Modlo, M. (1995). Graphic organizers: Visual strategies for active learners. New York, NY: Scholastic Professional Books.
[6] Gregory, G.H., & Chapman, C. (2002). Differentiated instructional strategies: One size doesn’t fit all. Thousand Oaks, CA: Corwin Press, Inc.
[7] Treviño, C. (2005). Mind mapping and outlining: Comparing two types of graphic organizers for learning seventh-grade life science. Texas Tech University: Unpublished PhD Thesis.
[8] Buzan, T. (2005). Mind map handbook. Great Britain: Thorsons.
[9] Akınoğlu, O., & Yaşar, Z. (2007). The effects of note taking in science education through the mind mapping technique on students’ attitudes, academic achievement and concept learning. Journal of Baltic Science Education, 6(3), 3443.
[10] Keleş, Ö. (2011). Elementary teacher’s views on mind mapping. International Conference on New Horizons in Education Conference Proceedings Book, 348, 8-9 June, Portugal.
[11] Evrekli, E., Balım, A.G., & Inel, D. (2009). Mind mapping applications in special teaching methods courses for science teacher candidates and teacher candidates’ opinions concerning the applications. Procedia Social and Behavioral Sciences, 1, 2274–2279.
[12] Evrekli, E., & Balım, A. G. (2010). Fen ve teknoloji öğretiminde zihin haritası ve kavram karikatürü kullanımının öğrencilerin akademik başarıları ve sorgulayıcı öğrenme becerileri algılarına etkisi. Batı Anadolu Eğitim Bilimleri Dergisi (BAED), 1(2), 76-98.
[13] Brinkmann, A. (2003). Graphical knowledge displaymind mapping and concept mapping as efficient tools in mathematics education. Mathematics Education Review, 16, 3548.
[14] Mona, I., & AdbKhalick, F. (2008). The influence of mind mapping on eighth graders’ science achievement. School Science and Mathematics, 108(7), 298312.
[15] Evrekli, E., Inel, D., & Balım, A. G. (2010). Development of a scoring system to assess mind maps. Procedia Social and Behavioral Sciences, 2(2), 2330-2334.
[16] D’Antoni, A. V., Zipp, G. P., & Olson, V. G. (2009). Interrater reliability of the mind map assessment rubric in a cohort of medical students. BMC Medical Education, 19(9), 18.