INTRODUCTION
Consumption of fresh dairy products is the important motive factor for their production in European Union
(Habánová et al., 2010).
The unknown mixture of milk from different species is a common fraud in dairy sector. Milk with high economic value is commonly adulterated with milk from species of lower cost. This adulteration is especially important for cheese makers, due to unknown milk mixtures produce changes in the final sensory properties and reduce the product quality. Sheep milk is more expensive than goat or cow milk and tends to be adulterated with those of lower cost (Puchades and Maquieira, 2013; Mayer et al., 2012).
Fraudulent incorporation of nondeclared kind of milk during technological processing is a common practice that can cause a problem for reasons related to intolerance or allergy, religious, ethical or cultural objections, and legal requirements. Therefore, accurate evaluation of the milk species used in dairy products is needed, especially for high-grade cheeses made exclusively with sheep or goat milk, many of which are registered by European law with a Protected Designation of Origin (PDO) (Zeleňáková et
al., 2008).
Traditional bryndza is sharp, salty, grayish, grated and pin-rolled, crumbly, semi-spreadable 100% sheep cheese. There is no close equivalent in taste and texture among sheep, cow, or goat cheeses. Most modern commercially available bryndza is milder, bleached creamy white, and two of its three varieties can legally contain up to 49% cow cheese. The European Commission registered the latter as Slovenská bryndza on its food list of Protected Geographical Indications on 16 July 2008 (Commission regulation (EC) No 676/2008).
For legal reasons and for consumer protection and confidence many analytical techniques for detecting mixtures of milks from different species have been developed in last decades (Zachar et al., 2011; Zeleňáková et al., 2011).
The official EU reference method which is based on the IEF of γ-caseins (Commission regulation (EC) No 273/2008) is an appropriate tool to detect cow milk in products made from milk of other species (detection limit ≤0.5%). A high number of other analytical techniques (e.g. electrophoretic, chromatographic, immunological and molecular biological methods) have also been used for qualitative (and partly also quantitative) species
Potravinarstvo, vol. 10, 2016, no. 1, p. 14-22 doi:10.5219/566
Received: 20 October 2015. Accepted: 12 January 2016. Available online: 24 January 2016 at www.potravinarstvo.com © 2016 Potravinarstvo. All rights reserved. ISSN 1337-0960 (online) License: CC BY 3.0
RESEARCH AND PRACTICE: QUANTIFICATION OF RAW AND HEAT-
TREATED COW MILK IN SHEEP MILK, CHEESE AND BRYNDZA BY ELISA
METHOD
Lucia Zeleňáková, Radoslav Židek, Margita Čanigová, Jana Žiarovská, Peter Zajác, Lenka
Maršálková, Martina Fikselová, Jozef Golian
ABSTRACT
The aim of this study was to test the reliability of commercial ELISA tests (RC-bovino) within raw and heat treated cow milk detection in sheep milk and cheese in order to obtain a high-quality, reliable and economically beneficial method suitable for routine application in practice. These tests were subsequently used for quantification of cow milk in commercial “Bryndza”. Raw sheep milk, cow milk and heat-treated cow milk (pasteurisation at 72 °C for 15 sec or at 85 °C for 3 sec) were mixed in precisely defined proportions (0 – 100% cow milk in sheep milk). The milk mixtures were sampled to detect adulteration and subsequently cheese was made. By ELISA tests was possible to determine these amounts of raw cow milk in sheep milk: 0.5% (0.2%), 5 % (4.81%), 50% (42.08%) and 75% (56.52%). The pasteurized samples in different combinations gave lower optical density responses than those prepared from raw milk (by approximately 60%). In context with the above mentioned, the relationship between the real and detected amount of cow milk (%) in different production stages (milk, cheese) using a regression analysis was examined. However, a lower reliability of the detection was indicated by R2 values, which ranged from 0.4058 (cheese) to 0.5175 (milk). In practice this means that although individual percentage (%) of cow milk in the sample can be detected, but in the unknown sample it can not be clearly confirm whether the cow milk was raw or heat-treated. In this context, the results can be inaccurate and may not correspond to the real situation. Within monitoring phase of this research, 9 samples of bryndza were analysed with the results of detected cow milk ranged from 11.56% to 14.3%. The obtained results confirm that the appropriate selection of ELISA tests can become an important factor in the setting of analytical capabilities for the detection of milk and cheese adulteration.
authentication in dairy products (Bobková et al., 2009; Mayer et al., 2012; Pizzano et al., 2011; Asensio et al., 2008; Xue et al., 2010; Costa et al., 2008; Suhaj et al., 2010; Stanciuc and Rapeanu, 2010 etc.).
Zeleňáková et al., (2009) described current situation in adulteration of the sheep milk and sheep milk products in Slovakia as well as in some countries in the EU. The results were evaluated according to the requirements of the valid legal standards. From the total number 70 samples 20 were adulterated with nondeclared cow milk.
ELISA is the most widely used form of immunoassay in milk analysis and has advantages of high sensitivity, low cost and fast application. It is easy to use, reliable, rapid and readily automated (Song et al., 2011; Costa et al., 2008).
The development of immunoenzymatic methods and their practical use depends mainly on the selection of the immunogenes, experimental animals, way of immunization, quality of used antiserum, or possibly used antibodies and specificity as well as sensitivity of the evidencing system (Yeung, 2006).
An indirect enzyme-linked immunosorbent assay (ELISA) was developed for the detection and quantification of bovine milk adulteration in goat’s milk. The polyclonal antibodies have been modified by mixing with goat’s milk for the assay purposes. The absorbance at 450 nm in indirect ELISA revealed a linear relationship with the concentration of adulterated bovine milk at the range of 4% – 50% (Xue et al., 2010).
Zarranz and Izco (2007) applied a protocol in order to validate a specific ELISA test for cow milk quantification in sheep milk, studying the main analytical properties displayed. The method was applied to analyze sheep milk samples collected from farms and it was found that 10% samples were adulterated with cow milk.
The aim of the study was to test the reliability of commercial ELISA tests for raw and heat-treated cow milk detection in the sheep milk and cheese and subsequently to quantify cow milk in commercial “Bryndza”.
MATERIAL AND METHODOLOGY
1. Analysis of the samples in research part of the study:
Cow and sheep milk were obtained from a local dairy farm, refrigerated at 4 °C and tested for their quality. Both types of milk were mixed in the various alternatives, including heat treatment and subsequently cheese was made. In this research 32 samples were analysed what corresponded to 16 combinations of cow and sheep milk mixtures. At first, the intra assay and interassay were performed in terms of laboratory testing of results accuracy and repeatability. The sample extracts were pipetted into wells in duplicates.
Samples preparation:
Milk composition was performed at Lactoscan device. The working principle is based on measuring the speed of the ultrasound in milk. Observed parameters: Density (kg.m-3), Fat content (g/100 g), Proteins (g/100 g), Lactose (g/100 g), Ash determined by calculation (g/100 g), Solids-non-fat (g/100 g), Freezing point of milk (°C). Other parameters: Calcium content (mg/100 g) by the complexometric titration method, Clotting activity (s),
Titratable acidity of milk (°SH) by the method of Soxhlet-Henkel and Active acidity of milk by pH meter.
Raw sheep milk, cow milk and heat-treated cow milk (pasteurisation at 72 °C for 15 sec and at 85 °C for 3 sec) were mixed in precisely defined proportions (0, 0.5; 5; 50; 75; 100% cow milk in sheep milk). The milk mixtures were sampled to detect adulteration and subsequently cheese was made. At first the cheesiness test was performed and then 1 – 2.5 mL CaCl2 per 1 liter was added to individual samples (depending on the level of heat treatment). The cheese production process included: cheesing of milk, processing of cheese curd, turning of cheese curd surface, its cutting, harping and mixing and finally formation of cloddish cheese. Subsequently the created clods were treated with 2% NaCl solution and left to mature at temperatures corresponding to the technological requirements (23, 19 and finally 8 °C). The temperature and pH in individual clods had been measured for 12 days. Subsequently they were processed and analysed according to the ELISA manufacturer instructions.
2. Analysis of the samples in monitoring and control part of the study:
The samples of bryndza (9 samples) were obtained in the grocery stores as well as from small sellers who product various sheep cheese. All the samples were refrigerated in the 30 mL boxes until the beginning of analysis. Subsequently they were processed and analysed according to the ELISA manufacturer instructions. The absorbance of the samples in research and monitoring part of the study was measured photometrically at 450 nm (STAT FAX 321/plus microwell reader - Awareness Technology, Palm City, FL). Comparisons of trends has been calculated with linear regression methods and visualized in graphs.
3. ELISA test characteristic:
ELISA tests RC-bovino (ZEU-INMUNOTEC, S.L, Spain) were used in our analysis. These tests are an enzyme immunoassay for the detection of cow milk in sheep or goat milk and their cheese. All reagents required for the enzyme immunoassay are contained in these test kits. The test kits are sufficient for 48 or 96 determinations (including standards). Detection limit is 0% cow milk. Assay time is approximately 90 minutes. The principle of the test is based upon the antigen-antibody reaction. The presence of cow milk in given sample is determined by the immunological detection of bovine IgG. The wells of the microtiter strips are coated with a specific antibody against bovine IgG. In the case of adulterated products, the antibodies contained in the cow milk will bind to the immobilized antibody. Any unbound components are removed in a washing step. By adding an antibody peroxidase-conjugate directed against bovine IgG, bound antigen is detected. Any unbound conjugate is removed in a washing step. Enzyme substrate and chromogen are added to the wells and incubated. The bound enzyme conjugate converts the colorless chromogen into a blue product. The addition of the stop reagent leads to a color change from blue to yellow. The measurement of the absorbance is made photometrically at 450 nm.
RESULTS AND DISCUSSION
In accordance with the ELISA instructions, within research part of the study, laboratory analysis of 32 samples of sheep milk and cheeses, adulterated with the addition of raw and heat-treated cow milk was performed. Prior to the analysis of these samples, quality control of ELISA tests was done. C.V. of results (n = 10) for inter and intra assay was 5.8% and 4.95%. As the basis for the evaluation, calibration curves were made by plotting % of cow milk in standard samples in a Y-axis and absorbance values in the X-axis. Values for the creation of calibration curves are shown in Table 1.
The calibration curve should be linear in the range of 0 – 10% cow milk. It can then pass through the linear regression. These calibration curves were completed with trend lines of linear and polynomial function of the 2nd grade. Individual percentages of cow milk in the samples were calculated using regression equations or by interpolating the absorbance values obtained into the calibration curve. The obtained concentration data were the real values. They didn´t need any conversion factor. An example of calibration curve with regression equation for the detection of cow milk in mixed milk samples is shown in Figure 1. Numerous producers and sellers offer their own softwares for imunoanalysis data processing and these are also the part of fotometric analysers (four-parametric logistic model and spatial comparison method).
Czerwenka et al., (2010) have studied the calibration relationships in frame of chromatographic detection of buffallo milk adulteration by cow milk. β-Lg was the main marker and the results pointed that no effect was obtained in detection reliability when comparing the linear and the
polynomic regression. The R2 for linear regression was 0.9973 and for polynomic regression 0.9951.
García et al., (1994); Hurley et al., (2004 a, b); Zarranz and Izco (2007); Asensio et al., (2008) and many others also reported the very comparable calibration curves used for the detection of cow, goat and sheep milk and cheese adulteration. The degree of the variability calibration samples expressed R2 was not less than 0.9 in all samples.
The above mentioned regression models were used in our data processing, too. The R2 values ranged from 0.9981 up to 0.9956 for the linear regression and R2 was 1 in two
datasets for the polynomial regression models.
The important prerequisite for results evaluation was an adequate preparation of samples in which the series of dilutions was realized. The samples showing optical density over the valuef of highest standard were further diluted and tested again. The percentage of cow milk was calculated multiplying by diluting factor. The absorbancies that either exceeded the detection limit or were under it were not suitable for the quantitative analysis.
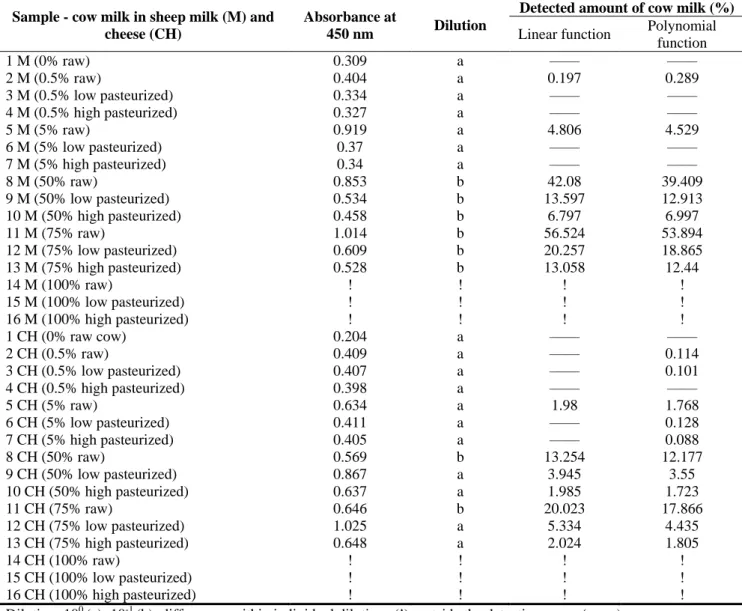
The lowest dilution amounts that possess the detectable absorbancies are summarized in the Table 2. All the absorbancies were analysed in the detection range of used ELISA kits. The absorbance values, that exceed the detection limit or were lower, were not possible to quantify. Based on the results, the dilution of samples in the range from 100 to 10-2 was used for the analysis 0 – 75% cow milk in sheep milk or cheese. The quatification was possible in the range from 100 to 10-1. The only exceptions were the cow milk samples without
Table 1 The values for the creation of calibration curve for the detection of cow milk in samples by ELISA tests.
Standards Concentration of cow milk
in standards (%)
Absorbance at 450 nm
Analysis of milk samples Analysis of cheese samples
1 0 0.369 0.401 2 1 0.492 0.526 3 5 0.973 1.036 4 10 1.483 1.528 y = 8.9437x - 3.4165 R² = 0.9981 y = 1.354x2 + 6.4416x - 2.5346 R² = 1 0 2 4 6 8 10 12 0 0.2 0.4 0.6 0.8 1 1.2 1.4 1.6 C on ce nt ra tio n of c ow m ilk (% ) Absorbance Figure 1 Calibration curve for the detection of cow milk in sheep milk.
sheep milk (14 M – 16 M and 14 CH – 16 CH). The absorbance values of these samples were similar instead of increased dilution what has influenced the final value of cow milk percentage. All these samples have no exact values in the Table 2 (!) and were not analysed further. For some samples (<75%), similar calculated concentrations were obtained, when two subsequently prepared decimal dilutions (from 100 to 10-1) were used for the analysis. As an example is sample 9 CH. The absorbance 0.867 was detected for the dilution 100 what corresponds to the calculated concentration 3.95%. In the case of 10-1 dilution a lower absorbance was detected (0.452) what corresponds to the calculated concentration 3.98%. It was confirmed that the samples 1 M and 1 CH did not contain cow milk. Regarding the choice of regression analysis model it can be said that with the increasing amount of cow milk, the higher values were calculated using linear regression equation. Nevertheless, producer of the used ELISA tests recommended analyze the obtained data by linear regression. The calculated values are reported in the Figures 2 – 4. ELISA tests of this producer are primarily designed to detect the adulteration of sheep and goat milk by raw cow milk. These amounts of raw cow milk in sheep milk it was possible to determine by ELISA tests: 0.5% (0.2%), 5% (4.81%), 50% (42.08%) and 75% (56.52%). The amount of cow milk up to 10% (what is the detection range for these ELISA tests) can be analysed only by calibration curve including regression equations, without dilution of the samples. However, in a concentration range between 0 – 0.5%, quantification is more sensitive to imprecision. Therefore, it is important to prepare appropriate reagents, standards (especially in the concentration range from 0 to 1%) and keep a good laboratory practice. The producer also recommended creating a curve or curves with a specific detection range. These curves were also used in analysis performed in study by Zeleňáková et al., (2008). They found out that these types of curves can significantly affect the quality and accuracy of individual measurements. The same authors have reported that the results do not sometimes meet the quantitative criteria, especially at higher
percentages. That can be caused by the saturation of the amount of specific antigens that are fixed in the microtitration plate and subsequently tight on the antigen surface.
ELISA is considered to be good quality when it can detect less than 1% foreign milk additives (Song et al., 2011; Luis et al., 2009).
The next phase of the results analysis was focused on the evaluation of ELISA kits reliability within detection of different raw and heat-treated cow milk amounts in sheep milk and cheese. The results are reported in the Figure 2. The pasteurized samples in different combinations (including the cheese manufacturing) gave lower optical density responses than those prepared from raw milk. The detected amount of cow milk was in some samples (0.5 – 5%) under the detection range.
The main advantages are processing of a large number of samples, creation of calibration curve and measuring of blind samples simultaneously on one microtitration plate, which eliminates the impact of the changing conditions during the determination. ELISA has also disadvantages, for example in that it detects unimpaired proteins, but the protein hydrolysates need not react immunologically
(Hurley et al., 2006b; Taylor et al., 2009).
The caseins feature advantage in being more or less stable under high temperature conditions. Therefore, they can be successfully used as the main antigens in heat treatment (pasteurization, UHT) of milk and milk products. Their major disadvantage is weak immunogenicity and higher sensitivity to protheolytic degradation. The whey proteins are much better immunogens and they are protheolytically degradable only in minimal quantity. In respect of high temperatures the whey proteins are less resistant (Lowe et al., 2004). In context with the above mentioned, the relationship between the real and detected amount of cow milk (%) in different production stages (milk, cheese) using a regression analysis was examined. Four detection trends were setf for the analysed ranges from 0 to 75%. All of them were characterized by the linear functions with the appropriate regression equations.
A B
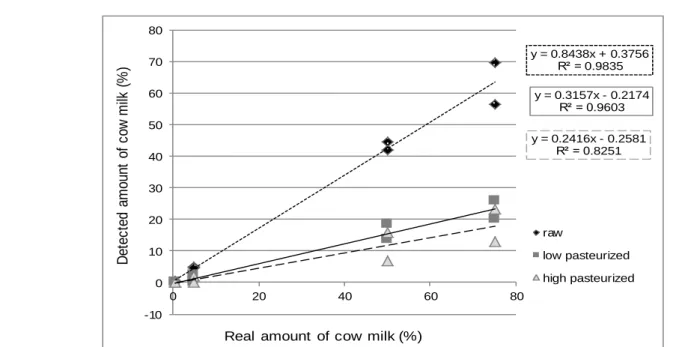
In the Figure 3 it can be seen that individual curves are indeed increasing character that corresponds to the growing amount of cow milk. However, a lower reliability of the detection was indicated by R2 values, which ranged from 0.4058 (cheese) to 0.5175 (milk). In practice this means that although individual percentage of cow milk in the sample can be detected (%), but in the unknown sample it can not be clearly confirm whether the cow milk was raw or heat-treated. In this context, the results can be inaccurate and may not correspond to the real situation. Creating the specific regression curves for each way of cow milk heat treatment (Figure 4) was performed in order to asses the relationship between the real and detected amounts of cow milk in sheep milk. The values of determination coefficients (R2) were higher than 0.82. Reliable detection of the real amount of cow milk can be performed in the praxis by both, interpolation as well as the regression analysis. The basic limitation for the precise detection is to know the way of cow milk heat treatment.
Similar regression curves can be provided for the detection of cheese adulteration, too.
As the various processing of milk can negatively affect the reliability of adulteration detection, such type of the analysis has not been applied in the praxis yet and also there is not recommended for the use. Therefore, the use of these ELISA tests is not adequate for routine surveillance of marketed cheese, especially for mixed cheeses, when the amount of milk from different species used for cheese making is unknown.
The detection and quantification of cow milk in the sheep milk and cheese using the commercial ELISAs was performed by Costa et al., (2008), too. The detected value in cheese samples was by 10% lower than the experimental value for QBT ELISA test and by 20 % lower for QGT ELISA test, when more than 40% cow or goat milk was added.
Table 2 Comparison of assay sensitivity by two regression models.
Sample - cow milk in sheep milk (M) and cheese (CH)
Absorbance at
450 nm Dilution
Detected amount of cow milk (%)
Linear function Polynomial function 1 M (0% raw) 0.309 a –––– –––– 2 M (0.5% raw) 0.404 a 0.197 0.289 3 M (0.5% low pasteurized) 0.334 a –––– –––– 4 M (0.5% high pasteurized) 0.327 a –––– –––– 5 M (5% raw) 0.919 a 4.806 4.529 6 M (5% low pasteurized) 0.37 a –––– –––– 7 M (5% high pasteurized) 0.34 a –––– –––– 8 M (50% raw) 0.853 b 42.08 39.409 9 M (50% low pasteurized) 0.534 b 13.597 12.913 10 M (50% high pasteurized) 0.458 b 6.797 6.997 11 M (75% raw) 1.014 b 56.524 53.894 12 M (75% low pasteurized) 0.609 b 20.257 18.865 13 M (75% high pasteurized) 0.528 b 13.058 12.44 14 M (100% raw) ! ! ! ! 15 M (100% low pasteurized) ! ! ! ! 16 M (100% high pasteurized) ! ! ! ! 1 CH (0% raw cow) 0.204 a –––– –––– 2 CH (0.5% raw) 0.409 a –––– 0.114 3 CH (0.5% low pasteurized) 0.407 a –––– 0.101 4 CH (0.5% high pasteurized) 0.398 a –––– –––– 5 CH (5% raw) 0.634 a 1.98 1.768 6 CH (5% low pasteurized) 0.411 a –––– 0.128 7 CH (5% high pasteurized) 0.405 a –––– 0.088 8 CH (50% raw) 0.569 b 13.254 12.177 9 CH (50% low pasteurized) 0.867 a 3.945 3.55 10 CH (50% high pasteurized) 0.637 a 1.985 1.723 11 CH (75% raw) 0.646 b 20.023 17.866 12 CH (75% low pasteurized) 1.025 a 5.334 4.435 13 CH (75% high pasteurized) 0.648 a 2.024 1.805 14 CH (100% raw) ! ! ! ! 15 CH (100% low pasteurized) ! ! ! ! 16 CH (100% high pasteurized) ! ! ! !
The ELISA tests RC-bovino were subsequently used for quantification of cow milk in 9 samples of commercial “Bryndza”. Individual percentage of cow milk in the samples were calculated by interpolating the absorbance values obtained into the calibration curve and using regression equations (y = 7.3075x – 1.9301; R2 = 0.9995). The presence of cow milk was confirmed in all analysed samples of bryndza (Table 3). The samples 1 – 8 were evaluated together and the sample 9 was evaluated separately according to the composition differences as given by manufacturers. By ELISA test there were detected from 11.56% (sample 1) to 14.3% (sample 4) cow milk. The coefficient of variation was 9.26% for these 8 samples. The sample 9 „Tatranská bryndza“ was specific because of high portion of cow milk. The manufacturer
In this sample 31.44% cow milk was detected by ELISA. But it can be assumed, that the real addition of cow milk in commercial samples of bryndza was higher than those detected by ELISA. This is based on the previously performed analyses and over mentioned results. Reliability of the ELISA tests and their applicability in the routine analysis was studied by many authors such as Popelka et al., (2002); Zeleňáková et al., (2008, 2009, 2011); Zarranz and Izco (2007); Costa et al., (2008); Štumr et al., (2008); Brinkhof et al., (2009); Luis et al., (2009); Taylor et al., (2009); Kardar (2010); Sleziaková and Baleková (2010); Xue et al., (2010); Song et al., (2011)
and many others.
0 10 20 30 40 50 60 0.5% raw 0.5% low pasteurized 0.5% high pasteurized 5% raw 5% low pasteurized 5% high pasteurized 50% raw 50% low pasteurized 50% high pasteurized 75% raw 75% low pasteurized 75% high pasteurized
Detected amount of cow milk (%)
R e a l a m o u n t o f c o w m il k milk cheese
Figure 2 Impact of cow milk heat treatment on its detection in sheep milk and cheese.
y = 0.407x - 0.1703 R² = 0.5175 y = 0.1231x + 0.0235 R² = 0.4058 0 10 20 30 40 50 60 0 20 40 60 80 D et ec te d am ou nt o f c ow m ilk ( % )
Real amount of cow milk (%)
milk cheese
Figure 3 Comparison of detection trends for the determination of relationship between the real and detected percentage of cow milk in sheep milk and cheese (%).
CONCLUSION
The analyses carried out in laboratory conditions recently, focused on the current situation monitoring of milk and cheese adulteration, have proved the necessity to deal with this issue more thoroughly. Most of the ELISA tests come from abroad (outside Slovakia). Their quality is important for milk producers and processing companies as well as public inspection authorities. The tests should be highly specific, sensitive, reliable, an easy to use, easy to laboratory equipment and of course affordable. As the tests are certified, nobody doubts their quality. Our survey, which we have been performing for a few years, has shown that few milk producers know possibilities of milk and cheese adulteration detection. This situation results in
the fact that the producers either don´t do any detection or they use the tests provided by distributors.
The aim of the study was to test the reliability of commercial ELISA tests for raw and heat-treated cow milk detection in the sheep milk and cheese and subsequently to quantify cow milk in commercial “Bryndza”. The used ELISA kits are designed for the quantitative determination of cow milk in sheep milk, sheep cheese, goat milk and goat cheese. By ELISA tests was possible to determine these amounts of raw cow milk in sheep milk: 0.5% (0.2%), 5% (4.81%), 50% (42.08%) and 75% (56.52%). The pasteurized samples in different combinations gave lower optical density responses than those prepared from raw milk. The decrease of cow milk amount by 53.53%
y = 0.8438x + 0.3756 R² = 0.9835 y = 0.3157x - 0.2174 R² = 0.9603 y = 0.2416x - 0.2581 R² = 0.8251 -10 0 10 20 30 40 50 60 70 80 0 20 40 60 80 D e te c te d a m o u n t o f c o w m ilk ( % )
Real amount of cow milk (%)
raw
low pasteurized
high pasteurized
Figure 4 Linear functions with the regression equations for raw and heat-treated cow milk determination in sheep milk (%) amount of cow milk in sheep milk and cheese (%).
Table 3 Samples of the bryndza analysed by the ELISA tests.
Sample number/
manufacturer Label and composition of bryndza
Quantification of cow milk by ELISA tests
1 Sheep cheese processed from raw milk (min 51%), water, edible salt (max 2.5%), dry matter (min 44%), fat in dry matter (min 48%)
11.56%
2 Stored sheep cheese, cow cheese, edible salt (max 3 %), water, dry matter (min 44%), fat in dry mater (min 48%)
13.91%
3 Stored sheep cheese (min 51%), cow cheese, edible salt (max 3%), water, dry matter (min 44%), fat in dry matter (min 48%)
14.24%
4 Stored sheep cheese (min 51%), cow cheese, edible salt (max 3%), water, dry matter (min 44%), fat in dry matter (min 48%)
14.3%
5 Stored sheep cheese (min 51%), cow cheese, edible salt (max 2%), water, dry matter (min 44%), fat in dry matter (min 48%)
11.95%
6 Sheep cheese processed from raw milk (min 51%), water, edible salt (max 3%), dry matter (min 44%), fat in dry matter (min 4 %)
12.57%
7 Sheep cheese processed from raw milk (min 5 %), cow cheese processed from pasteurized milk, water, edible salt (max 2.5 %), dry matter (min 44%), fat in dry matter (min 48%)
11.63%
8 Mixture of cow and sheep cheese processed from pasteurized milk, water, edible salt (max 2.5%), dry matter (min 44%), fat in dry matter (min 48%)
12.08%
9 Cow cheese, sheep cheese (25%), fat (21%) 31.44% % – weight percentage, min – minimum, max – maximum.
and 59.34% (at 5% low and high pasteurized cow milk) and by 62.64% and 66.56% (at 75% low and high pasteurized cow milk) was detected. In next phase of the research, the relationship between the real and detected amount of cow milk (%) in different production stages (milk, cheese) using a regression analysis was examined. However, a lower reliability of the cow milk detection was found and indicated by R2 values, which ranged from 0.4058 (cheese) to 0.5175 (milk). In practice this means that although individual percentage of cow milk in the sample can be detected (%), but in the unknown sample can´t be clearly confirmed whether the cow milk was raw or heat-treated. In this context, the results can be inaccurate and may not correspond to the real situation. As was noted above, one of the solutions is to set a specific regression curves for each of the heat treatment of analysed milk. The values of determination coefficients were higher than 0.82, which assumes the conditions for the reliable determination of raw or heat-treated cow milk in sheep milk. The only limitation here is the knowledge of cow milk heat treatment.
In total, 9 samples of bryndza were analysed in the monitoring phase of the research with the results of detected cow milk ranged from 11.56% to 14.3%. It can be assumed, that the real addition of cow milk in commercial samples of bryndza was higher than those detected by ELISA.
In conclusion, the analysis has shown that the ELISA tests identified the presence of cow milk, but quantification was not exact because of irreversible changes caused by the manufacturing process. Despite this fact, producer recommended ELISA tests for the detection of sheep milk and cheese adulteration by cow milk. Despite some negatives identified in this study, ELISA tests may find practical application, if they are used only for the qualitative detection of cow milk in other species milks or cheeses. Such detection is important for health, nutritional, technological as well as for economic reasons.
REFERENCES
Asensio, L., González, I., García, T., Martín, R. 2008. Determination of food authenticity by enzyme-linked immunosorbent assay (ELISA). Food Control, vol.19, no. 1, p. 1-8. http://dx.doi.org/10.1016/j.foodcont.2007.02.010
Bobková, A., Židek, R., Flimelová, E., Bobko, M., Fiková, M. 2009. Application of PCR method for milk adulteration and milk products identification. Potravinarstvo, vol. 3, no. 1, p. 1-3. ISSN 1337-0960.
Borková, M, Snášelová, J. 2005. Possibilities of Different Animal Milk Detection in Milk and Dairy Products – a Review, Czech Journal of Food Science, vol. 23, no. 2, p. 41-50.
Brinkhof, J. M., Houwers, D. J., Moll, L., Dercksen, D., Van Maanen, C. 2009. Diagnostic performance of ELISA and PCR in identifying SRLV-infected sheep and goats using serum, plasma and milk samples and in early detection of infection in dairy flocks through bulk milk testing. Veterinary Microbiology, vol. 41 no. 3-4, p. 193-198.
http://dx.doi.org/10.1016/j.vetmic.2009.09.060
Commission Regulation (EC) No 273/2008 of 5 March 2008 laying down detailed rules for the application of Council Regulation (EC) No 1255/1999 as regards methods for the analysis and quality evaluation of milk and milk products.
Commission regulation (EC) No 676/2008 of 16 July 2008 registering certain names in the Register of protected designations of origin and protected geographical indications.
Costa, N., Ravasco, F., Miranda, R., Duthoit, M., Roseiro, L. B. 2008. Evaluation of a commercial ELISA method for the quantitative detection of goat and cow milk in ewe milk and cheese. Small Ruminant Research, vol. 79, no. 1, p. 73-79. http://dx.doi.org/10.1016/j.smallrumres.2008.07.012
Czerwenka, Ch., Muller, L., Lindner, W. 2010. Detection oft he adulteration of water buffalo milk and mozzarella with cow´s milk by liquid chromatography-mass spectrometry analysis of β-lactoglobulin variants. Food Chemistry, vol.
122, no. 3, p. 901-908.
http://dx.doi.org/10.1016/j.foodchem.2010.03.034
Edwin K. Lowe, E. K., Anema, S. G., Annie Bienvenue, A., Boland, M. J., Creamer, L. K., Jiménez-Flores, R. 2004. Heat-induced redistribution of disulfide bonds in milk proteins. 2. Disulfide bonding patterns between bovine β-lactoglobulin and κ-casein. Journal of Agricultural and Food Chemistry, vol. 52, no. 25, p. 7669-7680.
http://dx.doi.org/10.1021/jf0491254 PMid:15675819
García, T., Martín, R., Rodríguez, E., Morales, P., González, I., Sanz, B., Hernandez, P. E. 1994. Detection of goat´s milk in ewe´s milk by an indirect ELISA. Food Agricultural Immunology, vol. 6, no. 1, p. 113-118.
http://dx.doi.org/10.1080/09540109409354819
Habánová, M., Lorková, M., Kopčeková, J. 2010. The consumption of Acidophylus drinks and yogurts in selected population of pupils in years 2004 and 2008. Potravinarstvo, vol. 3, no. 1, p. 19-23. http://dx.doi.org/10.5219/26
Hurley, I. P., Coleman, R. C., Ireland, H. E., Wiliams, J. H. H. 2006. Use of sandwich IgG ELISA for the detection and quantification of adulteration of milk and soft cheese. International Dairy Journal, vol. 16, no. 7, p. 805-812.
http://dx.doi.org/10.1016/j.idairyj.2005.07.009
Hurley, I. P., Ireland, H. E., Robert, C. 2004 a. Application of immunological methods for the detection of species adulteration in dairy products. International Journal of Food Science and Technology, vol. 39, no. 8, p. 873-878.
http://dx.doi.org/10.1111/j.1365-2621.2004.00861.x
Hurley, I. P., Coleman, R. C., Ireland, H. E., Williams, J. H. H. 2004 b. Measurement of bovine IgG by indirect competitive ELISA as a means of detecting milk adulteration. Journal of Dairy Science, vol. 87, no. 3, p. 215-221.
http://dx.doi.org/10.3168/jds.S0022-0302(04)73195-1 Kardar, A. 2010. The design of a specific-igE ELISA assay kit for major cow´s milk allergens.Tehran University Medical J., vol. 68, no. 3, p. 147-152.
Luis, D. R., Lavilla, M., Sánchez, L., Calvo, M., Pérez, D. M. 2009. Development and evaluation of two ELISA formats for the dteection of β-lactoglobulin in model porcessed and commercial foods. Food Control, vol. 20, no. 7, p. 643-647.
http://dx.doi.org/10.1016/j.foodcont.2008.09.017
Mayer, H. K., Bürger, J., Kaar, N. 2012. Quantification of cow milk percentage in dairy products – a myth? Analytical and Bioanalytical Chemistry, vol. 403, no. 10, p. 303-304.
http://dx.doi.org/10.1007/s00216-012-5805-1
Pizzano, R., Nicolai, M. A., Manzo, C., Addeo F. 2011. Authentication of dairy products by immunochemical methods: a review. Dairy Science and Technology, vol. 91, no. 2, p. 77-95. http://dx.doi.org/10.1007/s13594-011-0008-7
Popelka P., Popelka P., Horská D., Golian J., Marcinčák S. 2002. Detection of sheep milk and cheeses adulteration using
enzyme immunoanalysis (ELISA). Slovak Veterinary Journanl, vol. 27, no. 3, p. 36-37.
Puchades, R., Maquieira, Á. 2013. ELISA tools for food PDO authentication, p. 145-194. In De La Guardia, M., Gonzálves, A. 2013: Food Protected Designation of Origin: Methodologies and Applications. Oxford (UK) - Amsterdam (The Netherlands): Elsevier, 800 p. ISBN: 978-0-444-59562-1.
Sleziaková, J., Baleková, S. 2010. Detection of cheese milk and cheese adulteration by imunoenzymatic and molecular methods. Milk safety and quality - current problems: International scientific conference Hygiena alimentorum XXXI. Štrbké pleso (Slovak Republic), p. 315-317.
Song, H., Xue, H., Han, Y. 2011. Detection of cow milk in Shaanxi goat´s milk with an ELISA assay. Food Control, vol.
22, no 6, p. 883-887.
http://dx.doi.org/10.1016/j.foodcont.2010.11.019
Stanciuc, N., Rapeanu, G. 2010. Identification of adulterated sheep and goat cheeses marketed in Romania by immunocromatographic assay. Food and Agricultural Immunology, vol. 21, no. 2, p. 157-164.
http://dx.doi.org/10.1080/09540100903508683
Suhaj, M., Stankovská, M., Kolek, E. 2010. Detection of cheese and cow cheese in Slovak sheep by isoelectric focusing. Chemické Listy, vol. 104, p. 627-630.
Štumr, F., Tomková, K., Šafářová, P. et al. 2008. ELISA tests for determination of allergens in food. Proteíny: International scientific conference. Zlín (Czech Republic), p. 180-182.
Taylor, L. S., Nordlee, A. J., Niemann, M. 2009. Allergen immunoassays–considerations for use of naturally incured standards. Analytical and Bioanalytical Chemistry, vol. 395, no. 1, p. 83-92. http://dx.doi.org/10.1007/s00216-009-2944-0
PMid:19641908
Xue, H., Hu, W., Son, H., Han, Y., Yang, Z. 2010. Indirect ELISA for detection and quantification of bovine milk in goat milk. Journal of Food Science and Technology, vol. 31, no. 24, p. 370-373.
Yeung, J. 2006. Enzyme-linked immunosorbent assay (ELISAs) for detecting allergens in foods. In Detecting Allergens in Food. : Woodhead Publishing. 2006, p. 109-124. ISBN: 978-1-85573-728-0.
Zachar, P., Šoltés, M., Kasarda, R., Novotný, J., Novikmecová, M., Marcinčáková, D. 2011. Identification of milk and milk products. Mljekarstvo, vol. 61, no. 3, p. 199-207.
Zarranz, M. J., Izco, J. M. 2007. Validation parameters of an ELISA to detect presence of milk from other species. Milchwissenschaft, vol. 62, no. 2, p. 159-163.
Zeleňáková, L., Golian, J., Zajác, P. 2008. Application of ELISA tests for the detection of goat milk in sheep milk. Milchwissenschaft, vol.63, no. 2, p. 137-141.
Zeleňáková, L., Šesták, M., Židek, R. 2009. Monitoring of sheep milk and milk products adulteration on common European food market. Potravinarstvo, vol. 3, no. 2, p. 69-73. Zeleňáková, L., Židek, R., Čanigová, M. 2011. Optimization of ELISA method for detection of bovine ß-lactoglobulin in sheep milk and sheep milk products. Milchwissenschaft, vol. 66, no. 3, p. 278-281.
Acknowledgments:
This work was supported by grant VEGA No. 1/0316/15.
Contact address:
Lucia Zeleňáková, Slovak University of Agriculture in Nitra, Faculty of Biotechnology and Food Sciences, Department of Food Hygiene and Safety, Tr. A. Hlinku 2, 949 76 Nitra, Slovak Republic, E-mail:
Radoslav Židek, Slovak University of Agriculture in Nitra, Faculty of Biotechnology and Food Sciences, Department of Food Hygiene and Safety, Tr. A. Hlinku 2, 949 76 Nitra, Slovak Republic, E-mail: [email protected].
Margita Čanigová, Slovak University of Agriculture in Nitra, Faculty of Biotechnology and Food Sciences, Department of Evaluation and Processing of Animal Products, Tr. A. Hlinku 2, 949 76 Nitra, Slovak Republic, E-mail: [email protected].
Jana Žiarovská, Slovak University of Agriculture in Nitra, Faculty of Agrobiology and Food Resources, Department of Genetics and Plant Breeding , Tr. A. Hlinku 2, 949 76 Nitra, Slovak Republic, E-mail: [email protected].
Peter Zajác, Slovak University of Agriculture in Nitra, Faculty of Biotechnology and Food Sciences, Department of Food Hygiene and Safety, Tr. A. Hlinku 2, 949 76 Nitra; State Veterinary and Food Institute, Jánoškova 1611/58, 026 01 Dolný Kubín, Slovak Republic, E-mail:
Lenka Maršálková, Slovak University of Agriculture in Nitra, Faculty of Biotechnology and Food Sciences, Department of Food Hygiene and Safety, Tr. A. Hlinku 2, 949 76 Nitra, Slovak Republic, E-mail: [email protected].
Martina Fikselová, Slovak University of Agriculture in Nitra, Faculty of Biotechnology and Food Sciences, Department of Food Hygiene and Safety, Tr. A. Hlinku 2, 949 76 Nitra, Slovak Republic, E-mail: [email protected].
Jozef Čapla, Slovak University of Agriculture in Nitra, Faculty of Biotechnology and Food Sciences, Department of Food Hygiene and Safety, Tr. A. Hlinku 2, 949 76 Nitra, Slovak Republic, E-mail: [email protected].