Florida International University
FIU Digital Commons
FIU Electronic Theses and Dissertations University Graduate School
3-22-2012
Development and Testing of a Second Generation
Hand-held Optical Imager
Jean Gonzalez
Florida International University, [email protected]
Follow this and additional works at:http://digitalcommons.fiu.edu/etd
This work is brought to you for free and open access by the University Graduate School at FIU Digital Commons. It has been accepted for inclusion in FIU Electronic Theses and Dissertations by an authorized administrator of FIU Digital Commons. For more information, please [email protected]. Recommended Citation
Gonzalez, Jean, "Development and Testing of a Second Generation Hand-held Optical Imager" (2012).FIU Electronic Theses and Dissertations.Paper 596.
FLORIDA INTERNATIONAL UNIVERSITY Miami, Florida
DEVELOPMENT AND TESTING OF A SECOND GENERATION HAND-HELD OPTICAL IMAGER
A thesis submitted in partial fulfillment of the Requirements for the degree of
MASTER OF SCIENCE in BIOMEDICAL ENGINEERING by Jean Gonzalez 2012
ii To: Dean Amir Mirmiran
College of Engineering and Computing
This thesis, written by Jean Gonzalez, and entitled Development and Testing of a Second Generation Hand-held Optical Imager, having been approved in respect to style and intellectual content, is referred to you for judgment.
We have read this thesis and recommend that it be approved.
_______________________________________ Wei-Chiang Lin
_______________________________________ Anthony Mcgoron
_______________________________________ Anuradha Godavarty, Major Professor Date of Defense: March 22, 2012
The thesis of Jean Gonzalez is approved.
_______________________________________ Dean Amir Mirmiran College of Engineering and Computing
_______________________________________ Dean Lakshmi N. Reddi University Graduate School
iii
ABSTRACT OF THE THESIS
DEVELOPMENT AND TESTING OF A SECOND GENERATION HAND-HELD OPTICAL IMAGER
by Jean Gonzalez
Florida International University, 2012 Miami, Florida
Professor Anuradha Godavarty, Major Professor
Hand-held optical imagers are developed towards clinical breast cancer imaging. Herein, a Gen-2 hand-held optical imager has been developed with unique features: (i) image curved breast tissues with ~86% surface contact, and (ii) perform reflectance and transillumination imaging using the novel forked probe heads. Extensive phantom studies were performed using 1% Liposyn solution (background, ~ 300 ml and 1000 ml volumes) and 0.45 cc India Ink (absorption) targets, under different target:background contrast ratios and target depths. Two-dimensional surface images detected target(s) up to 2.5 cm deep via reflectance imaging, and up to 5 cm deep via transillumination imaging. Preliminary studies on gel-based breast phantoms (~700 ml) detected targets via reflectance and transillumination imaging. Preliminary in-vivo
reflectance studies on normal and cancerous breast tissues also detected targets, although with artifacts. In future, the portable Gen-2 imager has potential for clinical breast imaging via reflectance and transillumination approach after extensive in-vivo studies.
iv
TABLE OF CONTENTS
CHAPTER PAGE
CHAPTER 1 -Introduction ... 1
CHAPTER 2: Background ... 4
2.1 Basic information on near-infrared optical imaging ... 4
2.2 Theory of near-infrared optical imaging ... 8
2.2.1 Boundary Conditions ... 11
2.2.2 Forward and Inverse Problem ... 12
2.3 Methods of optical imaging... 13
2.4 Measurement Techniques of Optical Imaging ... 15
2.5 Light Sources... 17
2.6 Detectors ... 18
2.7 Optical Imagers Available ... 19
2.8 Optical Imaging Laboratory's First Generation Hand-held Optical Imager ... 24
2.9 Optical Imaging lab Gen-1 hand-held optical imager Instrumentation ... 25
2.10 Principal of Imaging of the Gen-1 hand-held optical imager ... 28
2.11 Drawbacks and solutions for the Gen-1 hand-held optical imager ... 29
2.12 Summary ... 32
CHAPTER 3: Materials and Methods: ... 33
3.1 Instrumentation... 33
3.1.1 Gen-2 sources: ... 34
3.1.2 Gen-2 probe construction. ... 42
3.1.3 Detector ... 48
3.1.4 Portable rack mounting ... 50
3.1.5 Principle of operation ... 51
3.2 Data Processing and Image Analysis ... 52
3.2.1 (1) Collection of optical signal ... 54
3.2.2 (2) Averaging of the collected optical signal ... 54
3.2.3 (3) Extraction and placement of optical intensity measurement. ... 54
3.2.4 (4) Normalization ... 55
3.2.5 (5) Subtraction Technique ... 56
3.2.6 (6) Removal of detectors nearest sources ... 59
3.2.7 Normalization: ... 60
3.2.8 (8) Polynomial fitting ... 60
3.2.9 Target location and size ... 61
3.2.10 Measurement error ... 64
3.2.11 Contrast calculation ... 65
3.3 Feasibility Studies: ... 65
3.3.1 Feasibility of dual probe imaging using a fluorescence target ... 65
3.3.2 Feasibility of single probe imaging of an absorption target ... 67
3.3.3 Feasibility of dual probe bilateral imaging of an absorptive target (Bilateral Imaging: Simultaneous vs. Sequential)... 69
v
3.4 Summary ... 73
CHAPTER 4: Gen-1 and Gen-2 comparison ... 74
4.1 Introduction ... 74
4.2 Materials and Methods ... 74
4.2.1 Instrumentation... 74
4.2.2 Experimental studies ... 74
4.2.3 Data analysis ... 76
4.3 Results and Discussion ... 76
4.4 Conclusions ... 80
CHAPTER 5: Bilateral and Transillumination imaging on cubical phantoms ... 81
5.1 Introduction ... 81
5.2 Materials and Methods ... 81
5.2.1 Instrumentation ... 81
5.2.2 Experimental Studies ... 81
5.2.3 Data Analysis ... 87
5.3 Results and Discussion ... 87
5.3.1 Comparison of reflectance vs. transillumination: Reflectance ... 95
96 5.3.2 Comparison of reflectance vs transillumination: Transillumination ... 97
5.4 Conclusions ... 99
CHAPTER 6: Reflectance and Transillumination imaging of curved tissue phantoms ... 100
6.1 Introduction ... 100
6.2 Materials and Methods ... 100
6.2.1 Instrumentation... 100
6.2.2 Experimental Studies... 100
6.2.3 Data Processing ... 102
6.3 Results and Discussion ... 102
6.4 Conclusion ... 105
CHAPTER 7: Reflectance imaging on human breast tissue. ... 106
7.1 Introduction ... 106
7.2 Materials and Methods ... 106
7.2.1 Instrumentation ... 106
7.2.2 Experimental Studies ... 106
7.2.3 Data Processing ... 110
7.3 Results and Discussion ... 110
7.3.1 (i) Single probe reflectance imaging ... 110
7.3.2 (ii) Effects of pressure on human subject imaging. ... 112
7.3.3 (iii) Simultaneous bilateral imaging on a human subject ... 113
7.3.4 (iv) Preliminary in-vivo breast cancer imaging ... 116
... 117
vi
Conclusion ... 119 APPENDICES ... 122 References: ... 141
vii
LIST OF FIGURES
FIGURE PAGE Figure 1: Spectrum of absorption from 200-5000 nm. The biological optical Imaging window allows deeper penetration of light from the wavelengths of around 700-900 nm due to minimal absorption by the tissue components, HbO, Hb and H2O in this wavelength range. Reproduced from [33] ... 5 Figure 2: Photons traveling through tissue can reach the same destination using different paths. Ballistic photons travel without any scattering events. Snake photons are minimally scattered. Diffuse photons are heavily scattered. Collection of light at specific locations increases the likelyhood of detectiong one type of photon as opposed to another. Adapted from [32] ... 9 Figure 3: In the forward problem, initial source fluence and optical properties are known the resultant fluence is calculated. In the inverse problem the input (or source) and output (or detected) fluence are known (or measured) and the optical properties are calculated. Adapted from [35]. ... 13 Figure 4: The 3 methods of applying optical imaging are (A) shadow projection (compressed transillumination), (B) circular tomography (uncompressed transillumination) and (c)
sub-surface (reflectance) Reproduced from [7]. ... 14 Figure 5: Reflectance imaging is when is light is launched and collected from the same side. ... 14 Figure 6: Transillumination is when light is launched and collected on different surface
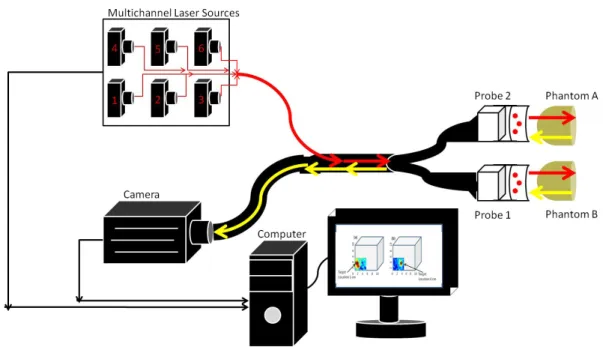
(example: opposite surface). ... 15 Figure 7: In Continuous Wave (CW) the source provides the same output over time. B) Time domain uses a short duration pulse of light. C) Frequency domain (FD) relies on modulating a source output like a sinusoidal wave. Reproduced from [30] ... 16 Figure 8: First Generation held optical imaging system, with the (a) flexible 3-part hand-held probe, and (b) the imaging system set-up as a bench-top unit. Reproduced from [30]. ... 25 Figure 9: A) Full length view of the hand-held probe of the Gen-1 imager. B) Bundle of optical detection fibers. C) Probe face of the Gen-1 hand-held optical imager D) Source detector layout of the Gen-1 hand-held optical imaging probe. Adapted from [30]. ... 27 Figure 10: Schematic of the Gen-2 hand-held optical imager. The three main components of the imager are shown (source, detector and hand-held probes) ... 34 Figure 11: The source of the Gen-2 imager is driven by the multichannel controller that is a combination laser driver (LD) and thermoelectric cooler driver (TECD), which allows for the control of up to 8 independent laser mounts.. ... 35
viii
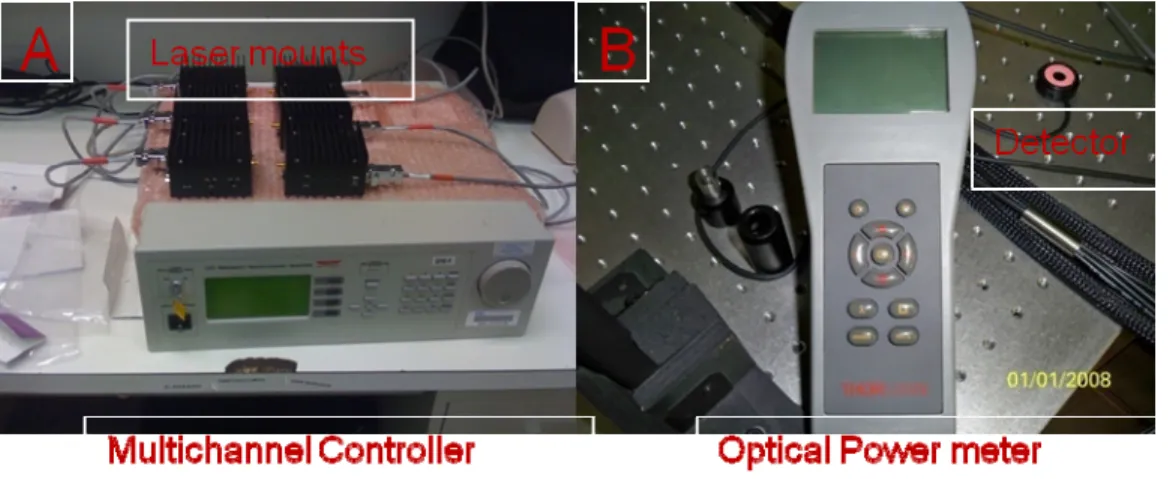
Figure 12: (A) laser mount TCLDM9,(B) laser diode 785P100,(C) C230TME-B - f=4.51 mm, NA=0.55, mounted Geltech aspheric Lens, AR: 600-1050 nm ,(D) S1TM09 - SM1 to M9 x 0.5 lens cell adapter, (E) SM1SMA - SM1 (1.035"-40) to SMA fiber connector adapter plate, ... 36 Figure 13: Multichannel controller and the laser mounts prior to stability testing with thermal electric driver active. B) Optical power meter (can measure optical power from the laser
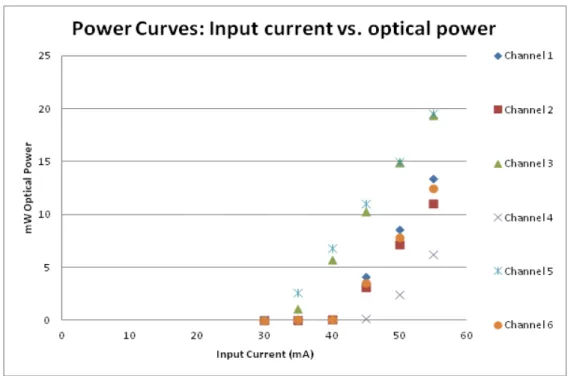
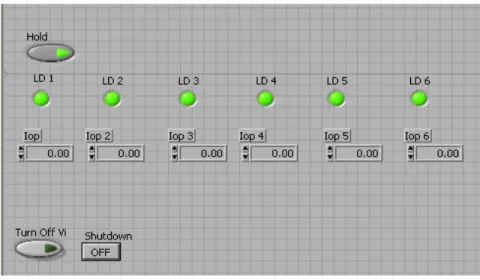
mounts). ... 37 Figure 14: Input current vs. optical power for the six independent channels with their respective laser diodes... 38 Figure 15: The final configuration of the laser mounts, on a rack mountable stage. The mounts are labeled with their channel number (1-6) ... 39 Figure 16: Newport 8008 Labview driver computer control ... 41 Figure 17: Final Automation result (Front Panel) of the computer controlled multichannel
controller ... 41 Figure 18: The source detector layout of the hand-held optical imagers (a) Gen-1 (source mean and std 1.02 ± 0.937 mW) (b) Gen-2 (source mean and std 2.05 ± 0.060mW) ... 43 Figure 19: Optical detection fiber bundle of the Gen-2 imaging probe. ... 44 Figure 20: (A) Gen-2 hand-held probe face (5 part design). (B) Model of the Gen-2 hand-held probe flat (aerial view), (C) Model of the Gen-2 hand-held probe curved (aerial view), (D) The Gen-2 hand-held probe flat, (E) The Gen-2 hand-held probe curved ... 46 Figure 21: The experimental measurements of curvature for the Gen-1 (a) and 2 (b) hand-held optical probes resulted in values of ~ 30, 86 % using a 13 cm solid cylindrical phantom
respectively. ... 47 Figure 22: (A)The PI-Max II is a ICCD camera produced by Princeton instruments towards the detection of low intensity light, (B) the Gen-2 camera within the enclosure for the hand-held optical imager, (C) Optics employed in conjunction with PI-Max II, such as lens tubes and other lens adapters ... 49 Figure 23: The Gen-2 hand-held optical imager is constructed inside of a portable cart (labels indicate the location of hardware). ... 51 Figure 24: Flowchart of the steps of data processing. ... 53 Figure 25: Illuminated optical fiber bundle of the Gen-2 imager as captured via the ICCD
(detector). The points selected are calibration points required to match the location of the optical fiber on the fiber bundle with the corresponding end on the probe face. ... 55
ix
Figure 26: 2D surface contour plots of a 0.45cc spherical target placed inside of a liquid liposyn phantom generated through the various steps of the data processing procedure. (A)The
unsubtracted (A) and subtracted (B), (C) Subtracted data with the detectors nearest the sources removed and (D) polynomial fitted data of subtracted data. ... 56 Figure 27: Subtraction is an optical processing technique to enhance image contrast that centers around the removal of the target to generate a difference between the target (step 1) and
background (step 2) images. ... 57 Figure 28: Data processing for bilateral imaging. Simultaneous and sequential bilateral imaging apply subtraction processing using the contralateral breast as a background. ... 59 Figure 29: (A) 2D surface contour plots of the excitation leakage of the Gen-2 hand-held optical imager. (B) Removal of the detectors nearest the points of illumination ~ 0.5 cm reduces the excitation leakage from the sources to the detector points and increases homogeneity of the points submitted to the next processing step polynomial fitting. ... 60 Figure 30: (A) 2D surface contour plot of a 0.45 cc target embedded into a liposyn solution after processing. (B,C) The column and row of the 2D surface contour plot based on the centroid or the point of maximum intensity. (D) The data generated from the column and row data in (cm) is the estimated location, Full width at half maximum or estimated size and the r squared when comparing the original row and column data to the 2D-surface contour plot. ... 62 Figure 31:Flowchart for the calculation of measurement error ... 64 Figure 32: Dual probe imaging setup on a single phantom ... 66 Figure 33: 2D surface contour plot of the detected fluorescence intensity of a cubical tissue phantom containing a 0.45 cc 1μM ICG target (fluorescence) target at (8.5, 2,2) cm of the liposyn phantom ... 67 Figure 34: Single Probe imaging setup on a single phantom ... 68 Figure 35: 2D surface contour plot of detected optical intensity of a cubical phantom containing a India Ink target (0.08% by volume) inside a liposyn solution, where the true trarget location is demarcated by the black circle is located at (A) 1.5 cm deep target, (B) 2.0 cm deep target. ... 68 Figure 36: Bilateral imaging setup on two phantoms ... 70 Figure 37: Bilateral Imaging of two identical tissue phantoms with embedded India Ink 0.02% target filled with 1% liposyn solution. The images are 2D contour plots of NIR detected signal which result from simultaneous and sequential processing. ... 72
x
Figure 38: The Gen-1 imager produced 2D surface plots after processing of the optical signal collected during an experimental study involving a 0.45 cc India ink target placed in a cubical 10× 10× 10 cm3 phantom filled with 1 % liposyn. The target was placed at a) (2,2.5,1) cm b) (4,2.5,1) cm and c) (9,2.5,1) cm... 77 Figure 39: The Gen-2 imager produced the 2D surface plots after processing of the optical signal from an experimental study involving a 0.45 cc India ink target placed in a cubical 10× 10× 10 cm3 phantom filled with 1 % liposyn. The target was placed at a) (1,2.5,1) b) (2.5,2.5,1), and c) (4,2.5,1). ... 79 Figure 40: Schematic of experimental tissue phantom study set-up for (A) simultaneous bilateral reflectance imaging, and (B) transillumination imaging ... 85 Figure 41: 2D surface contour plots (Reflectance imaging) for a 0.45 cc spherical target filled with a 0.8% by volume India ink. The target was placed in a 10×10×10 cm3 acrylic liposyn phantom with a India ink to make the contrast between target and background 1:0, 1000:1, 100:1 and 10:1.where the black circle represents true target location ... 88 Figure 42: 2D surface contour plots (Reflectance imaging) for a 0.45 cc spherical target filled with a 0.08% by volume India ink. The target was placed in a 10×10×10 cm3 acrylic liposyn phantom containing India ink making the T:B contrast ratio 1:0, 1000:1, 100:1 and 10:1.where the black circle represents true target location ... 89 Figure 43: 2D surface contour plots (Reflectance imaging) for a 0.45 cc spherical target filled with a 0.008% by volume India ink. The target was placed in a 10×10×10 cm3 acrylic liposyn phantom containing India ink making the T:B contrast ratio 1:0, 1000:1, 100:1 and 10:1.where the black circle represents true target location ... 90 Figure 44: 2D surface contour plots (Transillumination imaging) for a 0.45 cc spherical target filled with a 0.8% by volume India ink. The target was placed in a 10×10×10 cm3 acrylic liposyn phantom containing India ink making the T:B contrast ratio 1:0, 1000:1, 100:1 and 10:1.where the black circle represents true target location. ... 91 Figure 45: 2D surface contour plots (Transillumination imaging) for a 0.45 cc spherical target filled with a 0.08% by volume India ink. The target was placed in a 10×10×10 cm3 acrylic liposyn phantom containing India ink making the T:B contrast ratio 1:0, 1000:1, 100:1 and 10:1.where the black circle represents true target location. ... 92 Figure 46: 2D surface contour plots (Transillumination imaging) for a 0.45 cc spherical target filled with a 0.008% by volume India ink. The target was placed in a 10×10×10 cm3 acrylic liposyn phantom containing India ink making the T:B contrast ratio 1:0, 1000:1, 100:1 and 10:1.where the black circle represents true target location.. ... 93 Figure 47: Two-dimensional surface contour plots (via 5th degree polynomial fit) of reflectance imaging studies of a 0.45 cc spherical target at 1:0 and 100:1 T:B India Ink contrast, located at various depths. The black hollow circle represents the true 2D target location. ... 96
xi
Figure 48: Two-dimensional surface contour plots (via 5th degree polynomial fit) of
transilluminated reflectance imaging studies of a 0.45 cc spherical target at 1:0 and 100:1 T:B India Ink contrast, located at various depths. The black hollow circle represents the true 2D target location. ... 98 Figure 49: Diagram of probe placement during the scanning of a gel phantom with reflectance (A) and transillumination (B) imaging. The target location was approximately 1 cm off from the curved surface, where the arrows indicate the direction of illumination (long arrows) and light collection (short arrows). ... 101 Figure 50: The breast mold (A) employed to produce a solid breast phantom (C) which has a major axis of 16 cm and a minor axis of 11.5 cm with a total volume of ~ 700 ml. A 0.45 cc India ink target was place ~ 1 cm off the surface represented by the red circle. ... 101 Figure 51: Single probe reflectance imaging was performed on a gel phantom with shape and optical properties resembling human breast tissue. A 0.45 cc India ink target 0.08 % by volume - demarcated by the dotted circle on the 2D surface contour plots was inserted 1 cm from the detection surface. Scanning took place at three locations (top to bottom) on the gel phantoms shown by the dotted squares (probe locations) where the red circle represents the target position inside the phantom ... 103 Figure 52: Transillumination imaging was performed on a gel phantom with shape and optical properties resembling human breast tissue. A 0.45 cc India ink target 0.08 % by volume - demarcated by the dotted circle on the 2D surface contour plots was inserted 1 cm from the detection surface. Scanning took place at three locations (right to left) on the gel phantoms shown by the dotted squares (the dotted squares represent the location of the two probe involved in transillumination) where the red circle represents the target position inside the phantom . . 105 Figure 53: A single subject with multi focal cancerous legions in the left breast at approximately 2 o'clock (of the nipple region). The X-ray and ultrasound images display two large distinct legions labeled L1 and L2, while a smaller third legion is labeled L3. ... 109 Figure 54: 2D surface contour plots of single probe reflectance imaging on breast tissue of three healthy volunteers. The volunteers were asked to place a 0.45 cc India ink target superficially under the flap of the left (subjects left) breast tissue (infra-mammary fold) at the 6 o'clock position (under the nipple region) to simulate the endogenous contrast of a vascular tumor. A single probe was placed on three locations by the subject as to have the target location relative to the probe on the left, middle and right regions as demarcated by the yellow circles rectangles. The target was removed for the collection of the background image to enhance contrast. ... 111 Figure 55: 2D surface contour plots of the effects of pressure on artifact generation. A single healthy human subject with a 0.45 cc absorption target (.08 % by volume India Ink) placed in the infra-mammary fold of the left breast was asked to apply an incremental pressure for a series of 4 images. The pressure ranged from comfortable (P1), slight (P-2), noticeable (P-3), and uncomfortable (P-4) which were left up to the patient's interpretation. ... 112
xii
Figure 56: 2D surface contour plot of intensity distribution of progressive scans across human breast tissue with a 0.45 cc absorption target embedded under left breast flap at 6’o clock
position. Provided is the subtracted image prior to calibration, the calibration factor between the two probes , the adjusted subtracted image and the polynomial fitting of the adjusted subtracted intensity data. ... 115 Figure 57: The Gen-2 hand-held optical imager was employed (single probe reflectance
imaging) to image a cancerous legion. The X-ray and ultrasound images display two large distinct legions labeled L1 and L2, while a smaller third benign legion is labeled L3 (Figure 53) in a 51 year old woman with invasive ductal carcinoma in the left breast. The imaging method involved a sequential top to bottom scan collecting 4 images ~ (1-2) cm spacing (4 images collected). ... 117 Figure A58: Mesh used during the simulation studies conducted for the Gen-2 hand-held optical imager, involving maximum recovery depth and investigation of polynomial fitting. The mesh is 5×5×10 cm3. ... 122 Figure B59: Simulation result of a target placed at (2,2,1) cm (x,y,z) from the detection surface employing single probe reflectance imaging. ... 123 Figure B60: Comparison of polynomial fitting of 7th and 5th degree. The figure shows several peaks for the 7th degree which negate its improved R2 value. ... 124 Figure C61: Simulation of a spherical (0.95 cm diameter) absorption contrast target at various depths at a background contrast of 1:0. The depths ranged from 1-3.0 cm at a 0.5 cm spacing with the center of the circle at location 2.5,2.5 cm - x,y as demarcated by a black circle ... 124 Figure 62: Block diagram of frequency domain homodyne system. Reproduced from reference [53]. ... 138 Figure 63: The breast shaped mold (provided by Imaging Diagnostic Systems Inc.) showing the (a) top view, and (b) internal hollow structure ... 139
xiii
LIST OF TABLES
TABLE PAGE
Table 1: Advantages and Disadvantages of various imaging modalities commonly used for cancer prognosis and diagnosis [34-35]. ... 7 Table 2: List of sources applicable to NIR imaging ... 17 Table 3: List of detectors applicable to NIR imaging ... 18 Table 4: Comparison of hand-held optical imagers developed to date by various research groups, the table is condensed to only significant changes within the development of the imagers. Abridged from reference [7]. Acronynms found in the table for brevity: DOI- Diffuse optical imaging. FDOI- Fluorescence diffuse optical imaging, FDOT- Fluorescence diffuse optical tomography, US- Ultrasound, FD- Frequency Domain, CW- Continuous wave,
APD-Avalanche photodiode, PMT- Photon multiplier tube, CCD- Charge coupled device [2] ... 22 Table 5: Comparison between existing Hand-held devices VS Gen-1 Hand-held optical imager ... 24 Table 6: The drawbacks of the Gen-1 optical imager and solutions on the instrumentation for the Gen-2 optical imager ... 31 Table 7: Quantitative details of the detected target location, size and measurement errors for different experimental cases using the Gen-1 and Gen-2 imager. ... 78 Table 8: Calculated T:B ratios (factoring in the absorption coefficient of liposyn) ... 82 Table 9: Experimental studies using reflectance imaging using a .45 cc India ink target
(concentration of India ink included 0.8, 0.08 and .008% by volume) on a 10×10×10 cm3 liposyn phantom (1:0, 1000:1, 100:1, and 10:1 target to background contrast ratios). Cases where successful target localization (Within 1 cm of true target location) occurs are displayed by shaded gray. ... 83 Table 10: Experimental studies using transillumination imaging using a .45 cc India ink target (concentration of India ink included 0.8, 0.08 and .008% by volume) on a 10×10×10 cm3 liposyn phantom (1:0, 1000:1, 100:1, and 10:1 target to background contrast ratios). Cases where
successful target localization (Within 1 cm of true target location) occurs are displayed by shaded gray. ... 84 Table 11: Experimental cases for simultaneous bilateral reflectance and transillumination
imaging studies. In all the studies 3% Liposyn solution was used in the background phantoms and a 0.45 cc target was with 0.08% India Ink + 3% Liposyn solution. In
experimental studies with the a 100:1 contrast ratio the background contained 0.0008% India ink by volume. ... 87
xiv
Table 12: Table 2. Quantitative details of the detected target location, size, recovered T:B contrast and measurement errors for different experimental cases using the Gen-2 imager
towards reflectance imaging studies. ... 96 Table 13: Quantitative details of the detected target location, size, recovered T:B contrast and measurement errors for different experimental cases using the Gen-2 imager towards
transillumination imaging studies. ... 98 Table 14: The calculated, true target location, target size, contrast, and measurement error for all experimental cases of reflectance performed. ... 131 Table 15: The calculated, true target location, target size, contrast, and measurement error for all experimental cases of transillumination performed ... 137
xv ACRONYMS NIR-Near infrared imaging
NIRS-Near infrared spectroscopy DOI- Diffuse optical imaging. DOT- Diffuse optical tomography
FDOI- Fluorescence diffuse optical imaging, FDOT- Fluorescence diffuse optical tomography, US- Ultrasound,
FD- Frequency Domain, CW- Continuous wave, APD-Avalanche photodiode, PMT- Photon multiplier tube, CCD- Charge coupled device T:B- Target to background
MRI-Magnetic Resonance imaging US-Ultrasound
Gen-1 Generation 1 hand-held optical imager Gen-2 Generation 2 hand-held optical imager
1
CHAPTER 1 -Introduction
Near infrared imaging (NIR) (or spectroscopy) is a promising non invasive, non-ionizing technology that is being developed for brain (connectivity analysis, oxygenation, etc), breast (cancer diagnosis and prognosis, etc) and sports medicine. NIR imaging of breast tissue is based upon the endogenous absorption contrast due to the non-specific process of angiogenesis, allowing for distinction between normal and diseased tissue [1-6] (for theory see section 2.1-2.2). In recent years, optical imagers were developed in an attempt to translate the near-infrared (NIR) imaging technology to clinic breast imaging [7-28], with maximum patient comfort and portability. Two main types of optical imagers bed-based and hand-held were developed. Bed-based imagers are typically bulkier and have fixed detector spacing, while hand-held imagers are smaller. However many hand-hand-held imagers have not been adaptable to different tissues (limited tissue contact), focused on spectroscopic measurements and limited to two dimensional (2D) tumor detections demonstrating tomographic reconstructions when employed in conjunction with Magnetic Resonance Imaging (MRI) or ultrasound (US).
A novel (Generation-1 or Gen-1) hand-held optical imager was recently developed in our Optical Imaging Laboratory [29-30] (see section 2.8). The unique features of this hand-held imager include: (i) flexibility imaging both large surface areas (5×10 cm2) and different tissue curvatures (0o – 45o) rapidly, (ii) performance of reflectance imaging from the handheld design, similar to ultrasound; and (iii) ability to perform 3D tomographic imaging (using the tracked positional information of the probe during imaging).
However, the Gen-1 optical imager was limited by: (i) contact on curved tissues (leading to false positives), (ii) A single probe head, although flexible to curve up to 45º is not capable of collecting transilluminated optical signal. (iii) An aluminum based probe head is not patient
2
comfortable (i.e. metal feels cold to skin) and (vi) An uneven source distribution prevented target recovery at all points on the probe.
Herein, a Generation-2 (Gen-2) hand-held optical imager is developed as a portable device with improved features appropriate towards (future) in-vivo breast imaging studies and clinical translation of the technology. In the following sections, the instrumentation development of the imager is described (see section 3.1). The effect of the improved instrumentation in enhancing target detectability is experimentally validated from tissue phantom and preliminary human subject studies (see chapters 4-7).
Objective
The objective of this thesis is the development of a second Generation portable hand-held optical imager capable of reflectance and transillumination imaging on tissue phantoms and healthy human subjects. With the successful implementation of the technology at the laboratory level, there is potential for the clinical translation towards diagnostic as well as prognostic breast cancer imaging.
Specific task 1: (Chapter 3) Develop the second Generation hand-held optical imaging imager.
Experimental Study #1: (Chapter 4). Comparison of the Gen-2 imager with the Gen-1 with regards to target detectibility in phantoms.
Experimental Study #2: (Chapter 5) Comparison of reflectance and transillumination on phantoms to determine maximum depth at which targets can be recovered and at which contrast ratios
3
Experimental Study #3: (Chapter 6) Imaging of curved tissue phantoms using reflectance and transillumination
Experimental Study #4: (Chapter 7) In-vivo imaging of human breast tissues. Thesis Layout:
Chapter 2 contains the background work for this thesis, it includes the theory of optical imaging, comparison of optical with other imaging modalities, an overview of other hand-held optical imagers developed to date and a description of the Gen-1 imager complete with modifications for the Gen-2 imager. Chapter 3 contains the instrumentation of the second Generation hand-held optical imaging system. Chapters 4-7 experimental studies focus on the viability and testing of the Gen-2 imager, initially conducted on liquid phantoms and progressing to gel phantoms an finally human subject studies.
4
CHAPTER 2: Background
The background chapter provides an explanation of the basics of near-infrared optical imaging, its theory, measurement approaches, and the description of various optical imaging devices to date. The hand-held optical devices developed to date by various researchers are also described, followed by the motivation to the development of the second Generation (or Gen-2) hand-held optical imager.
2.1Basic information on near-infrared optical imaging
Optical wavelengths extend from about 300-1300 nm. The energy found in these wavelengths is <10 electron volts (eV) meaning the energy found in optical wavelengths is non-ionizing. Within this optical range is the near infrared (NIR) region which is found from around 700-900 nm [31]. Wavelengths of light from 700-900 nm are minimally absorbed and preferentially scattered upon interaction with biological breast tissue (figure 1). These particular absorption and scattering coefficients allow for much deeper light penetration than possible at other optical wavelengths. The reason for low absorption is that the main absorbers in physiological tissue water, oxy- and deoxy-hemoglobin absorb less light than at other wavelengths [32].
5
Figure 1: Spectrum of absorption from 200-5000 nm. The biological optical Imaging window allows deeper penetration of light from the wavelengths of around 700-900 nm due to minimal absorption by the tissue
components, HbO, Hb and H2O in this wavelength range. Reproduced from [33]
Deeper tissue penetration allows optical imaging to be implemented as an imaging technology for breast cancer diagnosis and prognosis. Table 1 compares optical with other established imaging modalities [34-35]. The table displays that imaging modalities (with the exception of MRI, optical and ultrasound) submit the patient to radiation exposure to produce the image. Similar to the two extremes of radiation exposure the resolution provided by these imaging modalities ranges from poor (Nuclear, Ultrasound) to excellent (MRI) while providing different types of information. Nuclear, MRI (contrast aided) and optical can provide functional (metabolism and blood flow) information while the rest of the modalities are anatomical in nature (location of hard and soft tissue) including the standard MRI. Imaging time is also variable between the different techniques, with optical, ultrasound and standard x-ray requiring substantially less time than the other modalities. The imaging devices’ price ranges are quite wide with optical and ultrasound near the bottom and MRI, and nuclear at the top. Optical
6
imaging provides a functional imaging modality with decent resolution and contrast while requiring less imaging time than nuclear and MRI for a less expensive device. The combination of benefits offered by optical imaging in terms of imaging time, resolution, contrast, and cost suggest that optical imaging is a worthwhile technology for cancer diagnosis and prognosis.
7
X- Ray CT Ultrasound MRI Nuclear Optical
Radiation Ionizing Ionizing Non- Ionizing Non- Ionizing Ionizing Non- Ionizing
Resolution Good Good Poor Excellent Poor Resolution varies
according to depth
Contrast Poor Poor Poor Good Good Good
Portability Portable Not Portable Portable Not Portable Not Portable Portable
Expense Inexpensive Expensive Inexpensive Expensive Expensive Inexpensive
Information Structural Structural Structural Structural Functional Functional
Imaging time Fast (less than 5 min)
Medium (less than 30 min more than 5 min)
Fast (Less than 5 min)
Slow (over 30 min) Slow (over 30 min) Fast (less than 5 min)
Physics High energy x-rays
travel in a straight path and are attenuated by interaction with tissue
3D arrays of x-rays travel in a straight path and are attenuated by interaction with tissue
Acoustic waves (mechanical) are introduced into the body and are reflected back towards a receiver RF signal is used to align water molecules to a changing magnetic field and the resultant RF signal is collected
High energy radioactive isotopes create gamma rays that travel in a straight line towards detectors Optical light is introduced into a tissue and is reflectance and absorbed by tissue interactions
8 2.2Theory of near-infrared optical imaging
Biological tissue is a high scattering low absorption medium or high (probability of photon scattering by a medium per unit path length) low (probability of absorption by a medium per unit path length). When scattering occurs the photon is directed within a range of possible deflection angles g (average of cosine of scattering polar angle by single scattering). Figure 2 shows an input light and the possible paths that it can undergo as it travels through a tissue medium. Initially the light undergoes specular reflection, which is the reflection due to the refractive index (n) mismatch between the mediums that the tissue is propagating out of and into ( angle of incoming or reflected light). Snell's equation (1) is used to determine the angle of the reflected light due to the reflectance index mismatch.
[ × = × ] (1)
The light transmitted into the tissue undergoes absorption and scattering due to molecules that compose the tissue. Scatterers are molecules that cause the deviation of a photon from the initial path. Examples of scatterers in the body include lipids and proteins. The number of scatterings interactions in tissue is so many that a very small percentage of NIR photons tend to travel straight. Photons are defined by the path taken and could be placed in three categories, ballistic, snake and diffuse [32]. While ballistic photons encounter no scattering interactions, a diffuse photon undergoes various scattering interactions before emerging out of the medium or being completely absorbed.
9
Figure 2: Photons traveling through tissue can reach the same destination using different paths. Ballistic photons travel without any scattering events. Snake photons are minimally scattered. Diffuse photons are heavily scattered.
Collection of light at specific locations increases the likelyhood of detectiong one type of photon as opposed to another. Adapted from [32]
By definition a photon is considered diffuse when it has encountered at least 10 scattering events, where the average distance traveled for a single event is the transport mean free path denoted by equation (2).
= (2)
where
( ) -- transport mean free path and , ( ) -- is the transport interaction coefficient.
The transport interaction coefficient equation (3) is dependent on reduced scattering coefficient ( ) and absorption coefficient ( ).
= + (3)
The reduced scattering coefficient equation (4) is the probability of equivalent isotropic photon scattering by a medium per unit pathlength. ( )-- anisotropy factor
10
The values of and are found prior to an experiment (via a homodyne or heterodyne device) to ensure the values are similar to human breast tissue. The variable and represent the
optical properties of a medium and can be used to generate the equation (5)
which is the exponential decay rate of fluence far from the source.
= 3 ( + ) (5)
With the i) , (optical properties of the given medium), the assumption of ii) an isotropic (and homogenous) source, iii) high scattering and low absorption medium the propagation of light can be modeled via the photon diffusion equation (Equation 6). Other methods to model the propagation of light included a microscopic approach as is provided using Maxwell's equations which although more fundamental and exact are computationally more expensive. The method of modeling chosen is using the radioactive transport equation, which with several assumptions that ease the computational requirements in biological tissue Ggnerate equation (6) the photon diffusion equation. The assumptions required for Diffusion equations are (i) isotropic source (light is uniform intensity and angles); (ii) (μs’ >> μa probability of scattering is much greater than probability of absorption)where the scattering length is much smaller than the mean free absorption length in the medium; and (iii) the light is diffuse, i.e. at least 10 scattering lengths between the point of illumination to detection
(r→, t) = ( →, )+ Φ(r→, t) − ∇ ∙ [D∇ Φ(r→, t)] (6)
where (t)-- time , (r→)--direction vector), Φ(r→, t)--fluence rate or intensity, (r→, t)-- isotropic
source term.
D = ( + ) (7)
In equation (7) D it is the coefficient linking the flow of photons to the gradient of fluence in Fick's law.
11
2.2.1 Boundary Conditions
Boundary conditions were suggested to represent the tissue boundaries they include (i) reflective index matched boundary, (ii) reflective index mismatched boundary and (iii) zero boundary condition [32,35].
(i) Reflective index matched boundary condition
In the case of a reflectance index matching boundary as with water and soft tissue, no light propagation into the scattering medium from the ambient medium occurs. Hence the fluence rate is set to zero at an extrapolated boundary located at distance zb.
Φ(r→, t) − 2D ( →, )= 0 (8)
where Φ(r→, t) = 0 at z
b=2D
(ii) Refractive index mismatched boundary
In the case of a reflectance index mismatch as with tissue and air, the boundary condition is modified to follow Fresnel's reflections. Equation (9) adds the term CR to equation (8) where
equations 9-15 display the progression of the terms required to find the term (CR- index
mismatch which is a function of the effective reflectance term Reff).
Φ(r→, t) − 2DC ( →, )= 0 (9)
C = (10)
The effective reflectance term (Reff) depends on the Rθ and Rj which are determined by the refractive index nrel.
R = , (11)
R = 2sinθR (cosθ)dθ (12)
12 ( ) = ( ) + ( ) (14) = ( ) (15) ′ = ( ) (16) where Φ(r→, t) = 0 when z b=−2C D (iii) Zero boundary condition
In this boundary condition the fluence Φ is set to zero on and after the boundary (equation 17), which is simpler (in comparison to the other boundary conditions) though it is not an accurate representation of a real system.
Φ(r→, t) = 0at z=0 (17)
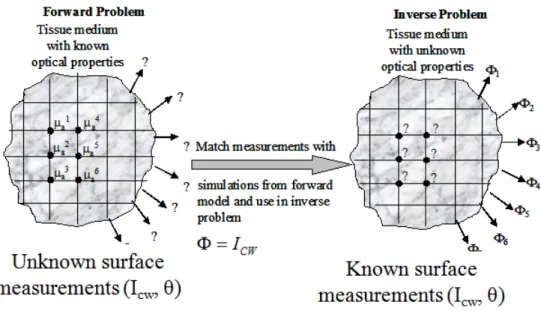
2.2.2 Forward and Inverse Problem
In a forward problem, the optical properties for the entire tissue medium are assumed to be known and the fluence is evaluated analytically and numerically for the whole of the tissue medium (figure 3). The result is an output fluence upon the surface boundary where measurements were acquired.
13
Figure 3: In the forward problem, initial source fluence and optical properties are known the resultant fluence is calculated. In the inverse problem the input (or source) and output (or detected) fluence are known (or measured)
and the optical properties are calculated. Adapted from [35].
The inverse problem employs the fluence measured on the surface of the tissue geometry and estimates the optical property map of the entire tissue volume using appropriate light propagation models in tissue and inversion algorithms [32]. The result is a 3D tomographic map of the tissue optical properties that help differentiate between normal and abnormal tissue types in the tissue volume that is imaged.
2.3Methods of optical imaging
Optical imaging requires a light source to be launched onto the tissue surface. As the light propagates, it undergoes interactions explained in section 2.2 until it is collected at the same or opposite tissue surface using appropriate detectors. The three most commonly used imaging methods are (a) projection-shadow, (b) circular tomography and (c) sub-surface imaging as seen on figure 4 [7]. Projection-shadow and circular tomography will be called transillumination and
14
differentiated by the tissue geometry (compressed vs. uncompressed) and sub-surface imaging will be referred to as reflectance imaging.
Figure 4: The 3 methods of applying optical imaging are (A) shadow projection (compressed transillumination), (B) circular tomography (uncompressed transillumination) and (c) sub-surface (reflectance) Reproduced from [7].
Reflectance imaging (Figure 4) captures photons that have been scattered in the direction that the light was initially launched. Reflectance imaging allows for a single probe design that can both illuminate the tissue and collect the returning signal.
Figure 5: Reflectance imaging is when is light is launched and collected from the same side.
Transillumination imaging is when light is launched and propagates through thickness of the tissue and collected on another side from where it was launched (Figure 6).
Tissue
Source light
15
Figure 6: Transillumination is when light is launched and collected on different surface (example: opposite surface).
2.4Measurement Techniques of Optical Imaging
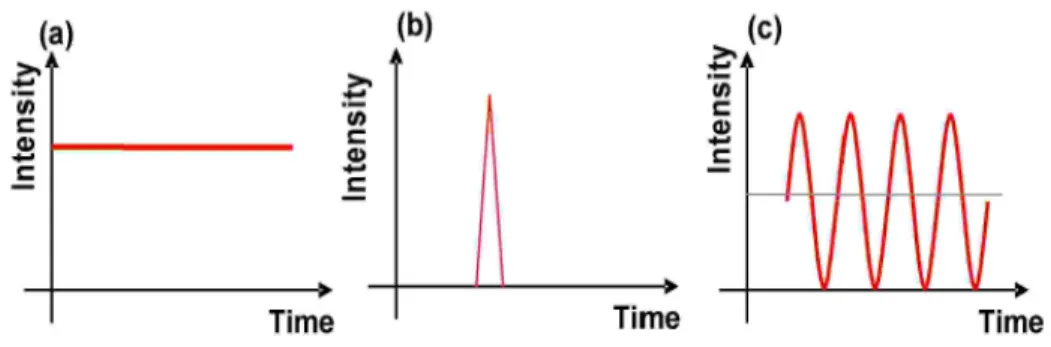
There are three possible techniques in which optical imaging measurements are acquired. (a) Continuous Wave (CW): involves collection of steady state light. The source wavelength and intensity are constant (same mW output) throughout imaging and the resultant signal is captured using appropriate detectors. CW is the simplest and hence least expensive and fastest of the three techniques discussed. (b) Frequency Domain (FD): The source and detector are modulated at a given frequency by other instrumentation. The modulated light source then propagates through the tissue and as it travels attenuation will occur towards its amplitude, and its phase will be shifted the further it travels with respect to the reference signal. The modulated attenuated signal is collected by a modulated detector and the amplitude and relative phase shift are measured. The addition of the phase provides additional information resulting in greater image contrast at the expense of increasing imaging time when compared with CW. (c) Time Domain (TD): The source is pulsed and launched onto the tissue. As the pulsed signal propagates, it is attenuated and acquired at the detector with a time lag (that is proportional to the pathlength taken by the photons). The detector measures the attenuated intensity (abu) as well as the time lag with respect to the input pulse. Time domain provides the greatest image enhancement where ballistic photons could be separated out from diffuse at the expense of a much larger imaging time when compared with CW. For this master's thesis a continuous wave system is proposed
16
and constructed. A CW system requires less instrumentation than a frequency domain system and does not require the expensive components associated with time domain imaging, thus reducing the expense. CW systems also require less time to collect images while frequency domain requires a moderate increase in time, while time domain requires a large increase [30,32,35].
Figure 7: In Continuous Wave (CW) the source provides the same output over time. B) Time domain uses a short duration pulse of light. C) Frequency domain (FD) relies on modulating a source output like a sinusoidal wave.
17 2.5Light Sources
NIR imaging can be performed with multiple or single wavelengths, provided by different choices in light sources. Below is a table listing the possible sources that could be employed in NIR imaging (www.Thorlabs.com),(www.edmundoptics.com).
Sources Description Lamps. i.e. broad spectrum sources Broadband light sources emit a large spectrum of light
that can then be reduced via appropriate filters to the wavelength of choice. The wide spectrum makes this the source of choice for spectrum analysis.
Pulse Lasers Pulse lasers can be found at specific wavelengths and produce a signal that pulses with a set period.
Tunable lasers Tunable lasers provide an accurate, steady,
monochromatic signal.
LED (light emitting diodes) LEDs are an inexpensive source that could be purchased either monochromatic or broad band. Stability could be variable as with any diode device especially if from different silicon wafers.
Diode Lasers Diode lasers provide an inexpensive monochromatic source that could be stabilized with laser mounts and controllers.
Table 2: List of sources applicable to NIR imaging
The lasers could be paired with various optical component choices depending on the requirements of the user.
18 2.6Detectors
Detectors for NIR imaging much like sources are dependent on the imaging technique employed. Table 3 below displays common types of detectors used in NIR imaging.
Detectors Description Photomultiplier Tubes (PMT) Photomultiplier tubes or (PMT) a vacuum tube
derived device is capable of capturing a light signal and amplifying it after it has been converted to an electrical signal. PMT are applied towards single point detection such as a single optical fiber.
Avalanche Photodiodes (APD) Avalanche photodiodes use the photoelectric effect to convert a light signal into an amplified electrical signal. APD are applied towards single point detection such as a single optical fiber.
Charge Coupled Devices (CCD) Collect incoming light converting it to a charge in a well. The devices pixel values correspond to the wells. CCDs are applied towards area detection and can collect light signal from multiple points. Various types of CCD are available such as (ICCD-intensified), (EMCCD-electron multiplying), etc
Table 3: List of detectors applicable to NIR imaging
19 2.7 Optical Imagers Available
Optical imagers initially start as bench-top or research systems then during clinical translation, transition into what can be broadly classified into two categories: bed-based and hand-held. Bed-based imagers can use both transillumination and reflectance as the imaging method, while hand-held imagers employ reflectance based imaging method [7].
Bed-based imagers are a category of imagers which require a subject to lie down and place the tissue to be imaged in special imaging bins or enclosures. The advantages of these imagers are listed below: 1) These imagers may use more powerful lasers (50 mW) than hand-held imagers to increase tissue illumination to facilitate transmission through the length of the tissue [2]; 2) Some of the bed-based designs simplify acquiring and processing the collected data by using techniques such as tissue compression to reduce the thickness of the tissue similar to x-ray mammography [6]; and 3) The built-in fixed source and detector locations help in 3D tomographic imaging, where 3D tumor localization and characterization is feasible. [2,35-37]. The drawbacks of the bed-based systems include: 1) The systems are typically less portable than hand-held imagers due to additional components such as the bed and breast enclosure which add to the overall size of the imager.; 2) The imaging method employed may cause exclusion of some patients populations. These excluded patients may include those with larger breasts than the imaging bins or enclosures employed in the bed-based imagers.
Hand-held imagers provide similar optical measurements as bed-based imagers, but have their own advantages and disadvantages. The advantages of the hand-held imagers are listed below: 1) These imagers can be employed to image a wide range of patient populations without any restrictions to breast volumes and/or sizes; and 2) These imagers are typically smaller in size
20
than bed-based imagers and in some cases could be easier to transport and be moved through clinical sites without restrictions.
The hand-held imagers also have limitations, which include: 1) The inability to precisely track the location of the hand-held probe during studies limits the applicability of these imagers towards 3D tomographic imaging as well as accurate tumor tracking from multiple patient visits. 2) The current imaging method for hand-held imagers rely on technicians to acquire images at desired locations in the standardized manner. This would add error to scans by different technicians if the imaging location or method changes across patients. The reason for the difference is probe placement, leading to variations in the true location of the images on the tissue; which in turn can affect the accuracy of tomographic imaging [2,30].
Several bed-based and hand-held imagers have been developed, towards imaging of biological breast tissue. Table 4 lists the current hand-held optical imagers developed, the imaging method which the device employs and the research group. The table includes significant improvements or evolution of each group's imager. From the table it is seen that the imagers developed by several groups use CW-based diffuse optical (DOI) or frequency domain (FD) imaging techniques for quick acquisition of the optical signal. The employment of CW-based DOI or FD imaging techniques require avalanche photodiodes (APD) or photon multiplier tubes (PMT) for collection of optical signal from a point source as is used by the majority of imagers. Only 2 groups applied charge coupled devices (CCD) to facilitate acquisition of multiple point optical signals from various optical fibers. The additional optical fibers decrease the number of scans and imaging time required for optical signal acquisition from a tissue area. Diode lasers are typically implemented in these imagers to reduce cost, size while maintaining production of monochromatic light. One of the imagers displayed includes a second imaging modality using
21
ultrasound, which is used to gain anatomical and positional information for the imager yielding enhanced results from only optical. However from the imagers below only FIU's optical imaging laboratory's (OIL) Gen-1 imager has displayed the ability to perform both fast 2D imaging and 3D tomographic imaging. FIU's optical imaging laboratory's (OIL) Gen-1 imager is the topic of the next section.
22 Device # Reference Modality
Meas.
Technique Source Type Detector Type Clinical Application(s) 1 Tromberg, 1997 DOI FD (300 kHz - 1 GHz) diode lasers (10-30 mW) APD
Compare optical properties of normal and benign lesion-containing breast tissue Shah, 2004 DOI FD (50-700 MHz) diode lasers (5-25 mW) APD
Measure optical & physiological properties of healthy breast tissue
Bevilacqua, 2000 DOI CW & FD (100-700 MHz) FD - diode lasers (<20 mW) CW - 150 W haloGen lamp FD - APD CW - fiber-coupled spectrograph w/ linear CCD detector
Measure the absorption spectra of normal human breast tissue Cerussi, 2007 DOI CW & FD (50-1000 MHz) FD - diode lasers (20 mW) CW - white-light source FD - APD CW - fiber-coupled spectrograph w/ linear CCD detector Predict postsurgical pathological response to neoadjuvant chemotherapy in 11 breast cancer subjects 2 No, 2005 DOI
FD (10 MHz -
1 GHz) 8 laser diodes (50 mW) APD (Phantom study) No, 2007 DOI
FD (50-300
MHz) 4 laser diodes (20 mW) APD Detect the presence of breast cancer in a human subject
3
Chance,
2005 DOI CW
light emitting diodes (10-15 mA)
silicon diode detector
Determine sensitivity and specificity of detecting breast cancer in 116 human subjects 4
Chance,
2006 DOI
FD (3 kHz)
2 light emitting diodes (20 mA)
silicon diode detector
Detection and 2D localization of brest cancer lesion in a human subject
5 Liu, 2004 FDOI
FD
(3 kHz) 4 light emitting diodes PMT (Phantom study) 6 Cheng, 2003 DOI CW
laser diodes
(0.15 W/cm2) PMT
Determine sensitivity and specificity of detecting breast cancer in 50 human subjects
Xu, 2007 DOI CW
laser diodes
(0.15 W/cm2) PMT
Detect tissue optical, mechanical, and physiologic changes under dynamic loading
7 Durduran, 2005 DOI CW long coherence laser APD
Measure blood flow contrast between tumor-containing and normal breast tissues 8 Zhu, 1999
DOT &US
FD
(200 MHz) laser diodes APD
Phantom study towards 3D tomography of breast cancer Chen, 2001
DOT & US
FD
(140 MHz) laser diodes PMT
Phantom study towards 3D tomography of breast cancer Zhu, 2003
DOT & US
FD
(140 MHz) laser diodes PMT
Image benign and malignant breast lesions in human subjects
Zhu, 2010
DOT &
US FD laser diodes PMT
Differentiate benign and malignant lesions at early-stage in breast tissue 9 Ge, 2008 FDOT
FD (100
MHz) laser diode (<5 mW) CCD
Phantom towards 3D tomography of breast cancer
Erickson,
2010 FDOI CW laser diode (<5 mW) CCD
Fast 2D imaging of fluorescent targets in breast tissue of healthy subjects 10
Solomon,
2010 FDOT CW
laser diodes (15-30
mW) CCD
Phantom & small animal study towards sentinel lymph node mapping
Table 4: Comparison of hand-held optical imagers developed to date by various research groups, the table is condensed to only significant changes within the development of the imagers. Abridged from reference [7].
23
Acronynms found in the table for brevity: DOI- Diffuse optical imaging. FDOI- Fluorescence diffuse optical imaging, FDOT- Fluorescence diffuse optical tomography, US- Ultrasound, FD- Frequency Domain, CW- Continuous wave, APD-Avalanche photodiode, PMT- Photon multiplier tube, CCD- Charge coupled device [2]
24
2.8Optical Imaging Laboratory's First Generation Hand-held Optical Imager
Translating NIR imaging systems from the bench-top to bedside (either bed-based or portable) requires improvements in patient comfort, portability, ease of use and function. Currently the hand-held imaging systems (hand-held) available have only flat probe heads (Probe head: section of the optical imaging system that contacts the tissue) causing inherent limitations as given in Table 5 [2,38-39].
Existing Hand-held optical imagers (by other research groups)
Our Hand-held optical imager
Have flat probes heads that cannot contour to tissue curvatures
Has flexible probe head to contour along tissue curvatures
Obtains only reflectance measurements which
limits depth information
Obtains reflectance and transillumination measurements from the flexible probe head design, towards greater depth information
Uses limited sources-detectors (1-8 max to date) for surface imaging of small areas
Uses multiple sources-detectors (6-165) towards tomographic imaging of large volumes.
Provide 2D images with no positional
coregistration onto tissue
Provides 2D/3D coregistered images in real time using a motion tracker
Demonstrated 2D/3D tomography only when
employed along with ultrasound
Demonstrated 3D tomographic imaging on tissue phantoms (to date) without a 2nd imaging modality
Provides only spectroscopic information Provides 3D volumetric information towards
diagnostic imaging applications.
25
A novel first Generation hand-held optical imaging system was recently developed in our Optical Imaging Laboratory. Figure 8 (red numbers display the major components that will be discussed further in the text) and on Table 3 the advantages over other hand-held optical imaging systems that use flat probes are given.
Figure 8: First Generation hand-held optical imaging system, with the (a) flexible 3-part hand-held probe, and (b) the imaging system set-up as a bench-top unit. Reproduced from [30].
2.9Optical Imaging lab Gen-1 hand-held optical imager Instrumentation 2.9.1 Gen-1 hand-held optical imager Source: 1
The first Generation hand-held optical imaging system uses a single laser mount with a
laser diode that emits light at 785 nm. The laser mount is driven and cooled by a Laser current controller and temperature controller. A collimator-diffuser package is coupled to the laser diode (and mount) in order to provide homogenous (uniform) source light to six optical fibers that are connected to the diffuser package via a single SMA connector. The source optical fibers are appropriately placed at 6 discrete locations on the probe face. The laser mount also used an RF input that could be modulated via an oscillator, when operating the imaging system in the frequency domain. [30]
1
2
3
4
26 2.9.2 Gen-1 hand-held optical imager Detector: 2
The detector employed on the first Generation hand-held optical imaging system is an intensified charge coupled device (ICCD) camera. The first Generation hand-held optical imaging system had the intensifier added (modified in-house after purchase) providing the ability to take low light images. The first Generation hand-held optical imaging system could be operated to acquire either CW or FD measurements, as described in the principal of imaging (section 2.3). The NIR signals collected from the tissue surface are imaged by the ICCD camera via the fiber bundle (containing 165 collection optical fibers). These intensity images are further post-processed to obtain the actual image of the collected NIR signal at the tissue surface. [30]
27
Figure 9: A) Full length view of the hand-held probe of the Gen-1 imager. B) Bundle of optical detection fibers. C) Probe face of the Gen-1 hand-held optical imager D) Source detector layout of the Gen-1 hand-held optical imaging probe. Adapted from [30].
2.9.3 Gen-1 hand-held optical imager Probe: 3
The hand-held optical imaging probe makes contact with the tissue surface to acquire NIR intensity signals. The optical probe consists of optical fibers bundled together where one end (Figure 9B) is placed on a circular plate (camera end) and the other is the imaging surface (Figure 9C). The hand-held probe is composed of 165 optical collection fibers and 6 source fibers mounted onto the probe. The hand-held probes imaging surface is capable of flexing each
A
B
C
28
of the joints of its three plate design from 0-45 degrees. The spacing between the optical fibers is 0.5 cm. All the details of probe face dimensions are visible in figure 9(d). The material chosen for the probe face was aluminum due to its ease of machining and durability[29,30]. 2.9.4 Gen-1 hand-held optical imager Lens Assembly: 4
An appropriate lens assembly system is placed between the ICCD detector and the fiber bundle (consisting of the 165 collection fibers). Apart from housing a focusing lens required for a focused image of the fiber bundle, the lens assembly also houses appropriate filters required to acquire NIR signals at same or higher wavelengths (e.g. excitation or fluorescence signals) [30]. 2.10 Principal of Imaging of the Gen-1 hand-held optical imager
NIR light at 785 nm is launched from the laser diode, which is split to 6 source fibers after it propagates through the collimator-diffuser package. The six source fibers simultaneously illuminate the tissue surface in contact. The launched source light attenuates and scatters as it propagates through the tissue. The extent of attenuation and scattering depend on the optical properties (absorption and scattering) of the tissue medium. Some of the light is scattered back towards the hand-held probe, which is collected by the 165 collection fibers on the probe face. The NIR signals from the fiber bundle (containing 165 collection fibers) is imaged using the ICCD camera. The steady-state intensity signals are further processed to obtain the true intensity distribution of the tissue surface being imaged. The system could be operated in either CW or FD mode. The principal of images changes between the two modes. The main difference being that, with CW mode the lasers and the images are collected at a steady state with no modulation involved. With FD mode, the lasers and the camera are modulated at a specific frequency (100 MHz in our studies) and the phase between them is changed. Detailed description of the instrumentation for CW and FD mode are provided elsewhere [30]..
29
2.11 Drawbacks and solutions for the Gen-1 hand-held optical imager
The first Generation imager was originally designed to test how effective a hand-held optical probe could be used towards target detection. The design proved to be very viable but it has drawbacks as in table 6 [38,39].
The solutions to the drawbacks of the Gen-1 imager are displayed on table. The overall goal to address specific task 1 (development of the improved hand-held optical imager) was to improve various aspects of imaging using a hand-held imager (improve target detectibility, patient comfort, and increase target depth recovery), thus creating an imager that was more suited towards the clinical environment. The improvements and modifications consisted of (i) improve flexibility and tissue surface contact, (ii) implement a forked design applicable towards bilateral and transillumination imaging, (iii) improve patient comfort, (iv) improve image quality and reduce artifact creation, (v) enhance portability and ease travel within a clinical environment, and (vi) allow for the implementation of a optical tracking system for probe positioning.
30
Gen-1 Drawbacks Gen-2 Solutions
1) The hand-held imaging probe is composed up of 3 segmented flat plates, in an attempt to allow curve tissue imaging. However having three plates caused the loss of potential contact leading to a noisier signal which could lead to false positives in human cancer patients due to specularly reflected signal at the edges of these 3 segmented plates.
1) The hand-held imaging probe was reduced in size and made up of more than three plates leading to improved flexibility. The potential benefits include such as conforming to tissue surface areas with minimal compression and potentially reducing the specularly reflected signal due to loss of contact with the tissue surface.
2) The hand-held imaging probe is composed of a single probe head, which was not effective in collecting transillumination images. A single probe design also causes stress on the optical detection fibers when flexed, thus preventing it from flexing to contour to tissue geometries. The design was chosen to image large areas at once but it was determined to be difficult to place and hold on tissue surfaces for the length of the imaging studies.
2) The hand-held imaging probe was split from a single face to a forked probe design which would reduce the size of each probe while keeping the total imaging area the same. Leading to high quality images due to better position, and ease of use. The forked design also requires less optical fibers per probe causing less stress on the optical fibers during positioning.
3) The hand-held imaging probe is composed of an aluminum probe face, which is machine able and easy to work with in terms of fiber attachment. However, the thermal transfer properties of the aluminum are not patient friendly; aluminum feels cold to the touch and could cause discomfort especially when placed on more sensitive tissues. The technician holding the device would suffer from fatigue during an experiment, due to the weight of the Hand-held probe (~2 lbs), thus negatively impacting the imaging results.
3) The hand-held imaging probe was manufactured from materials that prevent quick thermal transfer, and thereby increasing patient comfort with the imaging process. Also a change of material would also reduce the weight of the probe possibly reducing technician fatigue associated with having to place and hold the optical probe during imaging.
31
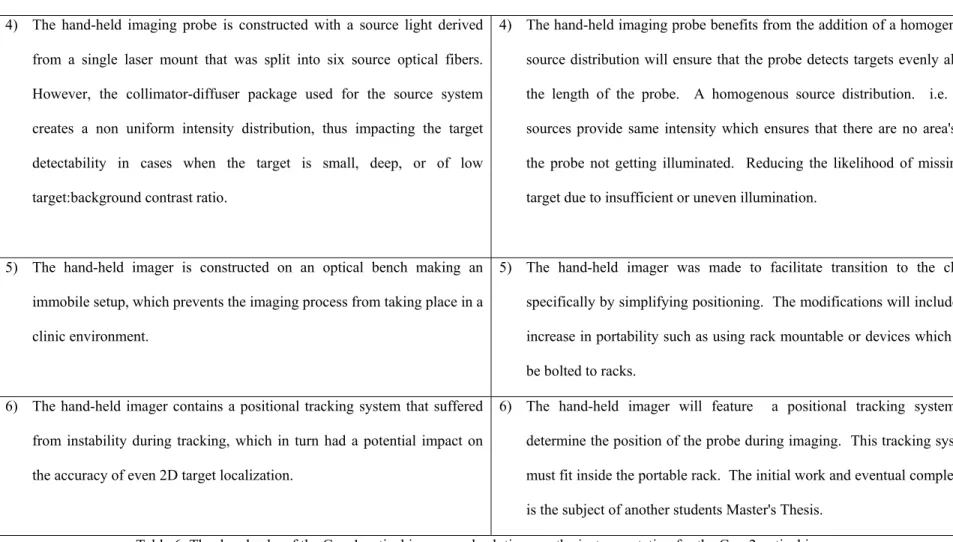
4) The hand-held imaging probe is constructed with a source light derived from a single laser mount that was split into six source optical fibers. However, the collimator-diffuser package used for the source system creates a non uniform intensity distribution, thus impacting the target detectability in cases when the target is small, deep, or of low target:background contrast ratio.
4) The hand-held imaging probe benefits from the addition of a homogenous source distribution will ensure that the probe detects targets evenly along the length of the probe. A homogenous source distribution. i.e. all sources provide same intensity which ensures that there are no area's on the probe not getting illuminated. Reducing the likelihood of missing a target due to insufficient or uneven illumination.
5) The hand-held imager is constructed on an optical bench making an immobile setup, which prevents the imaging process from taking place in a clinic environment.
5) The hand-held imager was made to facilitate transition to the clinic specifically by simplifying positioning. The modifications will include an increase in portability such as using rack mountable or devices which can be bolted to racks.
6) The hand-held imager contains a positional tracking system that suffered from instability during tracking, which in turn had a potential impact on the accuracy of even 2D target localization.
6) The hand-held imager will feature a positional tracking system to determine the position of the probe during imaging. This tracking system must fit inside the portable rack. The initial work and eventual completion is the subject of another students Master's Thesis.
32
2.12 Summary
The drawbacks of the first Generation imaging system were addressed by the modifications mentioned in table 6. In the materials and methods section of this proposal the instrumentation is listed and explained. The resulting system is labeled the Gen-2 hand-held optical imager. The system is portable, capable of CW, transillumination via two probe head design and able to contour to tissues effectively with its 5 plate design.
33
CHAPTER 3: Materials and Methods:
The Gen-1 hand-held optical imager has been previously described in chapter 2, section 2.8-2.11. Section 2.11 described the drawbacks of the Gen-1 hand-held optical imager along with several modifications (table 6). The advantages and disadvantages of the Gen-2 hand-held optical imager are related to the choice of material and the probe design. It should be noted that the Gen-1 was not very appropriate to fit curved tissue geometries with maximum contact, since it was developed primarily towards tissue phantom studies. The following sections describe the development of the main components of the instrumentation (sources, imaging probe, and detector) and the processing method employed to create the 2D surface plots while the experimental studies performed to date will be discussed in chapter 4-7.
3.1Instrumentation
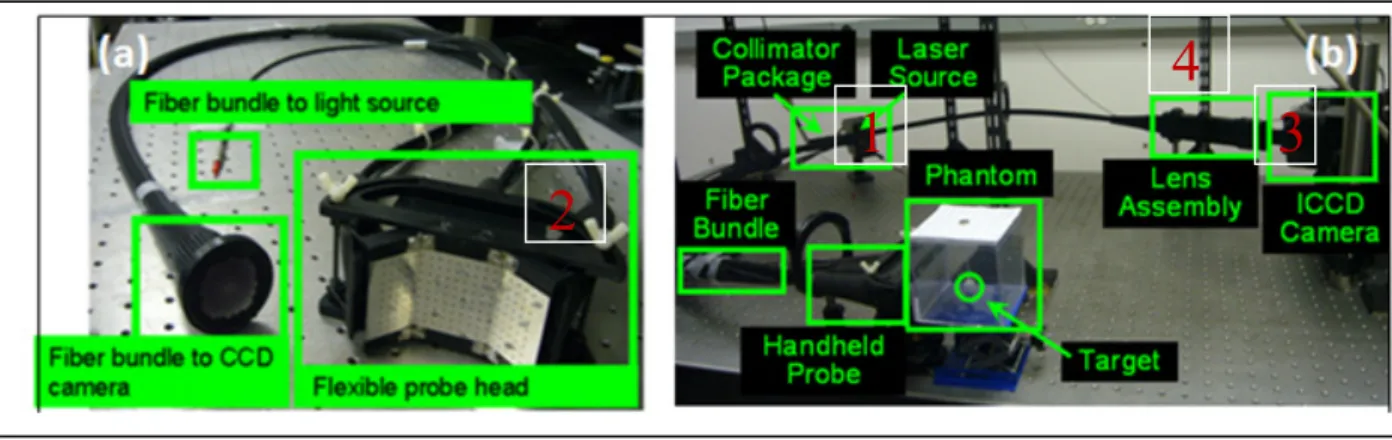
The instrumentation section below directly corresponds to specific task # 1, which was to develop a Gen-2 hand-held optical imager. Figure 10 illustrates the instrumentation that was assembled within the portable enclosure. The Gen-2 hand-held optical imager includes light sources (provide illumination), hand-held probe (contacts imaging surface), and detector (measures optical signal).

![Table 1: Advantages and Disadvantages of various imaging modalities commonly used for cancer prognosis and diagnosis [34-35].](https://thumb-us.123doks.com/thumbv2/123dok_us/267489.2527444/23.1188.101.1090.110.739/advantages-disadvantages-various-imaging-modalities-commonly-prognosis-diagnosis.webp)