The Sw edish P ension System – Ann ual Repor t 2005
The Swedish Pension System
Annual Report 2005
In Sweden, the national old-age pension system repre-sents the largest single financial commitment of the central government. In addition to the one and a half million Swedes already receiving pensions, some six million persons of working age have earned pension credit in the system. At age 65, the average insured individual has accumulated pension credit of about SEK two million. In 2005 the total financial commitment of the pension system was SEK 6 730 billion – equivalent in value to Sweden’s total production for two and a half years.
In the Annual Report of the Swedish Pension System, the assets and liabilities of the system are presented according to the principles of double-entry bookkeeping. This new application of conventional accounting clearly reflects the economic and demographic relationships and processes that determine society’s capacity to provide a financially and socially sustainable system of pension insurance. For this reason, the Annual Report should be interesting reading for everyone concerned with social or economic policy.
B A C D E F H G I J K L
Your Pension Accounts
Average Svensson
Street 1
123 45 Sweden
Changes in your accounts during 2005, in SEK
Your national old-age pension balance
Total balance of your accounts: SEK 618 594
Value, 31 December 2004
Pension credit recorded for 2004
Inheritance gain
Charge for administrative costs
Change in value
Value, 31 December 2005 **
Inkomstpension Premium Pension
550 419 + 25 740 + 1 582 – 297 + 15 615 583 854 22 512 + 4 251 + 53 – 60 + 8 056 34 740
* Includes change in the value pension investment funds and interest on pension credit for 2004.
** The difference between the closing balance and the total of the items above is due partly to changes in tax assessment and to the fact that some individuals have drawn a pension during the year.
*
The front cover shows a subset of the pension assets of insured individuals in the form of a scatter diagram. Each point (square) represents the amount of an inkomstpension account balance. A white square shows the balance for one person. The darker the color, the more people with that particular balance. The illustration includes pension account balances between SEK 600 000 and 1 100 000 for persons aged 34–38. In the upper left corner, the balance is shown for an average individual, Mr. or Ms. Average Svensson, who is about 38 years old and has an inkomstpension account balance of approximately SEK 584 000.
The total of the pension account balances of all individuals is equal to the pension liability to the economically active population.
Your Pension Credit for 2004
Average Svensson
Street 1
123 45 Sweden
5 December 2005
The Tax Authority has determined that your
pension-qualifying income for 2004 are as follows:
Income from employment SEK 166 705
Other earned income SEK 4 775
The Swedish Social Insurance Agensy has determined that your pension-qualifying amounts for 2004 are as follows:
Sickness and activity compensation SEK 3 124
Compulsory national service SEK 191
Studies SEK 2 110
Child-care years SEK 3 717
Your pension base (the total of your pension-qualifying
income and pension-qualifying amounts) is: SEK 180 622 New credit for the
Inkomstpension in 2004
SEK 28 900
New credit for the Premium Pension in 2004
SEK 4 516
Your pension credit corresponds to the contributions paid into the pension system by you, and on your behalf by your employer and in certain cases the central government. On the basis of your pension-qualifying income (your annual earnings up to SEK 317 250 after deduction of your individual pension contribution), the Swedish Social Insurance Agency has determined as follows:
Your new pension credit is added to the credit you have previously earned and is reported in your pension accounts. For the current balances of your accounts, see page 2.
DECISION
The legal provisions for this decision are found in chapters 2-4 of the act on Earnings Related Old Age Pension (1998:674).
If you wish to appeal any determination, write to the Swedish Social Insurance Agency (Försäkringskassan). Indicate which determination you wish to appeal, how you would like it to be changed, and why. Include your name, personal identification number, address, and telephone number. Be sure to sign your appeal. If you have appointed an agent to act on your behalf, the agent may sign for you. In that case, you need to include a written power of attorney with your appeal. The Swedish Social Insurance Agency must receive your appeal by 31 December 2006, or if you have not been notified of the Agency’s decision by 1 November 2006, within two months
5 846 136
*persons
with inkomstpension accounts
See page 22 See page 11 Inkomstpension, millions of SEK Premium pension, millions of SEK 125 118 23 624 296 –335 44 776 193 077
* 5 557 847 persons with premium pension capital B A C D E F H G I J K L 3 217 824 150 482 9 246 –1 738 91 285 3 413 291
Published by: Swedish Social Insurance Agency Editor: Ole Settergren
Project Manager: Anna Röstberg
Adaptation and analyses of data: Åsa Andersson, Gudrun Ehnsson, Jan Eriksson, Nils Holmgren, Lena Lundkvist, Boguslaw D. Mikula, Tomas Pettersson, and Anna Röstberg.
Also participating in the preparation of the report: Atosa Anvarizadeh, Andrzej Dudziuk, Pia Fagerström, Hans Karlsson, Helena Kristiansson-Torp, John Tseung, Monica Welmer, and Lars Billberg, Karin Leth, Gerd Wallström, PPM.
Special Feature Article: Lena Lundkvist.
Further information on social security in Sweden is available on the web www.forsakringskassan.se. Information on the premium-pension system can be found at www.ppm.nu.
For information on the National Pension Funds, please see the websites of each fund; www.ap1.se, www.ap2.se, www.ap3.se, www.ap4.se, and www.ap6.se.
Swedish Social Insurance Agency Head Office
Adolf Fredriks kyrkogata 8 SE-103 51 Stockholm Telephone: +46-8-786 90 00
E-mail: huvudkontoret@forsakringskassan.se Gaphic Production: Kristina Malm
Cover: JOJ Grafik
Translation: Richard Wathen
Preface ... 5
Accounting for the Result of the Pension System in 2005 ... 8
Income Statement and Balance Sheet ... 10
Notes and Comments ... 13
Accounting Principles ... 27
Regulations and Guidelines ...27
Where Do the Figures Come From? ...27
Principles for Valuation of Assets and Liabilities ...28
Valuation of Inkomstpension Assets ...28
Valuation of Inkomstpension Liabilities ...29
Valuation of Premium Pension Assets and Liabilities ...30
Audit Report ... 32
How the National Pension System Works ... 33
Almost Like Saving at the Bank … ...33
… but Entirely a Form of Pension Insurance ...33
One Krona of Pension Credit for Each Krona Contributed ...34
Who Pays the Contribution? ...34
Where Does the Contribution Go? ...35
Interest on Contributions That Gave Rise to Pension Credit ...38
A Rate of Interest Other Than the Income Index – Balancing ...38
Pensions Reduced by Costs of Administration ...39
How is the Inkomstpension Calculated? ...40
How is the Premium Pension Calculated? ...40
Guaranteed Pension ...41
ATP ...42
Three Scenarios for the Future of the Pension System ... 43
Net Contribution ...44
The Buffer Fund ...45
Financial Position of the Inkomstpension System ...46
Development of Pension Levels for Different Birth Cohorts ...47
Life Expectancy Effect and Retirement Age Required ...49
Balancing, Rate of Return and Guaranteed Pension ...50
Special Feature Article: What Affects the Balance Ratio? ... 52
Is the Low Balance Ratio Surprising? ...53
What Has Affected the Balance Ratio? ...53
How Is the Balance Ratio Affected? ...58
List of Terms ... 60
Appendix A. Calculation Factors ... 67
Appendix B. Mathematical Description of the Balance Ratio ... 72
Preface
Preface
The preface to an annual report is frequently used to credit a good result to meritorious performance by the organization and its employees – or to blame a loss on unfavorable circumstances beyond the organization’s control. The result of the pension system for 2005 was SEK 20 billion. Is that good or bad? And to what degree do the authorities concerned deserve the credit or blame?
With assets and liabilities amounting to SEK 6,730 billion, equivalent to Sweden’s entire production of goods and services for two and a half years, The Annual Report of the Pension System is somewhat out of the ordinary. Yet the similarities between this report and those of ordinary companies are greater than the differences. The bottom line – the result for the year – is just as for a conventional business the increase in assets minus the increase in liabilities incurred during the year. The assets of the pension system, however, are calculated by a method specially developed for a primarily unfunded pension system, whereas the liabilities are reported according to generally accepted accounting principles.
What Is a Good Result?
Pensioners and pension savers naturally want their pensions to be as high as possible. This implies that they would like the liabilities of the pension system to increase as much as possible, though of course there is a limit to how much the liabilities – pensions – can be allowed to grow. A positive result, may be interpreted as the system is economizing, in other words, that it does not provide as high a return on the pension liability as it could afford.
The rate of return on the pension liability, that is the annual indexation of pensions and of inkomstpension* accounts, is determined by the growth in average income. The result of the pension system, however, depends primarily on whether the percentage increase in average income is greater or lesser than the percentage increase in the contribution base. If average income is rising faster than the contribution base, negative results are more likely; if the con-tribution base is growing faster than average income, positive results are more likely. Thus, a positive result for the pension system is neither good nor bad in itself. If pensions are to increase at a desirable rate, the principal requirements are healthy growth in average income and a retirement age that increases as life-expectancy rise. Even then, the pension system can report positive as well as negative results. Positive results mean higher assets in relation to liabilities and a stronger balance ratio; negative results weaken the balance ratio.
* The Swedish name, inkomstpension, for the notional defined contribution, pay-as-you-go financed pension will not be translated in this report. The name refers to the fact that the indexation of this pension is a function of the growth in average income. The Swedish word for income is inkomst.
Preface
With the strong growth in incomes in recent years and increasingly large birth cohorts reaching retirement age, income-based pensions have shown a strong upward tendency; see the adjacent diagram. But thanks to the pension reform and the buffer funds, there is no cause for concern that this high-er cost to the system lacks financing, or that it will crowd out other urgent commitments by the national government. The system is designed so that it always can finance its expenditure with a fixed contribution rate and the assets of the buffer fund. Naturally, this financial stability is not a gift from on-high. Rather, the explanation is that the value of pensions is not guaranteed, but depends on the development of the economy. If growth in incomes slows down, so will the increase in the value of pensions. It is almost cer-tain that in some future economic downturn, there will be years with a negative development in the real value of income-based pensions. If inflation is as modest then as it is now, pensions may even decrease in nominal terms. In such case, however, individuals with the lowest pensions will not be affected, because the guaranteed pension ensures that their total na-tional pension will always keep pace with prices.
Who Is Responsible for the Result?
Of course the Swedish Social Insurance Agency has no influence over the development of the average income in Sweden, or of total income. Nor are we responsible for the capital management of the buffer funds or the premium pension funds. Thus, the Swedish Social Insurance Agency has virtually no way of affecting the development of the balance ratio. But what we can do, and are obliged to do, is to spread information about the pension system and to manage the system as cost-effectively as possible. Now that the pension reform has been fully implemented, it is natural to focus more on cost ef-fectiveness. The costs for the Swedish Social Insurance Agency are headed in the right direction, and our efforts to maintain that course will continue.
Considering the personal pension information sent out each year together with the Premium Pension Authority (PPM) in the ”Orange envelope” to all covered by the pension system and the system-level information provided by the Annual Report, I would contend that the Swedish Social Insurance Agency has been successful in its task to provide information. With the orange envelopes and the pension website www.minpension.se, together with the Annual Report of the Pension System, the Swedish Social Insurance Agency provides abundant high-quality information on people’s pensions. The pen-sion statement in the orange envelope is focused on the individual, whereas the Annual Report is, roughly speaking, the aggregate of all individual pension statements. To ensure and further improve the quality of the information on the system, and public confidence in that information, the Swedish Social Insurance Agency has taken the step of commissioning independent auditors to review the Annual Report of the Pension System, beginning with fiscal
Change in Costs of Social Insurance, 2005
In 2005, disbursements in the six areas of social insurance policy totaled SEK 414 billion –5 0 5 10 Financial assistance to families Financial assistance to the handicapped Income index 2.7 %
Price-related base amount 0.8 %
–6.2 12.4
1 12 29 15 40 3
Inkomstpension and ATP Average 2.0 %
Compensation for disability
Financial assistance to the elderly
Health care
Percentage of the SEK 405 billion disbursed in 2004
Preface
Nevertheless, much work remains to be done, particularly in regard to information. The knowledge of insured individuals about their public pen-sions is not bad, but it could be better. This matter may be especially urgent since our studies reveal a clear connection between how much individuals feel they know about their pensions and their trust in the system. One factor that complicates the task of providing information on the pension system is that pensions are a market where significant financial interests are involved. It is far too common that insurance companies and banks try to generate demand for their savings products by arousing worry about the size and se-curity of future pensions. The role of the Swedish Social Insurance Agency in this situation is to provide correct and balanced information.
As for the financial result of the pension system, obviously the Swedish Social Insurance Agency can neither claim the glory for positive figures, nor take the blame for negative ones. But this does not mean that we have made no contribution to the result. To the extent that we can spread knowledge about what is required to provide both good pensions and a financial sus-tainable pension system, there is probably an effect on the bottom line. The transmission of knowledge and its importance for the result of the system is discussed in this year’s special feature article that describes the development of the balance ratio. Among other things, the article analyzes the surprisingly large negative effect of the increase in the basic tax deduction on the result of the pension system.
Another aspect worthy of special mention is that in both the sick-pay and disability insurance and the pension insurance, high uptake of benefits tends to depress the level of benefits. For the pension system, high uptake means a low retirement age. The fact that we are living longer and will therefore draw pensions for more years will make it increasingly necessary for us to keep working longer before we retire. Until 1976, the retirement age in the national pension system was 67. When the ATP system was introduced in 1960, the remaining life expectancy at age 65 was 14.5 years; it is currently 18.8 years and is increasing by more than a month each year. Unless we work longer in the future than we do today, pension levels will decrease.
The Swedish Social Insurance Agency is responsible for achieving the legislator’s goal of a social insurance system that recognizes each individual’s working capacity, not just incapacity. In the future, this key mission will be-come increasingly important also in the Swedish Social Insurance Agency’s administration of pensions.
Stockholm, April 2006
Curt Malmborg
Accounting for the Result of the Pension System in 2005
Accounting for the Result of the
Pension System in 2005
The Inkomstpension
The inkomstpension is so designed that the change in the value of the pen-sion liability is closely linked to the changes in the value of the system’s assets and liabilities. However, since the two sides of the balance sheet may change at slightly different rates, the result reported by the inkomstpension system can be either positive or negative. Since the total assets and liabilities of the system are so vast – SEK 6.500 billion – the result is often sizable as a mon-etary amount. If the accumulated surplus becomes a deficit, balancing will be activated. The system will then be guided toward a balanced surplus/deficit of SEK 0 as the indexation of pensions and pension balances is adjusted down-ward. Any accumulated surplus arising after balancing has been activated will be used directly to raise the rate of indexation and thereby restore the value of pensions as far as possible.
The assets of the inkomstpension system consist of the contribution asset and the First–Fourth and Sixth National Pension Funds. The contribution asset is the value of the system’s inflow of contributions. In 2005 the contri-bution asset grew by SEK 114 billion, or 2.0 percent. The change in the value of the contribution asset is determined primarily by the number of persons gainfully employed, growth in per-capita income, and the turnover duration of the system. An increase in the contribution inflow added SEK 163 billion to the contribution asset, whereas lower turnover duration reduced it by SEK 49 billion. Despite longer pay-out duration (0.1 year), total turnover duration has been shortened by a considerable decrease (0.4 year) in average pay-in duration. To express it in another way, the expected average pay-in age has risen from 43 to 43.4, but the expected average pay-out age only from 75.4 to 75.5. Turnover duration has thereby been shortened from about 32.4 to 32.1 years. The change occurred between 2002 and 2004, but owing to the time lag and the use of the median value for the latest three years, the effects of the change appear for the first time in the accounts for 2005.
The buffer fund, i.e. the First–Fourth and Sixth National Pension Funds, grew by a total of SEK 123 billion, or 19 percent. Of this increase, the return on the buffer fund accounted for more than SEK 114 billion, equivalent to a capital-weighted return of 17.4 percent. Pension contributions exceeded pen-sion disbursements, contributing more than SEK 8 billion to the fund after the deduction for administrative costs. Thanks to the favorable performance of the funds, their share of system assets has increased to nearly 12 percent.
The total assets of the system increased by SEK 237 bil-lion, or 3.8 percent. The increase on the liability side of the balance sheet was 3.5 percent, equivalent to SEK 217 bil-lion. The pension liability has been affected by indexation of 2.6 percent, or SEK 162 billion. Average pay-out period has increased by some 45 days, adding SEK 37 billion to the liability. The remainder of the increase is due to the excess of new pension credit, including certain adjustments, over pension disbursements for the year.
The year’s result of SEK 20 billion increased the surplus of the system to SEK 28 billion. In relation to the pension liability, the surplus is 0.44 percent. The balance ratio of the Key Numbers for the Inkomstpension 2005–2001*
Billions of SEK
2005 2004 2003 2002 2001
First–Fourth + Sixth
National Pension Funds 769 646 577 488 565
Contribution asset 5 721 5 607 5 465 5 301 5 046
Total assets 6 490 6 253 6 042 5 789 5 611
Pension liability 6 461 6 244 5 984 5 729 5 432
Accumulated surplus 28 9 58 60 179
Accounting for the Result of the Pension System in 2005
The Premium Pension
The premium pension system is a fund-based system where pension sav-ers select the funds in which their premium pension moneys are invested. Changes in prices of fund shares affect the value of the pension saver’s hold-ing of system assets directly and by the same amount. For this reason, the result of the premium pension system will in principle always be SEK 0. The premium pension system also includes conventional insurance, the result of which is separately presented as a portion of equity capital.
During the year, funded premium pension assets increased by SEK 68 billion, of which SEK 23 billion consisted of new pension credit and SEK 45 billion of an increase in value. The value of the fund holdings of pen-sion savers as of December 31, 2005, was SEK 193 billion, and the increase in value during the year was more than 30 percent. The average annual rate of return since the first payments into the premium pension system in 1995 has been 5.1 percent. The value of the assets in the conventional-insurance portion of the system was SEK 307 million. The average rebate in 2005 was 5.2 percent.
During the build-up phase and until 2018, the PPM will be financed through a combination of fee withdrawal and borrowing on an interest-bearing account to meet working capital needs, as well as borrowing within authorized limits at the National Debt Office. The total result for the year was SEK 57 million. Aside from the result of SEK 85 million for fund operations, the total result is accounted for by SEK 9 million for conventional insurance operations, SEK 20 million for trade in fund shares via the trade inventory, and SEK –57 million for the net cost of interest. The technical result of insurance operations, i.e. the result for fund operations and conventional insurance, is required to be positive, one reason being to cover costs of interest. However, the outcome for 2005 exceeded estimates because of the higher market value of assets, which meant a higher fee withdrawal and lower costs than had been expected.
Key Numbers for the Premium Pension 2005–2001
Millions of SEK
2005 2004 2003 2002 2001
Fund insurance* 192 770 125 024 94 124 59 416 65 129
Conventional insurance* 307 94 31 4 1
Total pension assets 193 077 125 118 94 155 59 420 65 130 Fund-insurance commitments* 192 770 125 026 94 127 59 418 65 130
Provision for life insurance* 307 94 30 4 1
Total pension liability 193 077 125 120 94 157 59 422 65 131 * Including inheritance gains arising.
Terms Relating to the Inkomstpension – Counterparts in Other Forms of Insurance
What is termed the ”contribution asset” in the accounts refers to the value of the inflow of contributions. There is no equiva-lent concept in funded insurance. But if an analogy is to be made, the contribution asset would most closely correspond to the investment asset, or insurance capital, in funded insur-ance. By this analogy, the change in the value of the contri-bution asset would best correspond to what is called “return on capital” in funded insurance. The value of the contribution asset changes partly through changes in contribution revenue and partly through changes in turnover duration. The respective effects of these two determinants on the value of the
contribu-Other concepts used in the income statement and balance sheet for the inkomstpension have more direct counterparts in conventional accounting for life-insurance businesses. Pension contributions are the equivalent of premium revenue in funded insurance; pension disbursements correspond to insurance benefits paid; the change in pension liability, to changes in ac-tuarial provisions; accumulated surplus/deficit, to accumulated profit/loss.
Income Statement and Balance Sheet
Inkomstpension,
Income Statement and Balance Sheet
Income Statement, millions of SEK
Change in fund assets Note 2005 2004 Change
Pension contributions 1 179 552 171 600 7 952
Pension disbursements 2 –169 127 –164 762 –4 365
Return on funded capital 3 114 598 65 162 49 436
Administrative costs 4 –2 032 –2 736 704
Total change in fund assets (a) 122 991 69 264 53 727
Change in contribution asset
Value of change in contribution revenue 5 163 453 141 518 21 935
Value of change in turnover duration 6 –49 367 0 –49 367
Total change in contribution asset (b) 114 086 141 518 –27 432
Change in pension liability*
New pension credit and ATP points 7 –189 556 –244 879 55 323
Pension disbursements 2 169 071 162 783 6 288
Indexation 8 –161 809 –161 616 –193
Value of change in life expectancy 9 –36 519 –17 614 –18 905
Inheritance gains arising 10 8 854 7 789 1 065
Inheritance gains distributed 10 –9 246 –8 222 –1 024
Deduction for administrative costs 11 1 738 1 949 –211
Total change in pension liability (c) –217 467 –259 810 42 343
Net income/-loss (a)+(b)+(c) 19 610 –49 028 68 638
* A negative item (–) increases the pension liability, and a positive item ( ) decreases it, by the amount shown.
Balance Sheet, millions of SEK
Assets Note 12/31 2005 12/31 2004 Change
First–Fourth and Sixth
National Pension Funds 12 769 190 646 200 122 991
Contribution asset 13 5 720 678 5 606 592 114 086
Total assets 6 489 868 6 252 792 237 077
Liabilities and Surplus
Accumulated surplus/-deficit 8 783 57 812 –49 028
Net income/-loss for the year 19 610 –49 028 68 638
Total surplus 28 392 8 783 19 610
Pension liability 14 6 461 476 6 244 009 217 467
Total liabilities and surplus 6 489 868 6 252 792 237 077
SEK 100 billion (a) (b) (c) (a)+(b)+(c) SEK 1000 billion Total assets First–Fourth and Sixth National Pension Funds
Contribution assets
Accumulated surplus/-deficit Net income/-loss for the year Total surplus
Income Statement and Balance Sheet
Premium Pension,
Income Statement and Balance Sheet
Income Statement, millions of SEK
Change in fund assets Note 2005 2004 Change
Pension contributions 1 23 624 22 355 1 269
Pension disbursements 15 –105 –42 –63
Return on funded capital 16 44 785 8 983 35 802
Administrative costs 17 –287 –285 –2
Total change in fund assets (a) 68 017 31 011 37 006
Change in pension liability*
New pension credit 18 –23 624 –22 355 –1 269
Pension disbursements 19 105 42 63
Change in value 20 –44 776 –8 981 –35 795
Inheritance gains arising 21 296 259 37
Inheritance gains distributed 22 –296 –259 –37
Deduction for administrative costs 23 335 331 4
Total change in pension liability (c) –67 960 –30 963 –36 997
Net income (a)+(c) 57 48 9
* A negative item (–) increases the pension liability, and a positive item ( ) decreases it, by the amount shown.
Balance Sheet, millions of SEK
Assets Note 12/31 2005 12/31 2004 Change
Insurance assets 24 193 077 125 118 67 959
Other assets 25 47 410 45 378 2 032
Total assets 240 487 170 496 69 991
Liabilities and Surplus
Accumulated surplus/-deficit –1 679 –1 727 48
Net income for the year 57 48 9
Total surplus/-deficit –1 622 –1 679 57
Pension liability 26 193 077 125 120 67 957
Other liabilities 27 49 032 47 055 1 977
Total liabilities 242 109 172 175 69 934
170 496
Total liabilities and surplus 240 487 170 496 69 991
SEK 1000 billion Total assets Total liabilities and surplus SEK 100 billion (a) (c) (a)+(c) H C E K I J L G
Income Statement and Balance Sheet
Earnings Related Old Age Pension,
Income Statement and Balance Sheet
Inkomstpension and Premium PensionIncome Statement, millions of SEK
Change in fund assets Note 2005 2004 Change
Pension contributions 1 203 176 193 955 9 221
Pension disbursements 2, 15 –169 232 –164 804 –4 428
Return on funded capital 3, 16 159 383 74 145 85 238
Administrative costs 4, 17 –2 319 –3 021 702
Total change in assets (a) 191 008 100 275 90 733
Change in contribution asset
Value of change in contribution revenue 5 163 453 141 518 21 935
Value of change in turnover duration 6 –49 367 0 –49 367
Total change in contribution asset (b) 114 086 141 518 –27 432
Change in pension liability*
New pension credit and ATP points 7, 18 –213 180 –267 234 54 054
Pension disbursements 2, 19 169 176 162 825 6 351
Indexation/change in value 8, 20 –206 585 –170 597 –35 987
Value of change in life expectancy 9 –36 519 –17 614 –18 905
Inheritance gains arising 10, 21 9 150 8 048 1 102
Inheritance gains distributed 10, 22 –9 542 –8 481 –1 061
Deduction for administrative costs 11, 23 2 073 2 280 –207
Total change in pension liability (c) –285 427 –290 773 5 346
Net income/-loss (a)+(b)+(c) 19 667 –48 980 68 647
* A negative item (–) increases the pension liability, and a positive item ( ) decreases it, by the amount shown.
Balance Sheet, millions of SEK
Assets Note 12/31 2005 12/31 2004 Change
First–Fourth and Sixth
National Pension Funds 12 769 190 646 200 122 991
Insurance assets 24 193 077 125 118 67 959
Other assets 25 47 410 45 378 2 032
Contribution asset 13 5 720 678 5 606 592 114 086
Total assets 6 730 355 6 423 288 307 067
Liabilities and Surplus
Accumulated surplus/-deficit 7 104 56 085 –48 981
Net income/loss for the year 19 667 –48 980 68 647
Total surplus/-deficit 26 770 7 104 19 666
Pension liability 14, 26 6 654 553 6 369 129 285 424
Other liabilities 27 49 032 47 055 1 977
307067
Notes and Comments
Notes and Comments
Notes 2–14 relate to the inkomstpension, Notes 15–27 to the premium pen-sion. Note 1 applies to both parts of the earnings-related old-age pension system. All amounts in Notes 1–14 are shown in millions of SEK, and amounts in Notes 15–27, in thousands of SEK.
Note 1 Pension Contributions
Contributions to the old-age pension system
Millions of SEK
Contributions to: Inkomst- Premium 2005 2004
pension pension Total Total
Employer contrib. below income ceiling 74 450 19 635 94 085 91 318 Self-employment contributions
below income ceiling 2 255 595 2 850 2 549
Individual pension contributions 74 762 – 74 762 72 287
Central govt. old-age pension contribution 26 450 3 641 30 091 27 464
Final settlements etc. 1 635 –247 1 388 337 *
Total 179 552 23 624 203 176 193 955
* Total of final settlement in 2004 for 2002, loss in collection, settlement and discrepancies between the accounting of the RFV (the former National Social Insurance Board), and of the National Pension Funds and the PPM, respectively, and adjustment.
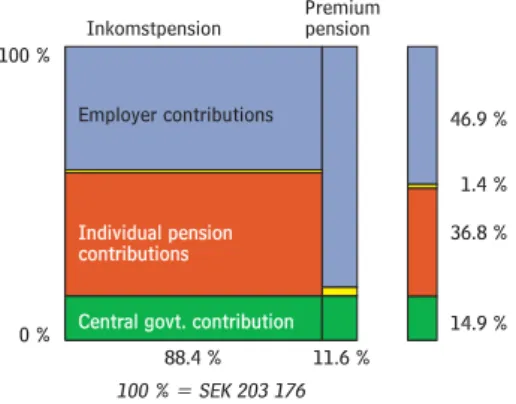
As can be seen in the table above, there are several different types of contribu-tions in the old-age pension system. Moreover, not all contribution revenue goes to the pension system; contributions for incomes above the so-called income ceiling of 8.07 income-related base amounts are transferred to the central government budget. These contributions, which are actually taxes, are not included in the table. Contributions to the old-age pension are paid by employers and self-employed persons, individual pension contributions by all economically active recipients of pension credit. In addition, central government old-age pension contributions are paid through various appro-priations in the central government budget, such as those for sickness and unemployment cash benefits. The central government also pays a pension contribution for so-called pension-qualifying amounts, such as pension credit for child-care years. The following section provides a more detailed account-ing for pension contributions.
Inkomstpension Premium pension 46.9 % 36.8 % 14.9 % 88.4 % 11.6 % 1.4 %
In the diagram final settlements etc. have been allocated between employer contributions and the central government old-age pension contribution.
Employer contributions
Individual pension Individual pension contributions contributions
Central govt. contribution Central govt. contribution
100 % = SEK 203 176
0 % 100 %
Detailed Accounting for Pension Contributions
Table A Pension Contributions by Type of Contribution
Millions of SEK
Contributions paid to: Inkomst- Premium Cent. govt. Total of which contrib. pension pension budget (tax) to pension system
Employer contributions 74 450 19 635 11 985 106 070 94 085
Self-employment contributions 2 255 595 364 3 214 2 850
Individual pension contributions 74 762 – – 74 762 74 762
Central govt. old-age pension contribution 26 450 3 641 – 30 091 30 091
Final settlement in 2005 for 2003 1 063 –66 –997 0 997
Loss in collection,settlement –312 – – –312 –312
Discrepancy between accounting of Swedish Social Insurance Agency and
of National Pension Funds and PPM 884 –181 – 703 703
Notes and Comments
Table A shows pension contributions recorded in 2005. Some contributions are for previous years. Employer contributions, for example, are reported at least one month after the month when the related earnings are paid. Individual pension contributions are allocated entirely to the National Pension Funds. For employer contributions and self-employment pension contributions, there is a preliminary allocation by set percentages among the National Pension Funds, the premium pension system, and the central government budget. The central government old-age pension contribution is allocated between the National Pension Funds and the premium pension system.
The portion of the old-age pension contribution allocated to the central government budget is for portions of income that exceed the ceiling for pension-qualifying income. This ceiling is 8.07 income-related base amounts1 before deduction of the individual pension contribution and 7.5 after this deduction. Since these contributions do not represent pension credit, they are to be considered taxes.
To ensure that the premium pension system for a particular year has re-ceived contributions corresponding to the pension credit earned and that the central government budget has received contributions for the portion of incomes above the ceiling, the discrepancies are reconciled two years later. Thereafter, a settlement is made among the central government budget, the premium pension system, and the National Pension Funds.
The discrepancy between the accounting of the Swedish Social Insurance Agency and that of the National Pension Funds (SEK 884 million) is due primarily to differences in regard to periodization. The discrepancy between the accounting of the Swedish Social Insurance Agency and that of the PPM (SEK –181 million) is due largely to the fact that the PPM accounts report contribution revenue for pension credit confirmed in 2004 and transferred to the premium pension funds in 2005, whereas the Swedish Social Insurance Agency accounts report contribution revenue received in 2005. Contribu-tions received in 2005 are for pension credit to be confirmed at the end of 2006 and invested early in 2007.
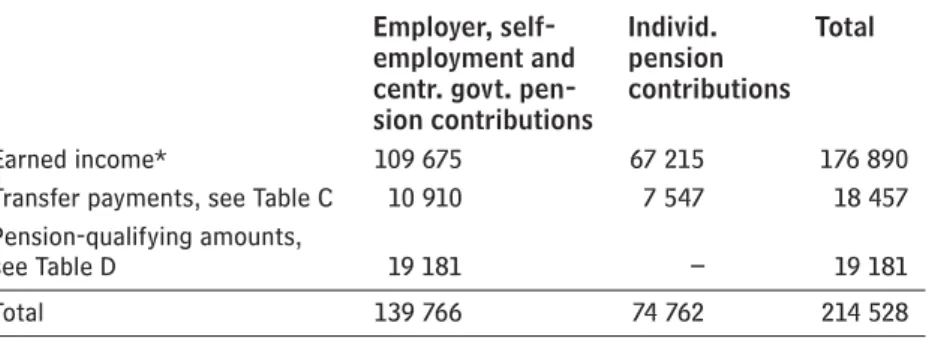
Table B Pension Contributions by Type of Contribution Base
Millions of SEK
Millions of SEK
Employer, self- Individ. Total
employment and pension
centr. govt. pen- contributions
sion contributions
Earned income* 109 675 67 215 176 890
Transfer payments, see Table C 10 910 7 547 18 457
Pension-qualifying amounts,
see Table D 19 181 – 19 181
Total 139 766 74 762 214 528
The allocation of individual pension contributions among the different types of contribution base is estimated and is not shown in the accounting systems.
* Earned income, incl. sick-pay and self-employment income, excl. transfer payments.
The individual pension contribution is 7 percent of the sum of earned in-come and pension-qualifying transfer payments such as sickness cash benefits, but not including sickness and activity compensation. The individual pension contribution is assessed only on the portion of such income below the ceiling of 8.07 income-related base amounts.
The pension contribution paid by employers and self-employed persons on earned income, and by the central government on the above-mentioned transfer payments, is 10.21 percent. The central-government pension
contri-82.5 %
8.6 % 8.9 %
65.2 % 34.8 %
Employer, selfemploy-ment and centr. govt. pension contribution Individual contribution Earned income Transfer payments Transfer payments P-Q amounts P-Q amounts 100 % = SEK 214 528 0 % 100 %
1 The income-related base
amount for 2005 is SEK 43 300. Thus, 8.07 income-related base amounts equal SEK 349 431, and 7.5 income-related base amounts equal SEK 324 750.
Notes and Comments
Table C Pension Contributions for Transfer Payments
Millions of SEK
Central govt. Individual Total
pension pension
contributions contributions
Sickness cash benefits 3 388 2 343 5 731
Rehabilitation benefits 343 237 580
Benefits to immediate relatives 7 5 12
Compensation for work-related
injuries, etc. 390 269 659
Partial pension –4 0 –4
Parental insurance 2 250 1 556 3 806
Care allowances 222 153 375
Unemployment cash benefits,
etc. (Labor Market Board – AMS) 4 282 2 961 7 243
Educational allowances 27 19 46
Artists’ Board 4 3 7
Allowances to disease carriers 1 1 2
Total 10 910 7 547 18 457
The allocation of individual pension contributions among the different types of transfer payments is estimated and is not shown in the accounting systems.
Table D Pension Contributions for Sickness/Activity Compensation and Pension Qualifying Amounts
Millions of SEK
Sickness and activity compensation 12 840
Amounts credited for child-care years 4 319
Amounts credited for study 1 850
Amounts credited for compulsory national service 172
Total 19 181
Sickness and activity compensation consist of both pension-qualifying benefits paid and pension-qualifying amounts. The amount shown for sickness and activity compensation refers to both pension-qualifying benefits disbursed and pension-qualifying amounts. In each case the contribution is 18.5 percent.
A minor portion of amounts credited for study and for compulsory national service consists of pension-qualifying income.
Note 2 Pension Disbursements
Millions of SEK2005 2004
ATP 162 563 159 217
Inkomstpension 6 507 3 566
Total pension disbursements 169 071 162 783
Transfers to the European Communities 57 379
Special adjustment – 1 600 2
Total 169 127 164 762
In 2005 a total of SEK 169 071 million in pensions was disbursed from the National Pension Funds, reducing the pension liability to retired persons by the same amount.
By law (2002:125), the value of the pension credit for officials of the Euro-pean Communities may be transferred from the National Pension Funds and the premium pension system to the service pension systems of the European Communities. In 2005 a total of almost SEK 57 million was thus transferred from the National Pension Funds, reducing the pension liability to the eco-nomically active by this amount. In total, the National Pension Funds were charged with SEK 169 127 million as a result of pension disbursements or
39.2 % 31.0 % 20.6 % 59.1 % 40.9 % Central govt. pension contribution Individual pension contribution
Sickness cash benefits
Unemployment cash benefits etc.
Parental insurance Parental insurance
Partial pensions are not included in the diagram. 100 % = SEK 18 461 0 % 100 % 66.9 % 22.5 % 9.6 % 0 %
Sickness and activity compensation Child-care years Study Study 100 % = SEK 19 181 100 %
2 In 2004, the National Pension Funds were charged
with SEK 1 600 million as a special adjustment for the period 1999–2002. During this period, pension disbursements were divided between the National Pension Funds and the central government budget in certain standard proportions because of shortcomings in the accounting system of the National Social Insurance Board (RFV). A review has shown that the National Pension Funds were charged too little during this period.
Notes and Comments
”Other items” consist primarily of derivatives. Capital gains/losses on stocks and shares have been charged with brokerage commissions on both purchases and sales.
Note 4 Costs of Administration
Millions of SEK2005 2004
National Social Insurance Board (RFV) – * 557
Swedish Social Insurance Agency 895 347
Tax administration (incl. Enforcement Service) 279 344
National Institute of Economic Research 0 0
Total costs of insurance administration 1 174 1 248
First National Pension Fund 145 244
Second National Pension Fund 123 330
Third National Pension Fund 127 314
Fourth National Pension Fund 133 246
Sixth National Pension Fund 326 340
First and Fourth National Pension Funds,
special administration 4 14
Total costs, fund administration 858 1 488
Total 2 032 2 736
* Included in costs of administration for the Swedish Social Insurance Agency as from 2005.
As from 2005, the First–Fourth National Pension Funds have changed their accounting for costs of administration. From that point on, only internal costs are reported as administrative costs. External costs of administration and custodial fees are referred to as costs of commissions and are reported as negative revenue (see Note 3). In addition, costs of commissions are divided into fixed fees and performance-based fees. The latter are reported net in the result rather than in “costs of commissions” in the income statement. The change means that the costs of fund administration for this year are not
44.0 % 13.7 % 16.0 % 7.1 % 6.5 % 6.2 % 6.1 % Swedish Social Insurance
Agency Tax administration Sixth National Pension Fund First National Pension Fund Fourth National Pension Fund Third National Pension Fund Second National Pension Fund
100 % = SEK 2 032
0 % 100 %
Note 3 Return on Funded Capital
Millions of SEK2005 2004 National Pension Fund: First Second Third Fourth Sixth * Total Total
Stocks and shares 18 541 26 366 23 137 20 464 1 432 588 90 528 51 473
of which: direct return 2 705 2 696 2 730 2 131 125 113 10 500 8 007 realized & unrealized
capital gains 15 836 23 670 20 407 18 333 1 307 475 80 028 43 466
Bonds and other
interest-bearing securities 3 084 3 018 3 007 2 538 135 197 11 979 16 526
of which: direct return
(net interest) 2 461 2 486 2 988 2 358 135 197 10 625 10 038 realized & unrealized
capital gains 623 532 19 180 0 0 1 354 6 488
Other items 6 221 467 2 923 2 977 0 24 12 612 –2 837
of which: direct return 365 –790 –462 –1 095 0 23 –1 959 1 192 realized & unrealized
capital gains 2 942 –565 744 351 0 –1 3 471 2 880 net foreign-exchange
gain/-loss 2 914 1 822 2 641 3 721 0 2 11 100 –6 909
Costs of commissions –120 –160 –149 –87 0 –5 –521 – **
Total 27 726 29 691 28 918 25 892 1 567 804 114 598 65 162
* Special administration of the First and Fourth National Pension Funds. ** Data unavailable. For further information, see Note 4.
Notes and Comments
Because of phase-in provisions applicable until 2020, only a portion of administrative costs (68 percent for 2005; see Note 11) are charged to the pen-sion balances of the insured. The remainder of these costs is to be financed by the First–Fourth National Pension Funds, in equal amounts from each fund. In addition, each fund finances its own administrative costs by withdrawals from itself.
Note 5 Value of Change in Contribution Revenue
Turnover duration in years, contribution revenue in millions of SEKSmoothed contribution revenue 2005 178 116
Smoothed contribution revenue 2004 –173 049
Change in smoothed contribution revenue 5 067
(Smoothed turnover duration 2005
+ smoothed turnover duration 2004)/2 * x 32.25829
Value of change in contribution revenue 163 453
* (32.11771+32.39887)/2=32.25829
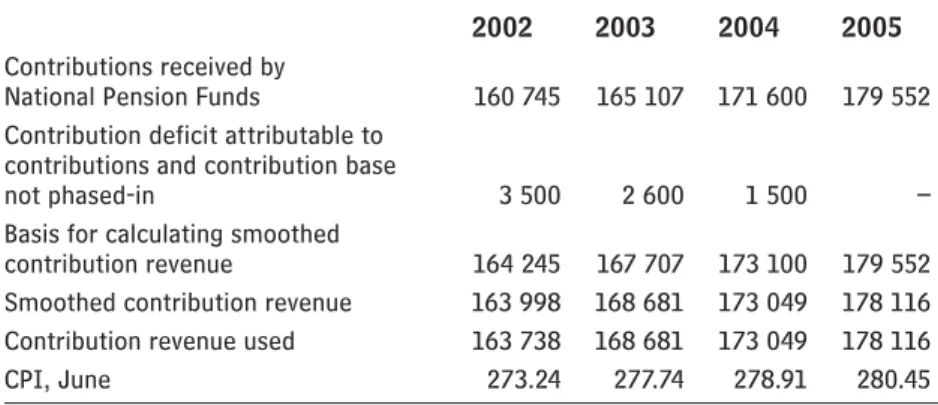
Table A Basis for Calculating Smoothed Value of Contribution Revenue
Millions of SEK
2002 2003 2004 2005
Contributions received by
National Pension Funds 160 745 165 107 171 600 179 552
Contribution deficit attributable to contributions and contribution base
not phased-in 3 500 2 600 1 500 –
Basis for calculating smoothed
contribution revenue 164 245 167 707 173 100 179 552
Smoothed contribution revenue 163 998 168 681 173 049 178 116
Contribution revenue used 163 738 168 681 173 049 178 116
CPI, June 273.24 277.74 278.91 280.45
During a phase-in period extending through fiscal year 2004, adjustments were made so that the contribution used in calculating the contribution asset would reflect the contribution inflow when the system is fully functioning. The method of calculating smoothed contribution revenue is described in Appendix B, Section 1.
Note 6 Value of Change in Turnover Duration
Turnover duration for the year, contribution revenue in millions of SEKSmoothed turnover duration 2005 32.11771
Smoothed turnover duration 2004 –32.39887
Change in smoothed turnover duration –0.28116
(Smoothed contribution revenue 2005
+ smoothed contribution revenue 2004)/2 * x 175 582
Value of change in turnover duration –49 367
* (178 116+173 049)/2=175 582
Table A Basis for Calculating Smoothed Value of Turnover Duration
2002 2003 2004 2005
Pay-in duration 21.96768 22.09653 21.54817 21.46187
Pay-out duration 10.43119 10.43638 10.56954 10.58625
Turnover duration, TD 32.39887 32.53291 32.11771 32.04812
Notes and Comments
Smoothed turnover duration is the median of the turnover duration for the latest three years. The method of calculating turnover duration is described in Appendix B, Section 3.
Since pay-in duration cannot be calculated until all pension credit has been confirmed, the estimates for 2005 are based on the value of pension credit earned in 2004 (and confirmed in 2005). Pay-out duration is calculated from the data as of December 2005.
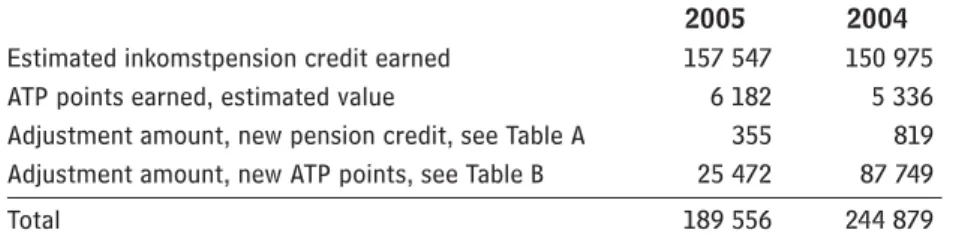
Note 7 New Pension Credit and ATP Points
Millions of SEK2005 2004
Estimated inkomstpension credit earned 157 547 150 975
ATP points earned, estimated value 6 182 5 336
Adjustment amount, new pension credit, see Table A 355 819
Adjustment amount, new ATP points, see Table B 25 472 87 749
Total 189 556 244 879
The items of new pension credit and ATP points have been adjusted upward by certain other amounts that have affected the size of the pension liability. These adjustment amounts are explained in the tables below.
Table A Adjustment Amount, New Pension Credit
Millions of SEK
Confirmed inkomstpension credit earned in 2004 150 482
Estimated inkomstpension credit earned in 2004 –150 975
Adjustments affecting pension balances, etc. –1 118
Change in disbursements 1 966
Adjustment amount A 355
Since the tax assessment for the year of the financial statements has not been completed when the statements are prepared, the amount of pension credit earned during the year can only be estimated. In the Annual Report of the pension system for 2004, the pension credit earned during the year was es-timated at SEK 150 975 million. After the tax assessment for 2004 had been finalized, the actual value proved to be 150 482 million.
The adjustment amount of SEK –1 118 million represents primarily tax-assessment changes and other adjustments affecting the size of pension bal-ances; see Note 14, Table A. The pension liability to retirees has been adjusted by SEK 1 966 million because of changes in pension amounts due to factors other than indexation (see Note 14, Table C).
Table B Adjustment Amount, New ATP Points
Millions of SEK
Effect of difference between assumed value for 2005
and estimate for 2004, etc. 4 472
Paid-in pension contributions for ATP excl. value of ATP points 13 103
Change in amounts disbursed 7 896
Adjustment amount B 25 472 *
* Adjusted by SEK 1 million in rounding off.
The ATP liability to the economically active – that is, to persons who have not yet begun drawing a pension – is estimated in the pension model of the Swedish Social Insurance Agency. The procedure is described in Note 14.
Notes and Comments
The ATP liability to retirees has been adjusted by SEK 7 896 million be-cause of changes in pension amounts due to factors beside indexation (see Note 14, Table C).
Of the ATP points earned in 2005, only a minor portion will have any impact on future pensions. The portion expected to contribute to higher pensions has been reported as the value of ATP points earned (SEK 6 182 million). However, all pension contributions for the ATP contribute to an increase in the estimated pension liability. The last year for which ATP points may be earned is 2017. This means that pension contributions, except for ad-ministrative discrepancies, will not equal pension credit earned until 2018.3
Note 8 Indexation
Millions of SEK2005 2004
Pension liability, economically active 121 804 104 347
Pension liability, retirees 40 005 57 269
Total 161 809 161 616
The pension liability grows by the increase in the income index.4 The amount of indexation refers to the indexation affecting the pension liability as of December 31, 2005. The ATP liability to the economically active has been affected by the change in the income index between 2005 and 2006 (2.7 percent). The pension liability to retirees as of December 31, 2005, has been affected by the indexation at the end of the previous year, i.e. December 31, 2004 (2.4 percent).
Note 9 Value of the Change in Life Expectancy
Millions of SEK2005 2004
ATP liability, economically active 11 861 6 434
Inkomstpension liability, economically active – –
ATP liability, retirees 23 442 10 819
Inkomstpension liability, retirees 1 216 361
Total 36 519 17 614
As used here, the term ”life expectancy” refers to the expected payout period of an average pension, or so-called economic life expectancy, adjusted for the norm of 1.6 percent. Economic life expectancy is expressed as an eco-nomic annuity divisor. The method of calculating ecoeco-nomic annuity divisors is shown in Appendix B, Section 4.
A higher economic life expectancy will increase the liability for the ATP, both to the economically active and to retirees. In the inkomstpension system, only the liability to retirees will increase if life expectancy goes up.
The effect of changes in economic life expectancy is calculated by first determining the pension liability with the economic annuity divisors used in the system for the year covered by the financial statements. This liability is then reduced by the pension liability calculated with the economic annuity divisors for the preceding year. The increase in the economic annuity divisor between 2004 and 2005 corresponds to an increase of 45 days of the expected pay-out period.
3 In 2005, contributions for the ATP amounted to
SEK 19.3 billion, whereas the value of new ATP points that same year was only SEK 6.2 billion. Thus, contributions paid exceeded the value of ATP points earned by SEK 13.1 billion. The reason for this difference is that in the ATP system pension credit often accumulates relatively early in working life. An individual aged 55, who is already past her/his 15 years of maximum earnings (and has worked for at least 30 years), cannot increase her/ his ATP pension at all, despite continuing to work and to pay contributions until age 65. The situation illustrates one of the ATP system’s negative incentives for older members of the labor force to continue contributing to the labor supply.
4 For individuals born no later than 1953 and
drawing an ATP pension before age 65, the pension liability is indexed by the change in the price-related base amount until they turn 65.
Notes and Comments
Note 10 Inheritance Gains, Arising and Distributed
Millions of SEKYear of Year of Inheritance Inheritance birth death gains arising gains distributed
1938–1945 2005 2 898 3 537
1945– 2004 5 956 5 710
Total 8 854 9 246 *
* Adjusted by SEK 1 million in rounding off.
The pension balances of deceased persons (inheritance gains arising) are distrib-uted to the survivors of the same age. By means of an inheritance gain factor, the distribution is made as a percentage increase in pension balances.
Until the year when a birth cohort reaches age 60, the inheritance gains distributed are those actually arising. The inheritance gain factor is thus de-termined by the total pension balances of decedent persons of the same age. The inheritance gains from persons dying in 2004 before reaching age 60 (SEK 5 956 million) were distributed to the respective birth cohorts in 2005. The inheritance gains distributed were SEK 5 710 million; the difference is ex-plainable by the annual adjustment of pension balances for changes in tax assessments, among other reasons.
Beginning with the year when a birth cohort reaches age 60, the inheritance gains distributed are not those actually arising, but those expected to arise. Inheritance gain factors are estimated on the basis of the mortality observed by Statistics Sweden, the Swedish Central Office of Statistics, for an earlier period. Since this mortality will not be exactly the same as actual mortality in the year concerned, and since mortality may also vary with the income levels of the persons insured, there is a discrepancy between inheritance gains arising and gains distributed for ages 60 and above (SEK 2 898 million and 3 537 million in 2005).
Note 11 Deduction for Costs of Administration
Costs of administration, also referred to as administrative costs, are financed by a percentage deduction from the pension balances of the insured. In order to avoid charging a disproportionately high cost to younger birth cohorts during the period when the ATP is being phased out, this administrative-cost deduction is being introduced step by step. In 2005, 68 percent of administra-tive costs were financed by deduction from pension balances. This deduction will increase by two percentage points each year and thus will not cover 100 percent of administrative costs until 2021.
The calculation of the administrative-cost factor is based on budgeted costs of administration, including the costs of the National Pension Funds, for the year concerned and an estimate of the pension balances among which the cost is to be allocated. The difference between the monetary value of the deduction made and the cost subsequently confirmed is considered in the calculation of the administrative-cost factor for the following year.
The administrative-cost deduction is calculated as pension balances multi-plied by the administrative-cost factor. The deduction for administrative costs totals SEK 1 738 million and is reported in Note 14, Table A.
Notes and Comments
Note 13 Contribution Asset
Contribution revenue in millions of SEK, turnover duration in years
2005 2004
Smoothed contribution revenue 178 116 173 049
Smoothed turnover duration x 32.11771 x 32.39887
Contribution asset 5 720 678 5 606 592
See Notes 5–6 and Appendix B for the values and formulas used in calculat-ing contribution revenue and turnover duration.
Note 14 Pension Liability
Millions of SEK2005 2004
Economically Retired Total Total
Active
ATP 1 042 121 1 728 147 2 770 268 2 797 010
Inkomstpension 3 570 838 120 370 3 691 208 3 446 999
Total 4 612 959 1 848 517 6 461 476 6 244 009
The pension liability to retirees is calculated in the same manner for the ATP and the inkomstpension. The first step is to total the pension disbursements to each birth cohort in December and to multiply this total by 12 to obtain a theoretical annual amount. The annual amount is thereafter multiplied by the economic life expectancy for each birth cohort, resulting in the pen-sion liability to that cohort, with economic life expectancy expressed as an economic annuity divisor. The pension liabilities to all birth cohorts are then summed up.
The inkomstpension liability to the economically active consists of the total pension balances of all insured persons in this category as of December 31, 2005, with the addition of the estimated pension credit earned for 2005. The method of calculating the pension liability to the economically active and the economic annuity divisor is shown in Appendix B, Section 4.
The ATP liability to the economically active cannot be calculated directly from the data in the records of pension credit earned. That liability is estimat-ed in the Swestimat-edish Social Insurance Agency pension model. The calculation is made for the birth cohorts whose pensions will be calculated partly by ATP rules (those born no later than 1953) and who have not reached age 65.
24.5 % 24.6 % 24.8 % 23.6 %
20.4 %
40.4 %
19.5 % 2.4 % First Second Third Fourth Sixth
The diagram shows the assets of the National Pension Funds. 17.3 % Swedish stocks Foreign stocks Foreign stocks Foreign bonds Foreign bonds Swedish bonds 100 % = SEK 780 020 0 % 100 %
Economically Active Retired
100 % = SEK 6 461 476 ATP ATP Inkomstpension Inkomstpension 57.1 % 42.9 % 71.4 % 28.6 % 0 % 100 %
Note 12 First–Fourth and Sixth National Pension Funds
Millions of SEK
2005 2004 National Pension Fund: First Second Third Fourth Sixth * Total Total
Stocks and shares** 112 092 124 603 108 769 114 536 13 803 438 474 241 375 629
of which: Swedish stocks and shares 25 001 46 973 32 529 40 317 13 803 438 159 061 129 551 foreign stocks and shares 87 091 77 630 76 240 74 219 0 0 315 180 246 078
Bonds and other
interest-bearing assets 75 544 62 230 78 811 64 611 2 055 3 422 286 673 249 230
of which: Swedish issuers 32 179 37 345 30 270 29 612 2 055 3 422 134 883 127 313 foreign issuers 43 365 24 885 48 541 34 999 0 0 151 790 121 917
Other items 3 385 5 046 5 732 4 586 56 301 19 106 30 118
Total assets 191 021 191 879 193 312 183 733 15 914 4 161 780 020 654 977
Liabilities –3 758 –1 286 –1 362 –3 635 –788 –1 –10 830 –8 777
Total fund capital 187 263 190 593 191 950 180 098 15 126 4 160 769 190 646 200 * Special administration of the First and Fourth National Pension Funds.
Notes and Comments
In order to determine the ATP liability, an estimate is made of the ATP of the respective birth cohorts in the year when they reach 65. The estimated annual amount for each cohort is multiplied by the economic annuity divisor for that cohort. To obtain the present value of the estimated pension liability, the liability is reduced by the cohort’s expected future contributions to the system and discounted by the expected future increase in the income index. In the calculation it is assumed that the income index will increase by 2 per-cent annually.
The year 2018 is the final one in the calculation since the cohort born in 1953 will reach age 65 that year.
Table A Analysis of the Change in Inkomstpension Liability to the Economically Active
Millions of SEK
Inkomstpension liability to the economically active, December 31, 2004 3 375 201 of which estimated inkomstpension credit earned in 2004 –150 975
Pension balance, December 31, 2004 3 224 226
Deduction for undistributed Inheritance gains * –5 956
Adjustments affecting pension balances ** –446
Opening pension balance, 2005 3 217 824
Changes in tax assessments etc. affecting pension balances –672
Confirmed inkomstpension credit earned in 2004 150 482
Distributed inheritance gains from persons dying in 2005
and born in 1945 or earlier 3 537
Distributed inheritance gains from persons dying in 2004
and born in 1945 or thereafter 5 710
Indexation 91 285
Deduction for administrative costs –1 738
Reduction in pension liability due to pensions drawn in 2005 –50 469
Pensions revoked 231
Inheritance gains arising from persons dying in 2005
and born in 1945 or earlier –2 898
3
Pension balances as of December 31, 2005 3 413 291
Estimated inkomstpension credit earned in 2005 157 547
Inkomstpension liability to the economically active
as of December 31, 2005 3 570 838
* Inheritance gains from persons born in 1945 and thereafter and dying in 2004; these gains were distributed in 2005.
** Transfers to the European Communities (see Note 2), adjustments for deceased persons, sealed cases, etc.
Table B Analysis of Change in ATP Liability to the Economically Active
Millions of SEK
Millions of SEK
ATP liability, December 31, 2004 1 110 829
Effect of difference between assumption for 2005
and estimate in 2004 etc. 4 472
Opening ATP liability, 2005 1 115 301
Indexation 30 519
Estimated value of ATP points earned in 2005 6 182
Reduction in pension liability due to pensions drawn in 2005 –134 845
Value of other paid-in contributions for the ATP 13 103
Effect of change in average economic life expectancy 11 861
ATP liability to the economically active, December 31, 2005 1 042 121
A C B F E D
Notes and Comments
Table C Analysis of Change in Pension Liability to Retirees, ATP and Inkomstpension
Millions of SEK
ATP Inkomst- Total
pension
Pension liability to retirees,
December 31, 2004 1 686 181 71 798 1 757 979
Additional liability
to the economically active 134 845 50 238 * 185 083
Change in amounts disbursed 7 896 1 966 9 862
Pensions disbursed, net** –162 563 –6 507 –169 070
Indexation 38 346 1 659 40 005
Effect of change in life expectancy 23 442 1 216 24 658
Pension liability to retirees,
December 31, 2005 1 728 147 120 370 1 848 517
* Of which additional liability from the economically active, SEK 50 469 million, and pensions returned, SEK –231 million. See Note 14, Table A.
** Total pension disbursements from the National Pension Funds (see Note 2), with deduction for transfers to the European Communities.
The liability to retirees is increased by indexation and a higher life expectancy, and it is decreased by the disbursements made during the year. The reduction in the pension liability due to pension withdrawals (see Note 14, Tables A and B) is reported here as additional liability to the economically active.
There are also further changes in liability, which are reported as changes in amounts disbursed. Pension amounts can change because of new pension credit earned, changes in the extent of pension withdrawals, revocations, changes in marital status (applies to the ATP), changes in assessment, etc.
Notes and Comments Relating to the Premium Pension
NB: all amounts in Notes 15–27 are expressed in thousands of SEK.
Note 15 Pension Disbursements
Thousands of SEK2005 2004
Pension disbursements from fund insurance 93 761 39 255
Pension disbursements from conventional insurance 9 941 3 190
Subtotal* 103 702 42 445
Transferred to the European Communities 1 355 –
Total 105 057 42 445
* Including pensions granted but not yet disbursed.
Like the inkomstpension, the premium pension can be drawn from the age of 61. One option for a pension saver at the time of retirement is to retain her/his accumulated balance in fund insurance, which means that the amount of the pension will depend on the change in the value of the funds chosen by the saver. The other option is to switch to conventional insurance, either at the time of retirement or later. With conventional insurance, the pension is disbursed as a nominal guaranteed monthly amount. A guaranteed return, presently 2.75 percent, is included in this amount. If PPM management of conventional insurance capital achieves a return higher than the guaranteed rate, a rebate can be granted in the form of a supplement to the pension disbursed. Such supplements, which can vary from year to year, totaled SEK 180 000 in 2005.
Notes and Comments
The return earned includes realized and unrealized foreign-exchange gains and losses. The average fund management charge after rebates is 0.42 percent of average capital.
Note 17 Costs of Administration
Thousands of SEK2005 2004
Operating expenses 250 339 220 114
Return on capital, revenue/expense, net 36 667 65 049
Total 287 006 285 163
Costs of administration, also referred to as administrative costs, include the (net) financial revenue or expense from borrowings to finance the PPM. Costs of fund management are paid directly from insurance assets and thus are not included in PPM costs of administration.
Note 18 New Pension Credit
In the premium pension system, the equivalent of contribution revenue is new pension credit, including interest for the period when contribution moneys are managed by the PPM before being invested in the funds chosen by the insured. The amount also includes positive changes in pension credit earned in previous years and distributed rebates of fund management fees.
Note 19 Pension Disbursements
Pension disbursements reduce the pension liability; see Note 15.
Note 20 Change in Value
The pension liability changes with the return on premium pension funds; see Note 16.
Note 21 Inheritance Gains Arising
Inheritance gains arising are analogous to decedents’ capital. This item also includes amounts by which pension credit is reduced by the transfer of pre-mium pension capital from one spouse to the other. Transferred capital is currently reduced by 14 percent. This percentage is subject to change, but
Note 16 Return on Funded Capital
Thousands of SEK2005 2004
Fund Conventional Total Total
insurance insurance
Stocks and shares 43 870 159 24 389 43 894 548 9 294 051
of which: direct return 1 929 146 8 331 1 937 477 1 429 017 realized and unrealized capital gains 41 941 013 16 058 41 957 071 7 865 034
Bonds and other interest-bearing securities 50 447 –3 590 46 857 6 165
of which: direct return (net interest) 5 080 –293 4 787 4 393 realized and unrealized capital gains 45 367 –3 297 42 070 1 772
Net foreign-exchange gain/-loss 834 234 834 234 –318 907
Subtotal return 44 754 840 20 799 44 775 639 8 981 309
Change, conventional insurance 9 290 9 290 2 089
Notes and Comments
why the premium pension decreases when capital is transferred is the PPM’s assumption that more transfers will be made to women than to men. Since women live longer than men on average, the premium pension transferred will probably be disbursed for a longer period than if it had been retained by the person who had earned it. According to the Earnings Related Old Age Pension Act (1998:674), the cost is to be covered by those receiving the transfer rather than shared by all pension savers. During 2004, a total of 6 987 persons transferred aggregate pension capital of SEK 37 451 000 to spouses or registered partners
Note 22 Inheritance Gains Distributed
Inheritance gains are set aside for pension savers and are distributed once a year.
Note 23 Deduction for Costs of Administration
The amount of SEK 334 683 000 (330 515 000) is for fees withdrawn by the PPM to finance its operating expenses. The fee for 2005 was 0.22 percent of the account balances of pension savers. During the build-up phase and until 2018, the authority will be financed by a combination of fees withdrawn and interest-bearing overdrafts for working capital needs as well as by borrowing within authorized limits from the National Debt Office. The fee withdrawn was based on the cost level forecast for 2005 and entailed a positive result. The authority is permitted to withdraw annual fees equivalent to a maximum of 0.3 percent of the aggregate account balances of pension savers. This is done to avoid charging those currently insured with disproportionately high fees for the build-up of the PPM at a time when their premium pension capital is limited.
Note 24 Insurance Assets
Thousands of SEK2005 2004
Fund insurance 192 769 385 124 024 114
Conventional life insurance, PPM management 307 225 93 893
Total 193 076 610 125 118 007
As of December 31, 2005, the number of pension savers totaled 5 456 306, of whom 5 430 468 had invested their savings in fund insurance and 25 838 in conventional insurance. The number of retired pension savers was 249 747.