R
AISING
T
AXES THROUGH
E
QUALIZATION
M
ICHAEL
S
MART
CES
IFO
W
ORKING
P
APER
N
O
.
1926
C
ATEGORY1:
P
UBLICF
INANCEF
EBRUARY2007
An electronic version of the paper may be downloaded
• from the SSRN website: www.SSRN.com
• from the RePEc website: www.RePEc.org
CESifo
Working Paper No. 1926
R
AISING
T
AXES THROUGH
E
QUALIZATION
Abstract
A simple theory suggests that a common form of federal horizontal equalization grants should
cause subnational governments to levy higher tax rates, distorting local tax bases and so
increasing federal transfers. To test this, I examine Canadian provincial tax policies in the
1972-2002 period. Consistent with the theory, provinces respond to expansions of
equalization transfers by increasing their own tax rates. I estimate that on average tax rates in
grant-receiving provinces were substantially and significantly higher as a consequence of the
transfer formula.
JEL Code: H21.
Michael Smart
Department of Economics
University of Toronto
150 St. George St.
Toronto ON M5S 3G7
Canada
[email protected]
Revised Version: September 13, 2006
Thanks to Pierre Doucet and Michelle Taylor of the federal Department of Finance for access
to and assistance with data, to Peter Egger, Jim Hines, Nicolas Marceau and Wolfram Richter
for comments, and to faculty and staff of Center for Economic Studies Munich, where this
paper was written.
1
Introduction
Most federations employ a system of “horizontal” equalization grants of one kind or another, which seeks to redistribute fiscal resources among subnational governments in the nation. The goal of such transfers is to permit all subnational governments to gain access to similar fiscal resources while imposing similar tax burdens on local residents.1 In the most common such system, known as a capacity equalization or foundation grant, each government receives a transfer equal to the difference between its measured tax base and the average base of all regions, multiplied by some target tax rate. Thus a capacity equalization grant insures that each jurisdiction can achieve some target level of spending determined by federal authorities, as long as it sets its own tax rate at least as high as the target level.
The capacity equalization principle currently forms the basis for transfer systems in Australia, Canada, Germany, and Switzerland, as well as local school district finance formulas in a number of US states (Card and Payne, 2002). An apparent advantage of the approach is that each govern-ment’s transfers are defined as a function of local measured tax bases, but not of local revenues themselves. In contrast, a system of direct revenue sharing often creates a common pool problem among local governments that is apt to reduce tax effort (Baretti et al., 2001).
Nevertheless, Smart (1998) observed that capacity equalization may distort local tax policies as well—but causing local governments to levy higher rather than lower tax rates. The argument is straightforward: increasing distortionary local tax rates causes measured tax bases to decline, as economic activity shifts to other regions of the country or to other, more lightly taxed forms— and so causes capacity equalization transfers to rise. Thus the grants in effect compensate for a portion of the marginal deadweight loss of tax increases. This effect is clearest when considering a receiving province with a tax rate equal to the target tax rate at which capacity deficiencies are compensated: At this point, further increases in the rate will appear to create no deadweight loss to the province, as the increase in equalization transfers exactly compensates for marginal losses in private consumption. Thus equalization tends to drive tax rates above the target tax rate.2 (In Section 2 below, I offer a formal statement of this idea.)
An emerging empirical literature provides some evidence of the tax-raising effects of capacity equalization. Boadway and Hayashi (2001) report that provinces in Canada that receive equaliza-tion are more inclined than others to raise business tax rates when the naequaliza-tional average rate goes up, as the theory predicts. Esteller More and Sole Olle (2002) find a similar effect for personal tax rates in Canada too. Dahlby and Warren (2003) report that equalization grants induce higher levels of taxation by state governments in Australia, and Buettner (2005) and Egger et al. (2006) find the same for the municipal business taxes that are equalized in many German states.
In this paper, I seek to establish further evidence of the tax-raising effects of equalization, by taking a more comprehensive perspective on the data and adopting different identification strate-gies than in the previous literature. Using Canadian administrative data for the 1972-2002 period, I examine provincial tax decisions in most of the (about 30) revenue categories that are subject to 1Such equalizing transfers evidently serve a central role in achieving horizontal equity among regions, and in the presence of fiscally induced migration they may also be required to achieve a Pareto efficient allocation of resource among regions (Boadway and Flatters, 1982). See for example Bird and Smart (2002) for an overview of the theory and practice of intergovernmental transfers.
2A related literature deals with the “flypaper effect” of federal grants—the finding that categorical grants to subna-tional governments typically do not induce the reductions in local tax rates that elementary theory predicts; see Knight (2002) for a recent contribution. That literature deals with the income effects of grants, whereas the effect of equaliza-tion on tax rates is in the nature of a “price effect”.
equalization in Canada. The data and the relevant institutions are discussed in detail in Sections 3 and 4 of the paper.
To establish the causative impact of the transfers on subnational taxes, I take two approaches. First, in Section 5, I follow Boadway and Hayashi (2001) in estimating tax reaction functions for my more comprehensive data set, and compare how recipient and non-recipient provinces re-spond to changes in the target tax rate. Since the target rate in Canada is in fact the average of contemporaneous provincial tax rates, this raises a simultaneity problem, which I attempt to solve by using instrumental variables for the target tax rate. Based on the IV estimates, and consistent with the theory, I find that increases in the national average tax rate cause significant increases in tax rates of grant-receiving provinces, but not of other provinces.
Second, in Section 6, I exploit reforms in Canadian equalization grant program, which varied the rate at which natural resource capacity differentials have been equalized in the past. Since formula parameters vary in an arguably orthogonal way among revenue categories and provinces, and over time, the data therefore admit a “triple-difference” estimator of the effect of the formula. These estimates imply that an increase in the fraction of capacity differences equalized from 50 per cent to 100 per cent causes an increase in local tax rates of about seven percentage points. Interestingly, rough calculations based on the the structural estimates of Section 5, reported in the concluding Section 7, also suggest that halving the rate of equalization to 50 per cent would reduce tax rates in the affected provinces by about seven percentage points. On the basis of both estimation strategies, therefore, there is evidence of a robust and substantial tax-raising effect of equalization grants.
2
Equalization and tax competition
To understand how equalization grants affect tax interactions among governments, consider a sim-plified version of the model in Bucovetsky and Smart (2006). A federation consists of N jurisdic-tions, each with a single tax base, and with a fractionωi of the national population. Jurisdictioni levies tax rateyi on its own per capita tax base Bi, and it receives a per capita equalization grant equal to θy¯(B¯ −Bi), wherey¯ is the target tax rate, B¯ the target or standard fiscal capacity chosen by federal authorities, andθ the fraction of capacity differences B¯−Bi that is equalized. This for-mulation evidently subsumes the important polar cases of no equalization grants (θ = 0) and full
equalization of capacity differences (θ =1).
Let the tax base in each jurisdictionibe an identical linear function of tax rates in the federation,
Bi = B0+by¯−i−ayi (1) where ¯ y−i = 1 1−ωi
∑
j6=iωjyjis the population-weighted average of tax rates in competing jurisdictions, andB0i ≥0anda>b≥
0are parameters. Thus the model incorporates a fiscal spillover among jurisdictions whenb > 0, since tax rate increases by one jurisdiction cause tax base increases in the others.
From this formulation, it is apparent that increases in a jurisdiction’s own tax rate cause declines in its tax base, and tax base declines induce greater equalization transfers. Thus a government
seeking to maximize revenues net of equalization transfers3 optimally chooses a higher tax rate in the presence of equalization than it otherwise would. Moreover, this tax-raising effect is larger, the larger is the effective “subsidy rate”θy¯for capacity declines.
The analysis is complicated by the fact that, in most equalization programs, the target tax rate and standard fiscal capacity are functions of the actual tax rates and tax bases of jurisdictions, and so are endogenous to yi. A “sophisticated” government will recognize this dependence and adjust its optimal tax rate accordingly. To solve for optimal tax policies with equalization, then, lety¯and
¯
Bbe population-weighted means of tax rates and tax bases, respectively:
¯ y= N
∑
i=1 ωiyi (2) ¯ B= N∑
i=1 ωiBi (3)The equalization entitlement of jurisdictionican then be expressed, using (1) and (3), as Ei =θyc¯ i(yi−y¯−i)
whereci =ωib+ (1−ωi)ais a function of parameters. The tax ratey∗i that maximizes net revenues thus solves
max yiBi(yi, ¯y−i) +θyc¯ i(yi−y¯−i) subject to
¯
y=ωiyi+ (1−ωi)y¯−i
The first-order (necessary and sufficient) condition may be expressed as
y∗i(y¯−i,θ) =αi(θ) +βi(θ)y¯−i (4) where αi(θ) = B 0 2a−2θωici βi(θ) = b+θci−2θωici 2a−2θωici
Thus each government’s optimal tax rate is a linear function of the average tax rate in competing jurisdictions, and equalization grants (indexed by θ) affect both the intercept and slope of the
reaction function.4
To understand how equalization grants affect tax setting and the strategic interaction between competing governments, differentiate (4) with respect to the fraction of revenues equalized θ to
obtain ∂y∗i(y¯−i,θ) ∂θ = ci a−θωici ωiyi+ 1 2−ω ¯ y−i ≥ 0 sinceωi ≤ 1 2
3The revenue-maximization assumption is inessential; the case of welfare maximizing governments is addressed in Smart (1998), and the qualitative results are the same.
4Observe thaty∗
Differentiating again with respect toy¯−ilikewise shows that d dθ ∂y∗i(y¯−i,θ) ∂y¯−i =β0i(θ)≥0 Thus we have:
Proposition 1 An increase in the fraction of revenues equalized θ causes an increase in the
best-response tax ratey∗i, and an increase in strategic complementarity of tax rates(yi,yj).
That is, equalization grants cause recipient governments not only to raise tax rates, but also to increase their (here positive) response to tax rate increases of competitors. Thus, as shown by K¨othenb¨urger (2002) and Bucovetsky and Smart (2006) in somewhat different models, equaliza-tion serves to attenuate the “race to the bottom” in tax rates that may result from tax competiequaliza-tion. In the empirical exercise that follows, we will be especially interested in distinguishing tax set-ting behaviour of governments that receive equalization grants from those that do not. Accordingly, let y0i ≡αi(0) +βi(0)y¯−i = B0 2a + b 2ay¯−i (5)
denote the reaction function in the absence of grants, and
y1i ≡αi(1) +βi(1)y¯−i = B0 2(a−ωici) + b+ci−2ωici 2(a−ωici) ¯ y−i (6)
denote the reaction function given full equalization of capacity differences. The empirical work in Section 5 provides estimates of the difference in slopes of reaction functions for equalization receiving and non-receiving provinces,
∆i ≡ βi(1)−βi(0) =
(1−2ωi)aci+ωibci
2a(a−ωici)
(7) Observe that, consistent with Proposition 1, ∆i > 0; thus the main hypothesis to be tested is that strategic complementarity of tax rates is greater for equalization-receiving than non-receiving provinces. The magnitude of this effect depends on the tax base parameters a and b in general, but setting ωi = 0 in (7) implies ∆i = 1/2for all (a,b). Thus, for provinces with small popula-tion, the effect of equalization on complementarity are similar for all provinces and tax bases, and approximately equal to one-half.
2.1 Equilibrium and efficient taxation
In Section 6 of the paper, I present estimates of the reduced-form effect of the equalization rateθon
the tax rates of receiving and non-receiving provinces. These reduced-form estimates correspond to the Nash equilibrium of the theoretical model. Characterizing Nash equilibrium tax rates and how they depend on the equalization rate is complicated in general, because of the aforementioned dependence of each jurisdiction’s tax rate on its population share. But the main insights of the model can be obtained by considering the limiting case in which each jurisdiction’s population share is zero, so that its reaction function is a common function y∗(y¯−i,θ). Letting yR and yN
denote the equilibrium tax rates in receiving and non-receiving provinces, respectively, solving for the fixed point of reaction functions (4) in the limiting case implies
yR(θ)−yN(θ) = [α(θ)−α(0)] + [β(θ)−β(0)]y¯∗(θ) (8)
where y¯∗(θ) is the population-weighted average of the two Nash equilibrium tax rates, given θ.
Applying Proposition 1, each term on the right-hand side of this expression is increasing in θ.
Noting that equilibrium tax rates are continuous functions of population shares, we have:
Proposition 2 When jurisdictions’ population shares are small, an increase in the equalization rate
θ causes an increase in equilibrium tax rates of receiving provinces, relative to those of non-receiving
provinces.
That is, the testable hypothesis is that an increase in the rate at which capacity differences are equalized causes an increase in the difference in tax rates yR−yN. (BothyR andyN will increase when tax rates are strategic complements.)
In the empirical work below, I seek to establish that equalization transfers increase affected tax rates, in the sense of both Propositions 1 and 2. But drawing policy inferences from such a conclusion requires one to evaluate the efficiency properties of the resulting equilibrium tax rates. In the partial equilibrium theoretical model of Smart (1998), the tax-raising effect of equalization results in equilibrium tax rates that are above second-best optimal levels, and so a loss in welfare for consumers. But in the general equilibrium context of horizontal tax competition considered here, inducing jurisdictions to set higher tax rates may or may not be desirable from a national perspective.
It is a straightforward matter to determine the effect of equalization grants on welfare in this model. Consider a somewhat simpler environment, in which all jurisdictions in the federation receive equalization transfers (a “net scheme”), and all have equal populations. Solving again for the (now symmetric) fixed point of the reaction functions (4), the equilibrium tax rate, given the equalization rateθ, is:
¯
y∗(θ) = B
0
2a−b−θc (9)
wherec=ωb+ (1−ω)aas before.
A tax policy that is Pareto efficient from a national perspective is any (y1, . . . ,yN)which maxi-mizes national revenues∑yiBi, together with desired lump-sum transfers between the jurisdictions. The reader may easily verify that any such efficient allocation must have a uniform tax rate in all jurisdictions, so that we may equivalently choose a national tax ratey¯ to maximizey¯B¯(y¯), yielding
¯
ye = B
0
2a−2b (10)
as the unique Pareto efficient national tax rate.
Equating the two tax rate expressions, one sees thaty¯∗(θ) =y¯e if and only ifθc=b, or
θ= θ∗ ≡ b
ωb+ (1−ω)a ∈[0, 1)
Furthermore, since revenue is a concave function of the tax rate, we have:
Proposition 3 An increase in the equalization rate θcauses an increase in equilibrium national
A grant that equalizes a fraction θ∗ of capacity differences is therefore a Pigouvian corrective
device for tax competition, which decentralizes the Pareto optimal allocation. Naturally, the op-timal degree of equalization depends on the extent of interjurisdictional mobility of the tax base, parameterized by(a,b), and hence the degree of tax competition. In particular, suppose thatb→a, so that the national aggregate tax base is asymptotically independent of tax rates—a tax cut by one jurisdiction merely diverts tax base from the rest of the federation. Thenθ∗ →1: full equalization
of tax base deficiencies is optimal in the limit. At the other extreme, whenb=0anda >0, so that there is no interjurisdictional mobility, but taxes have distortionary effects within the jurisdiction, thenθ∗ =0: an equalization grant serves no corrective role, and any positiveθresult in equilibrium
tax rates in excess of the Pareto efficient level.
The a = b case, in which tax bases are perfectly inelastic nationally, but nonetheless mobile between jurisdictions of the federation, is no doubt extreme, and the rather Panglossian conclusion that a full equalization grant is also an optimal Pigouvian subsidy is therefore inaccurate in general. Indeed, on the basis of the estimates reported below, one may reach rather stark conclusions about the inefficiency of equalization payments in Canada. I return to this assessment in the final section of the paper.
3
Equalization grants in Canada
The federal government in Canada has since 1957 operated capacity equalization grants for the ten Canadian provinces on the basis of the so-called Representative Tax System (RTS). The RTS system is designed to allow provinces to obtain the same fiscal resources when they levy the same tax rates, despite differences in the sizes of their tax bases. It pays provinces an amount, in respect of each revenue source defined in the system, equal to the deficiency, relative to a standard level, in the revenues it could collect from each measured base, if it levied the average of all provinces’ tax rates. At present, this calculation is done for 33 separate revenue sources, and the standard tax base is set equal to the population-weighted average of per capita tax bases in a subset of five provinces. Equalization entitlements are then summed over the 33 categories and, if the total is positive, the province is paid its entitlement, subject to provisions that are intended to smooth changes in payouts for both federal and provincial governments. A province with a negative net entitlement receives a net transfer of zero; thus equalization is on a “gross” rather than “net” basis, and aggregate transfers are financed from general federal tax revenues, rather than through contributions imposed on high-capacity provinces.
In algebraic terms, the equalization formula is a slightly more complex version of that consid-ered in Section 2: Consider revenue source j, for which each provincei has a measured tax base Bij and collects revenues subject to equalization Rij. Let Ni be the population of each province. Let Rj = ∑iRij, Bj = ∑iBij, and N = ∑iNi be the national aggregates of provincial revenues, tax bases, and population, and Bsj = ∑i∈SBij and Ns = ∑i∈SNi be the corresponding aggregates for the five standard provinces. The RTS system calculates the national average effective tax rate
¯
yj = Rj/Bj and determines the standard per capita tax base Bsj/Ns. The equalization entitlement of each provinceiin respect of revenue categoryjis then
Eij =y¯j B sj Ns − Bij Ni Ni
national average tax rate and by its population. Each province then receives an aggregate transfer Ei∗ =max{
∑
j
Eij, 0}
That is, if the aggregate of entitlements for all revenue sources is positive, the province is termed a “receiving province” and is paid its entitlement; otherwise, the province is “non-receiving” and is paid zero.
While equalization grants have been paid on an RTS basis in Canada since 1957, the specifics of the transfer formula are adjusted often, and the enabling legislation for the transfers is re-enacted every five years by the federal government. The quinquennial reforms have dealt primarily with the number and definition of revenue sources used in the formula, and the data sources and mea-surement techniques used to construct proxies for revenue capacities, where direct meamea-surement of the relevant tax bases is impossible. For example, since 1992 each province’s tax base for Forestry Revenues has been defined as the volume in cubic metres of wood cut on government-owned land during the year, replacing an earlier definition based on annual estimates of industrial value added in each province. The most significant such reform took place in 1982, when the number of rev-enue categories was increased to 33 from 29 and the standard tax basesBsjwere defined to be the aggregate tax base of the five “standard” provinces rather the previous national average standard.5 Such technical changes in tax base measurement pose a challenge for the empirical work that follows, since changes in effective provincial tax rates calculated from administrative data may merely reflect base redefinitions, rather than real changes in provincial tax policies. I describe my strategy for dealing with this problem in the next section.
Many of the changes to the formula have related to oil, natural gas, and other resource revenues of the provinces—no doubt reflecting the great inequality in the distribution of these revenues among the provinces and consequently the high fiscal cost to the federal government of equalizing them on a gross basis. In particular, in response to the increase in world energy prices (and hence in provincial revenues) in the 1970s, the federal government has introduced a number of reforms to the program that have altered the fraction of provincial resource revenues subject to equalization. Beginning in 1974, the fraction of incremental energy revenues equalized was reduced to one-third from 100 per cent; however, so-called “basic” energy revenues—those deemed to be available at pre-1973 energy prices—continued to be fully equalized. In the 1977 reform, the basic–incremental distinction was abandoned, and 50 per cent of all provincial revenues from non-renewable natural resources were made subject to equalization. In 1982, the federal government returned to 100 per cent equalization of resource revenues, but as discussed above the standard level of revenue capacity was adjusted downward in order to keep aggregate transfers roughly the same. Full equalization of all revenue categories to the lower standard has remained in place since 1982.
The reforms have however had little impact on the set of provinces eligible to receive Equaliza-tion, which has remained very stable over time. In the 1972–2002 sample period for my data set, six provinces received Equalization grants in all years, and one additional province (Saskatchewan) received grants in all but five of the sample years. My estimates of the effects of the grants are there-fore driven by differences in observed behaviour of receiving and non-receiving provinces, rather than (potentially endogenous) changes in behaviour coincident with changes in eligibility.
5The five standard provinces are Quebec, Ontario, Manitoba, Saskatchewan, and British Columbia; the previous standard also included the energy-rich province of Alberta and the four provinces on the Atlantic seaboard. The apparent goal of the reform was to reduce the sensitivity of aggregate transfers to changes in energy prices and hence in Alberta’s revenue capacity.
4
Data and estimation
The principal source of data for the analysis is an administrative data set recording tax bases and revenues of the 10 provinces for the 1972–2002 period—excluding 1973 and 1981, when tax base data are missing—which is used by the federal Department of Finance to compute each province’s transfer entitlements under the Equalization program. The ratio of tax revenues to tax base for each province, year, and revenue category defines the respective effective tax rate, which is the dependent variable for the analysis.
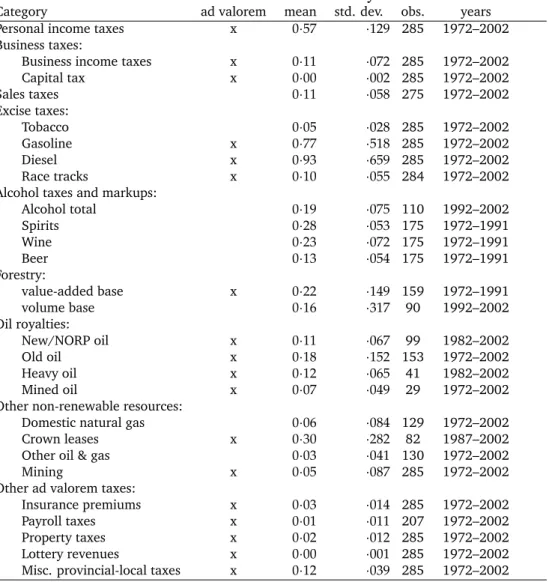
Naturally, measurement of the appropriate base for each provincial revenue source is a difficult and sometimes subjective process, and a small number of the measured bases in the administrative data bear little relation to the underlying economic activity from which the revenues are derived. For example, the measured tax base for residential and commercial property taxes is a modified measure of provincial personal income, rather than an estimate of the value of the stock of assets. In such cases, I excluded the revenue category from the analysis a priori; a full list of these exclusions is given in the data appendix. A related concern is technical changes in the measurement of tax bases during the sample period, which give rise to changes in the constructed average effective tax rates that are unrelated to the underlying tax policies of the provinces. My data for the 1972-86 period are all measured on a consistent basis, since tax bases were recalculated retrospectively for all preceding years at the time of the 1982 reforms. For the 1987-2002 period, however, some measurement changes occurred. As noted above, for example, since 1992 each province’s tax base for Forestry Revenues has been defined as the volume in cubic metres of wood cut on government-owned land during the year, replacing an earlier definition based on annual estimates of industrial value added in each province. My strategies for dealing with measurement changes are described further below. After the a priori exclusions, there are 27 revenue categories recorded for at least some of the 29 years in the sample; when a province has no recorded tax base in a category, the corresponding tax rate is treated as missing. As a result, there is a total of 6017 observations in the unbalanced panel. Summary statistics for the revenue categories used in regression analysis are given in Table A1 of the appendix.
The theory set out in Section 2 advances two propositions about the tax-raising effects of equal-ization grants. First, equalequal-ization increases the strategic complementarity of competitors’ tax rates. Second, an increase in the fraction of revenues equalized through the formula causes an increase in the tax rates set by receiving governments, relative to non-receiving governments. Both proposi-tions are amenable to empirical tests with the data set.
To test the first proposition, I estimate equations of a form analogous to (5)–(6):6
ETRitc =αi+δt+γc+β0ATRitc+ (β1−β0)ATRitc×RCVi+Xit0θ+eitc (11) where ETRitc is the effective tax rate for province i, year t, and revenue category c, ATRitc is the population-weighted average of the same tax rates in the other nine provinces,RCViis an indicator variable for Equalization-receiving provinces,Xitis a vector of other explanatory variables,(α,δ,γ)
are vectors of fixed effects for provinces, years, and categories, and(β0,β1,θ)are other parameters
to be estimated. The controls in X are, as in much empirical research on tax setting, province-level economic, political, and demographic variables, including GDP per capita, the percentage of
6In the theoretical model, the coefficients
β0andβ1may in principle differ among revenue categories and provinces, so that the empirical estimates should be construed as average tax interaction effects for the sample. As noted in Section 2, the equalization tax interaction effectβ1−β0is predicted to be near one-half for all provinces of small population, regardless of the of tax base parameters, so that heterogeneity of tax interaction effects should be small.
the population under age 19 (Young), the percentage over age 64 (Old), and indicator variables for years in which the provincial government is controlled by right-leaning (Conservative) and left-leaning (Social democratic) political parties.7 The data on the control variables is taken from official Statistics Canada sources.
Under the equalization tax-interaction hypothesis,β1−β0 >0: equalization-receiving provinces should respond more positively to tax rate increases of other provinces than do non-receiving provinces.8 Since fixed effects are included in (11), β1−β0 is identified from the differing re-sponse of receiving and non-receiving provinces to changes in ATRover time.9 Furthermore, the hypothesis that β0 = 0 may be construed as a test of the notion that there are on average no tax interactions among governments—and so no tax competition—except for those induced by the Equalization formula.
Estimation of (11) is complicated by the possibility that tax rates in the various revenue cat-egories are contemporaneously correlated among provinces, so that E(eitc|ATRitc) 6= 0 and OLS
estimates are biased. To address this possibility, I adopt an instrumental variables strategy, in which the population-weighted averages of a subset of the explanatory variables Zjtc,j 6= i, are used as instruments for ATRitc. That is, in the usual two-stage interpretation of the estimation procedure, ATRitcandATRitc×RCVitare projected ontoXitc, the vectors of fixed effects, and the instruments
¯
Zitc˜ =
∑j6=iPOPjtZjtc ∑j6=iPOPjt
whereZjtc is a subvector ofXjtc. The particular instruments I choose are (the population-weighted averages of) Conservative, Social democratic, and Old for the other nine provinces.
The other part of Proposition 1, that equalization increases the intercept of reaction functions, is not amenable to testing with the Canadian data, because the set of Equalization-receiving provinces is nearly unvarying over the sample period.10 Consequently, RCVi is collinear with the province fixed effects, and it is excluded from the regression.
The second theoretical proposition, concerning the effects of partial equalization on the level of taxes, has the virtue of being amenable to test in a reduced form specification, by exploiting the variation in the fraction of natural resource revenue differences that were equalized during the 1970s (see Section 3). Again, the empirical approach is one of “differences in differences,” based on comparison of the changes in tax rates of receiving and non-receiving provinces following the return to full equalization in 1982. Of course, the oil shocks of the 1970s had far-reaching economic impacts, which might in principle differ between receiving (generally poor) and non-receiving (rich) provinces in Canada, and which would therefore bias the difference-in-difference 7The conservative parties in power provincially during my sample period are those known as the Progressive Conser-vative and Social Credit parties. The social democratic parties are those known as the New Democratic Party and the Parti Quebecois. The excluded category is the centrist Liberal party.
8As noted in Section 3, the Canadian formula has since 1982 used an average of only five of the ten provinces’ tax bases to measure the standard capacity level. However, the target tax rate remains defined as the average of all ten provinces’ effective tax rates. The equalization effect should therefore be manifested in the response ofETRtoATR, the average of the nine other provinces’ tax rates.
9The specification uses variation in ATR among revenue categories to estimate
β1−β0, and so assumes there are no interactions among revenue categories, as opposed to among provinces, due to substitution patterns of taxpayers or income effects on government policies. Note however that income effects are likely negligible, since most revenue categories are a small share of total revenues.
10One receiving province, Saskatchewan, did not receive Equalization payments during the 1982-86 period, due to the effect of high energy prices on its measured fiscal capacity. To avoid dealing with the resulting problems of non-linearity and endogeneity, I simply delete all observations for Saskatchewan in these five years.
estimates. In this case, however, a natural control is available in the observed tax rates of the two groups of provinces for the non-resource revenue categories, for which there were no changes in the rate of equalization under the formula during the sample period. I therefore estimate the effect of partial equalization from a “triple difference” specification. Define RCVi as an indicator vari-able for equalization-receiving provinces,RESOURCEcas an indicator for the resource categories affected by the grant reform, and PARTIALt as an indicator for the years 1974–1980 when the partial equalization system applied. An estimate of the effect of partial equalization is then the OLS estimate ofγfrom the specification:
ETRitc =α0+α1RCVi+α2RESOURCEc+α3PARTIALt
+β1RCVi×RESOURCEc+β2RCVi×PARTIALt+β3RESOURCEc×PARTIALt
+γRCVi×RESOURCEc×PARTIALt+eitc (12)
Since (12) includes the full set of bilateral interactions between the treated provinces RCVi, the affected revenue categoriesRESOURCEc, and the pre- and post-reform years PARTIALt, identifi-cation of the treatment effect γ is based only on the assumption that there were no unobserved
shocks contemporaneous with the reform that affected resource tax ratesrelative to non-resource tax rates in equalization-receiving provinces, and that did not similarly affect relative tax rates in the non-receiving provinces. In particular, this approach controls for unobserved effects of the 1973 oil shock (largely coincident with the partial equalization period) on resource tax rates of all provinces relative to non-resource taxes, and on all tax rates of receiving provinces relative to non-receiving provinces.
Because (12) is a reduced form specification of the effects of equalization on taxes, the resulting estimate ofγis interpreted as the treatment effect of partial equalization on the Nash-equilibrium
tax rates of receiving provinces derived from the reaction functions (4), relative to the effect on Nash-equilibrium tax rates of non-receiving provinces. That is, the estimation equation corresponds to the difference in equilibrium tax rates in equation (8), and Proposition 2 implies the testable hypothesisγ > 0. In practice, as we will see, there is little evidence of a feedback from tax rates
of receiving provinces to those of non-receiving provinces—the data are consistent with the only interaction in tax-setting coming from the equalization grant, rather than from inter-jurisdictional tax competition per se. Assuming no feedback effect of the reform on non-receiving provinces, then, the estimate of γmay be interpreted as the combined effect of the reform on the slope and
intercept of the reaction functions of grant-receiving provinces. I offer further interpretation of the coefficient in Section 7.
5
Tax interaction effects of equalization
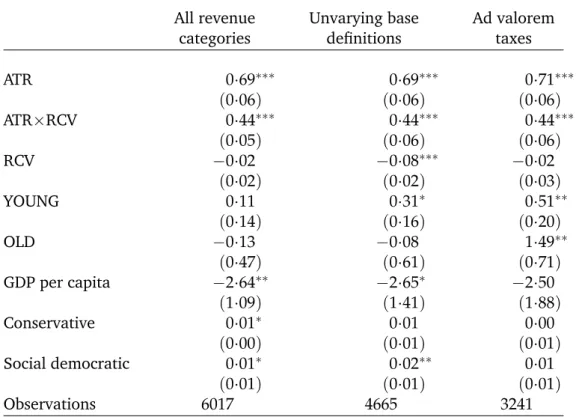
I begin in Table 1 with OLS estimates of the tax-interaction (or slope) effect of equalization, esti-mated from the empirical version of the reaction function given in equation (11). All specifications in the table include fixed effects for each province, year, and revenue category in the pooled data set, the estimates of which are not reported.11 The reported estimated standard errors are robust to heteroskedasticity and arbitrary correlations among the vector of tax rates for a particular province 11I also include separate dummy variables for the personal income tax category in Quebec and the other provinces after 1976. This controls for the effects of the 1977 transfer of tax powers from the federal government to the provinces, which increased provincial taxes more in Quebec than other provinces.
and year, which are the dimensions inducing exogenous variation in ATRitc, the main right-hand side variable of interest.
The first column reports results estimated from the full data set, including all 27 revenue cat-egories. Observe that the effect of average competitors’ tax rates ATR is large and significantly different from zero at the one per cent significance level. For non-receiving provinces, indicated by RCV= 0, the point estimate of the effect is 0.69, and for receiving provinces (RCV= 1), the point estimate is significantly higher at 1.13. The demographic variables YOUNG and OLD are insignif-icant in this specification, perhaps because the principal impacts of demographic differences are absorbed by the province and year fixed effects. However, GDP per capita (measured in thousands of 1992 dollars per year) is significantly negatively related to tax rates in the OLS estimates, while presence of either Conservative or Social Democratic provincial governments is associated with somewhat higher taxes than under centrist Liberal governments, the excluded category.
As discussed in Section 4, tax bases for the revenue categories are measured in a variety of units, and some of the base definitions in the administrative data seem rather arbitrary. The principal control for the different units of the specific tax rates is the estimated fixed effects for each revenue category. Moreover, ETR and ATR are measured in comparable units for each observation, so that the estimates should not be much affected by changes in base definitions. To check robustness, however, the next two columns of Table 1 report estimates for smaller and more reliable samples of tax rates. In column 2, I exclude observations on six revenue categories for which base definitions are weakly related to the underlying economic activity from which the revenues are derived.12 In column 3, I additionally exclude all categories measured as specific rather than ad valorem (percentage) tax rates. In both cases, the OLS estimates of the tax interaction effects are essentially unchanged.
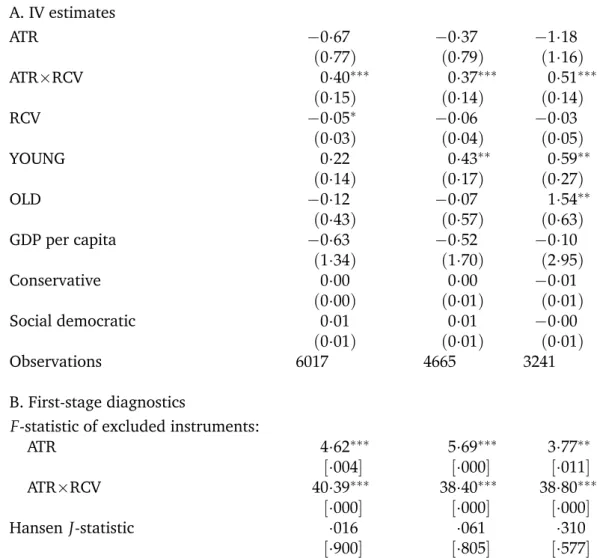
The obvious objection to these estimates of tax interactions is that tax rates in the various revenue categories are contemporaneously correlated among provinces, so that even controlling for fixed effects the error term in (11) is correlated with the average of competitors’ tax rates ATRitc. To address this possibility, I instrument for ATR using population-weighted averages of a subset of the control variablesXjtcof competing provinces. To keep the first stage parsimonious, I choose the two political variables Conservative and Social Democratic, and the population fraction Old as the excluded instruments for the two endogenous variables ATR and ATR×RCV on the right-hand side of (11). The resulting two-stage least squares estimates are reported in Table 2, which is organized in a way parallel to the OLS estimates of Table 1. The bottom panel of the table reports some diagnostic statistics for the first-stage projections of ATR and ATR×RCV onto the instruments. The excluded instruments are jointly significant in all three regression samples used, as indicated by the reported F statistics, albeit with somewhat greater explanatory power for the average tax rates faced by the receiving provinces. First-stage coefficients are unreported for the sake of brevity, but note that the average of Conservative exerts a significant negative effect on the average tax rate in both first-stage equations, conforming to intuition. The average fraction Old has a significant negative effect on ATR and a significant positive effect on ATR×RCV. On the basis of the Hansen J statistics, I conclude that the instruments may reasonably be excluded from the second stage regressions in all three samples.
Relative to the OLS estimates, the principal difference to be discerned from the results in the top panel of Table 2 is that point estimates of the tax interaction effect ATR are now negative, and are insignificant in all cases. This is consistent with the notion that observed correlations 12The six are Commercial vehicle licences, Crown leases, Other oil and gas revenues, Property taxes, Lottery revenues, and Miscellaneous provincial–local tax revenues.
among tax rates for non-receiving provinces reflect unobserved common shocks to tax rates, rather than any causal effect such as tax competition. The estimated coefficients for ATR×RCV remain however significantly positive in all cases. The tax interaction effect induced by the equalization grant formula is estimated to be about 40 or 50 per cent, depending on the sample used: that is, each one percentage point increase in the average of competitors’ tax rates induces an increase in tax rates of equalization-receiving provinces that is about one-half percentage point higher than in non-receiving provinces.13
Because ATRis the population-weighted average of all other provinces’ tax rates, the test that
β0 =0may lack power as a test for the absence of tax competition, if provinces react only to near neighbours’ tax rates—and if these local interactions are missed by looking at national averages. In an alternative specification, not reported in the table, ATRitc was constructed as the average of other provinces’ tax rates, weighted by the product of their population and the inverse of the distance from the major city in each province and province i. This approach therefore assigns more weight to near neighbours’ tax rates, which may be more relevant to tax competition (though less relevant to the Equalization effect). The estimates of β0 and β1−β0 in this specification are nearly identical to those reported here, reflecting the high cross-sectional correlation of tax rates. Likewise, provinces may react to the tax rates of others, but only with a lag. In alternative unreported specifications, ATRitc was replaced by one-year and two-year lagged values, and the key coefficient estimates were essentially unchanged.
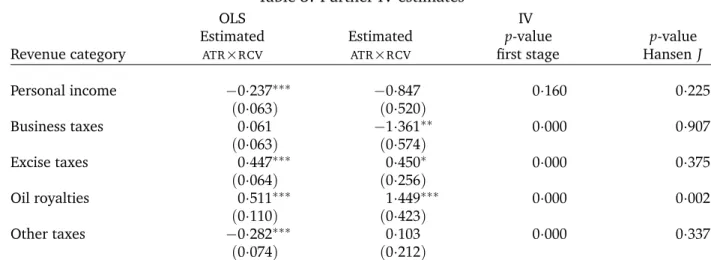
As a final robustness check, I report in Table 3 estimates of the equalization tax interaction parameter ATR×RCV, estimated for various subsamples in which the revenue categories used are more directly comparable with each other. The leftmost column of figures reports the OLS esti-mated coefficient, while the next three columns report IV estimate and the p-values for the joint significance of the excluded instruments in the first stage for ATR×RCV and for the overidentifica-tion test. In three of five cases, the IV estimated equalizaoveridentifica-tion tax interacoveridentifica-tion is positive, in two cases significantly so. Interestingly, the IV estimates of the effect for personal income and business taxes are negative, the latter significantly. These results are at odds with those reported in Boadway and Hayashi (2001) for corporate taxes and in Esteller More and Sole Olle (2002) for personal income taxes. The difference may reflect differences in data, since the other two papers use effective tax rates calculated from the national income accounts, rather than my administrative data sources, or in the identification strategy employed. Indeed, my excluded instruments are insignificant in the first stage for personal income taxes, so the insignificance of the estimated second-stage coeffi-cient is unsurprising. The estimated coefficoeffi-cient for the oil revenue categories is in contrast strongly positive, and perhaps implausibly large. In this case, the J test statistic casts some doubt on the validity of the instruments. For these categories, an alternative identification strategy is available, described in the next section.
6
Partial equalization
I turn now to the reduced form estimates of the effect of equalization grants on taxes, estimated from the asymmetric changes in the equalization formula in the 1972–82 period. Recall that during 1974–76 only one-third of incremental deficiencies in oil and gas revenue capacity were equalized by federal transfers; during 1977–1981 partial equalization was extended to all non-renewable natural resource revenues (i.e. including mining taxes), and the equalization rate was increased 13Since the point estimate of theATRcoefficient is negative in all cases in Table 2, the estimated combined effect of
to 50 per cent; in 1982 and thereafter, the equalization rate was 100 per cent, while the standard capacity was adjusted downward to keep transfer payments roughly constant. The reduced form prediction of our theory is that grant-receiving provinces should set higher tax rates in the affected categories under full equalization than under partial equalization. That is, the treatment group is the natural resource categories in the receiving provinces, while the available control groups for the analysis are the unaffected revenue categories and the provinces that did not receive equalization grants.
Table 4 presents the mean tax rates for the relevant combinations of provinces, revenue cat-egories, and years.14 Observe that the average resource tax rate for receiving provinces during the full equalization period was 0.1054, up from 0.0861 during the years of partial equalization. Over the same period, in contrast, resource tax rates in non-receiving provinces fell to 0.1012 from 0.1272. The difference in these changes is -0.0453, which is one possible estimate of the effect of partial equalization on the affected tax categories and provinces.
Of course, the oil shocks of the 1970s had far-reaching economic impacts, which might in principle differ between receiving (generally poor) and non-receiving (rich) provinces in Canada, and which would therefore bias the difference-in-difference estimates. In this case, however, a natural control is available in the observed tax rates of the two groups of provinces for the non-resource revenue categories, for which there were no changes in the rate of equalization under the formula during the sample period. In this case, then, the identifying assumption is the weaker requirement that there were no unobserved shocks contemporaneous with the reform that affected resource tax rates relative tonon-resource tax rates in equalization-receiving provinces, and that did not similarly affect relative tax rates in the non-receiving provinces. The lower part of Table 4 therefore reports the same calculations for the unaffected revenue categories. Observe that, in partial equalization years, non-resource tax rates in receiving provinces were 0.0203 higher than in full equalization years, compared to the corresponding difference over the same period in the non-receiving provinces. The triple difference estimate of the effect of partial equalization is therefore −0.0453−0.0203= −0.0656, as reported in the last row of the table.
Table 5 next reports regression-based estimates of the triple difference effect, in order to obtain estimated standard errors and to facilitate robustness checks on the sample and on the controls for unobservables. The left column of numbers are estimates of the treatment effect of partial equalization from equation (12), while controlling for unobserved differences in tax rates between receiving and non-receiving provinces, affected and unaffected categories, pre- and post-reform years, and all bilateral interactions of these three aggregate binary indicators. The three rows of numbers in the table correspond to the three regression samples, as in the earlier tables. The first estimate therefore corresponds exactly to the estimate reported in Table 4 (the difference in the final digit is rounding error), and the reported heteroskedasticity-robust standard error indicates that the estimate is significantly different from zero at the 10 per cent level. The remaining estimates in the column show that the estimate is similar in the smaller samples, though estimated standard errors rise and statistical significance of the triple difference disappears.
While this procedure implements the standard triple difference estimator, considered e.g. by Gruber (1994), observe that the treatment effect γin (12) remains identified even when the
un-observed component in tax rates is permitted to vary systematically among provinces, revenue categories, and years within the eight cells reported in Table 4. Since the data set constitutes an 14As noted above, partial equalization applied only to oil and gas revenues prior to 1977, when it was extended to mineral revenues as well. Observations on the mining category are therefore split in two, and defined as part of the control group for 1974–76 and as part of the treatment group for 1977–81.
unbalanced panel, moreover, the usual triple difference estimator may not be robust to such varia-tion. For example, the data set includes some revenue categories for which tax rates are recorded only in the post-reform period 1982–2002. If the mean unobservable component of these tax rates differs between the receiving and non-receiving provinces, therefore, then the usual triple differ-ence estimates are biased. To explore this possibility, I therefore also estimate a version of (12) that includes a full set of fixed effects for each province, year, and revenue category, as well as the approximately 1500 bilateral interactions between them. Thus the estimating equation becomes:
ETRitc =β1ic+β2it+β3ct+γRCVi×RESOURCEc×PARTIALt+eitc (13) where β1,β2,β3 are vectors of all first-order and second-order fixed effects to be estimated. The
resulting estimates of γ are reported in the right column of Table 5. In all cases, the estimates
are quite similar to the previous specification, but estimated standard errors somewhat smaller. The result is that the estimated treatment effect is in each sample significantly different from zero. Since the economic interpretation of the coefficient is clearest in the case of the sample of ad valorem taxes, I emphasize the last-reported estimate, which indicates that partial equalization was associated with tax rates about seven percentage points lower in the treated categories and provinces. I offer some further interpretation of the coefficient below.
7
Conclusion: Interpreting the results
In a federal system of government, subnational governments are ceded authority to collect taxes and determine levels of public spending. When this is so, attempts by federal authorities to promote regional equity through transfers may be hampered by the distortions in incentives for tax authori-ties at the subnational levels that such transfers create. Fiscal federalism therefore creates conflicts between efficiency and equity analogous to those existing in personal tax systems. Capacity equal-ization grant formulas are commonly adopted in many countries, in an attempt to minimize these incentive problems, compared to other systems of local revenue sharing. The notion is that cal-culating transfer entitlements indirectly, using differences in revenues calculated at deemed rather than actual tax rates, attenuates distortionary effects on the tax rates of recipient governments. But when measured tax bases respond negatively to tax rate increases, this formula may induce higher levels of distortionary taxation: increasing local tax rates causes measured tax bases to decline, as economic activity shifts to other regions of the country or to other, more lightly taxed forms—and so causes capacity equalization transfers to rise. Thus the grants in effect subsidize increases in distortionary taxes by equalization-receiving governments.
The empirical work reported in this paper suggests indeed that the tax-raising effect of equal-ization grants can be large. In a reduced form specification, it is estimated that the equilibrium impact of a policy reform that reduced the rate at which capacity differences were equalized from 100 to 50 per cent—in effect halving the size of the distortion—was to decrease the affected tax rates by about seven percentage points.
To get a further sense of the magnitude of the impact, it is useful to consider also the equilibrium implications of the tax-interaction effect of equalization grants, estimated from the structural model of tax reaction functions. Consistent with the structural estimates of Section 5, suppose that the slope of the best response function of provinces that do not receive equalization grants is zero— that is, there is no tax competition effect—whereas the slope of reaction functions in receiving provinces is 0.5 because of the equalization effect. Applying equation (8) with the point estimates
in grant-receiving provinces may then be shown to be ∂y¯R(θ) ∂θ = ¯ y 2−θωR
where y¯R is the average equilibrium tax rate in grant-receiving provinces, y¯ the national average or target tax rate, and ωR the population weight of the aggregate of receiving provinces in the formula. Since the population share of the Canadian receiving provinces is about one-half, and the average tax rate in my sample is about 0.2, a rough estimate of the marginal effect of equalization on tax rates atθ =1, based on the structural estimates, is∂yR/∂θ=.2/1.5=2/15.
In other words, based on the structural estimates, a reduction in the equalization rate from 100 to 50 per cent is estimated to reduce affected tax rates by about1/15 ≈ 0.067—a very rough approximate calculation that is nevertheless remarkably similar to the reduced form estimate from the actual policy reform, whose estimator relies on an entirely different identification strategy. Together with the evidence from various countries in the previous literature, this might be taken as fairly robust evidence of a meaningful effect of equalization grants on subnational tax policies.
Another way to evaluate the plausibility of the structural estimates ofβ0andβ1is to ask whether they are consistent with reasonable values for the tax base and population parameters that are the primitives of the theoretical model. As noted, the estimates are consistent withβ0 =0, which holds in the theoretical model if and only ifb = 0, i.e. no spillovers from tax rates to tax bases in other provinces. Butb=0implies that the tax-interaction effect of equalization in the theoretical model is, using equation (4),
βi1−βi0=
1
2(1−ωi)
independent of the own-tax responsiveness parameter a. Since the average population share of receiving provinces in the sample is 6.1 per cent, the average equalization effect predicted by the theoretical model is β1−β0 = 0.47, well within the confidence interval actually estimated. In other words, both of the slope parameters estimated are consistent with tax interactions driven by intergovernmental transfer considerations, but not by horizontal tax competition per se.
In the partial equilibrium theoretical model of Smart (1998), the tax-raising effect of equal-ization results in equilibrium tax rates that are above second-best optimal levels, and so a loss in welfare for the affected consumers. But K¨othenb¨urger (2002) shows that, in the presence of horizontal tax competition, equalization can induce an increase in Nash-equilibrium tax rates that increases consumer welfare. Indeed, Bucovetsky and Smart (2006) show that, when tax compe-tition effects are strong enough, an equalization grant may in a wide variety of settings induce subnational governments to independently choose tax rates that are optimal from a national per-spective. My estimates suggest however that, for the tax systems of the Canadian provinces at least, the effects of tax competition within the federation on tax rates are negligible, so that equalization grants cannot be interpreted as (however unintentional) a corrective device for tax competition, and the tax-raising effect of the grants is deleterious to consumer welfare.
Data appendix
The principal source of data for the analysis is an administrative data set recording tax bases and revenues of the 10 provinces for the 1972–2002 period—excluding 1973 and 1981, when tax base data are missing—which is used by the federal Department of Finance to compute each province’s transfer entitlements under the Equalization program. The ratio of tax revenues to tax base for each province, year, and revenue category defines the respective effective tax rate, which is the dependent variable for the analysis.
A total of 35 separate revenue categories have been used in the formula since 1972, but I delete a number of these categories a priori, since the ad hoc way in which tax bases of provinces are measured renders the resulting effective tax rates highly unreliable as measures of actual provincial tax policies. For example, the tax base for Hospital and Medical Insurance Premiums is measured as a weighted average of the number of persons in various income categories in each province— with the weights changing frequently over the sample period—despite the fact that some provinces levy payroll taxes for medical care and many levy no such taxes whatsoever. Likewise, I exclude Succession Duties, for which the base definition is arbitrary, and which all the provinces phased out in any case during the 1970s. I also exclude the Water Power category, for which the base is nominally measured in kilowatt-hours, but with numerous ad hoc adjustments over the years that are apparently designed to affect the entitlement of one province, Newfoundland. Also excluded are a small number ofsui generiscategories, for which in many years more than 70 per cent of the national base accrues to a single province.15 Such categories are known to create special incentive problems for the provinces (e.g., Courchene, 1984) that are quite distinct from the subject of this paper. I also delete some observations while retaining others for the same base: Crown Leases for the period 1972-86, when the base was defined to be actual revenues of the provinces, so that the implied effective tax rates are all identically equal to unity, and Other Oil and Gas in 1972–76 and Forestry in 1992–94, when the scale of tax capacities in the data differ markedly from the adjacent years. These anomalies presumably reflect either undocumented changes in the base definitions or simple data entry errors. Summary statistics for the tax rates used in the analysis are presented in Table A1.
15These categories are known as Potash, Newfoundland Offshore Resources, and Nova Scotia Offshore Resources. On the same grounds, I exclude Exported Natural Gas, the vast majority of which accrues to two provinces, neither of which receives equalization grants.
Table 1: OLS estimates of the effect of equalization on tax interactions All revenue Unvarying base Ad valorem
categories definitions taxes
ATR 0·69∗∗∗ 0·69∗∗∗ 0·71∗∗∗ (0·06) (0·06) (0·06) ATR×RCV 0·44∗∗∗ 0·44∗∗∗ 0·44∗∗∗ (0·05) (0·06) (0·06) RCV −0·02 −0·08∗∗∗ −0·02 (0·02) (0·02) (0·03) YOUNG 0·11 0·31∗ 0·51∗∗ (0·14) (0·16) (0·20) OLD −0·13 −0·08 1·49∗∗ (0·47) (0·61) (0·71) GDP per capita −2·64∗∗ −2·65∗ −2·50 (1·09) (1·41) (1·88) Conservative 0·01∗ 0·01 0·00 (0·00) (0·01) (0·01) Social democratic 0·01∗ 0·02∗∗ 0·01 (0·01) (0·01) (0·01) Observations 6017 4665 3241
Notes: Robust standard errors in parentheses.
Table 2: IV estimates of the effect of equalization on tax interactions All revenue Unvarying base Ad valorem
categories definitions taxes A. IV estimates ATR −0·67 −0·37 −1·18 (0·77) (0·79) (1·16) ATR×RCV 0·40∗∗∗ 0·37∗∗∗ 0·51∗∗∗ (0·15) (0·14) (0·14) RCV −0·05∗ −0·06 −0·03 (0·03) (0·04) (0·05) YOUNG 0·22 0·43∗∗ 0·59∗∗ (0·14) (0·17) (0·27) OLD −0·12 −0·07 1·54∗∗ (0·43) (0·57) (0·63) GDP per capita −0·63 −0·52 −0·10 (1·34) (1·70) (2·95) Conservative 0·00 0·00 −0·01 (0·00) (0·01) (0·01) Social democratic 0·01 0·01 −0·00 (0·01) (0·01) (0·01) Observations 6017 4665 3241 B. First-stage diagnostics
F-statistic of excluded instruments:
ATR 4·62∗∗∗ 5·69∗∗∗ 3·77∗∗ [·004] [·000] [·011] ATR×RCV 40·39∗∗∗ 38·40∗∗∗ 38·80∗∗∗ [·000] [·000] [·000] HansenJ-statistic ·016 ·061 ·310 [·900] [·805] [·577] Notes: Robust standard errors in parentheses and p-values in brackets. For
each observation, instruments for ATR and ATR×RCV are the population weighted averages of Conservative, Social Democratic, and Old in the other provinces.
Table 3: Further IV estimates
OLS IV
Estimated Estimated p-value p-value Revenue category ATR×RCV ATR×RCV first stage HansenJ
Personal income −0·237∗∗∗ −0·847 0·160 0·225 (0·063) (0·520) Business taxes 0·061 −1·361∗∗ 0·000 0·907 (0·063) (0·574) Excise taxes 0·447∗∗∗ 0·450∗ 0·000 0·375 (0·064) (0·256) Oil royalties 0·511∗∗∗ 1·449∗∗∗ 0·000 0·002 (0·110) (0·423) Other taxes −0·282∗∗∗ 0·103 0·000 0·337 (0·074) (0·212)
Notes: Robust standard errors in parentheses. The instruments are the same as in Table 2.
Table 4: Equalization reform and effective tax rates
Mean effective tax rates:
Revenue category and Number of Full equal- Partial equal- Difference
province type observations ization years ization years over time
Resource royalties, equalization provinces 423 0.1054 0.0861 -0.0193 Resource royalties, other provinces 485 0.1012 0.1272 0.026
Difference in difference: -0.0453
Other taxes, equalization provinces 3550 0.2055 0.2562 0.0507 Other taxes, other provinces 1560 0.1598 0.1902 0.0304
Difference in difference: 0.0203
Triple difference : -0.0656
Table 5: Triple difference estimates of the effect of partial equalization
Controls for unobservables:
Aggregate All bilateral
Sample interactions interactions
All revenue categories -0.0654∗ -0.0463∗∗ [0.0382] [.0234] Unvarying base definitions -0.0579 -0.0626∗∗ [.0448] [.0294] Ad valorem taxes -0.0709 -0.0721∗ [.0609] [.0414] Notes: Robust standard errors in brackets.
Table A1: Effective tax rates: Summary statistics
Category ad valorem mean std. dev. obs. years
Personal income taxes x 0·57 ·129 285 1972–2002
Business taxes:
Business income taxes x 0·11 ·072 285 1972–2002
Capital tax x 0·00 ·002 285 1972–2002 Sales taxes 0·11 ·058 275 1972–2002 Excise taxes: Tobacco 0·05 ·028 285 1972–2002 Gasoline x 0·77 ·518 285 1972–2002 Diesel x 0·93 ·659 285 1972–2002 Race tracks x 0·10 ·055 284 1972–2002
Alcohol taxes and markups:
Alcohol total 0·19 ·075 110 1992–2002 Spirits 0·28 ·053 175 1972–1991 Wine 0·23 ·072 175 1972–1991 Beer 0·13 ·054 175 1972–1991 Forestry: value-added base x 0·22 ·149 159 1972–1991 volume base 0·16 ·317 90 1992–2002 Oil royalties: New/NORP oil x 0·11 ·067 99 1982–2002 Old oil x 0·18 ·152 153 1972–2002 Heavy oil x 0·12 ·065 41 1982–2002 Mined oil x 0·07 ·049 29 1972–2002
Other non-renewable resources:
Domestic natural gas 0·06 ·084 129 1972–2002
Crown leases x 0·30 ·282 82 1987–2002
Other oil & gas 0·03 ·041 130 1972–2002
Mining x 0·05 ·087 285 1972–2002
Other ad valorem taxes:
Insurance premiums x 0·03 ·014 285 1972–2002
Payroll taxes x 0·01 ·011 207 1972–2002
Property taxes x 0·02 ·012 285 1972–2002
Lottery revenues x 0·00 ·001 285 1972–2002
References
Baretti, Christian, Bernd Huber, and Karl Lichtblau (2001) ‘A tax on tax revenue: The incentive effects of equalizing transfers: Evidence from Germany.’ International Tax and Public Finance
9, 631–649
Bird, Richard, and Michael Smart (2002) ‘Intergovernmental fiscal transfers: International lessons for developing countries.’World Development30, 899–912
Boadway, Robin, and Masayoshi Hayashi (2001) ‘An empirical analysis of intergovernmental tax in-teraction: The case of business income taxes in Canada.’Canadian Journal of Economics34, 481– 503
Boadway, Robin W., and Frank R. Flatters (1982) ‘Efficiency and equalization payments in a fed-eral system of government: A synthesis and extension of recent results.’ Canadian Journal of Economics15, 613–633
Bucovetsky, Sam, and Michael Smart (2006) ‘The efficiency consequences of local revenue equal-ization: Tax competition and tax distortions.’Journal of Public Economic Theory8, 119–144 Buettner, Thiess (2005) ‘The incentive effect of fiscal equalization transfers on tax policy.’Journal
of Public Economics90, 477–497
Card, David, and Abigail Payne (2002) ‘School finance reform, the distribution of school spending, and the distribution of student test scores.’Journal of Public Economics83, 49–82
Courchene, Thomas J. (1984) Equalization Payments: Past, Present and Future (Toronto: Ontario Economic Council)
Dahlby, Bev, and Neil Warren (2003) ‘Fiscal incentive effects of the Australian equalization system.’
Economic Record79, 434–445
Egger, Peter, Marko Koethenbuerger, and Michael Smart (2006) ‘Do fiscal transfers alleviate busi-ness tax competition? evidence from Germany.’ Working Paper, University of Munich
Esteller More, Alex, and Albert Sole Olle (2002) ‘An empirical analysis of vertical tax externalities: The case of personal income taxation in Canada.’International Tax and Public Finance9, 235–257 Gruber, Jonathan (1994) ‘The incidence of mandated maternity benefits.’American Economic Review
84, 622–641
Knight, Brian (2002) ‘Endogenous federal grants and crowd-out of state government spending: Theory and evidence from the federal highway aid program.’American Economic Review92, 71– 92
K¨othenb¨urger, Marko (2002) ‘Tax competition and fiscal equalization.’International Tax and Public Finance9, 391–408
Smart, Michael (1998) ‘Taxation and deadweight loss in a system of intergovernmental transfers.’