A Novel Fuzzy
c
-Means Clustering Algorithm Using Adaptive
Norm
Yunlong Gao1• Dexin Wang1•Jinyan Pan2•Zhihao Wang1•Baihua Chen1
Received: 14 January 2019 / Revised: 3 August 2019 / Accepted: 12 September 2019 / Published online: 22 October 2019 Taiwan Fuzzy Systems Association 2019
Abstract The fuzzy c-means (FCM) clustering algorithm is an unsupervised learning method that has been widely applied to cluster unlabeled data automatically instead of artificially, but is sensitive to noisy observations due to its inappropriate treatment of noise in the data. In this paper, a novel method considering noise intelligently based on the existing FCM approach, called adaptive-FCM and its extended version (adaptive-REFCM) in combination with relative entropy, are proposed. Adaptive-FCM, relying on an inventive integration of the adaptive norm, benefits from a robust overall structure. Adaptive-REFCM further inte-grates the properties of the relative entropy and normalized distance to preserve the global details of the dataset. Sev-eral experiments are carried out, including noisy or noise-free University of California Irvine (UCI) clustering and image segmentation experiments. The results show that adaptive-REFCM exhibits better noise robustness and adaptive adjustment in comparison with relevant state-of-the-art FCM methods.
Keywords Fuzzyc-means clusteringAdaptive norm
Noise robustnessRelative entropy
1 Introduction
Clustering is a significant and promising method to uncover the structure of a given dataset by pattern recog-nition. To capture the overall structure of the data, specific hypotheses including linear and nonlinear embedding constraints have been suggested, such ask-means [1], fuzzy logic [2,3], etc.
Hard clustering techniques, such ask-means, stick to the rigid principle that an observation strictly belongs to one specific cluster, which means that an observation will not interact with other clusters at all. As a result, the potential distribution of a dataset is not well reflected by such hard clustering methods. Later, Zadeh pioneered the concept of fuzzy sets, with a tangible definition [4], to interpret the potential distribution. Further clustering methods inspired by fuzzy logic have been presented, including the class of isodata clustering algorithms which can effectively detect
compact structures [5] and for unsupervised clustering of
datasets into a given number of classes [2]. Among
clus-tering algorithms, fuzzy clusclus-tering techniques have
bene-fited from successive extensions [6–9] and have been
widely used, e.g., for cloud intrusion detection [10], color
image segmentation [11], brain segmentation enhancement
[12], etc.
Inspired by such fuzzy logic and hard clustering meth-ods, the FCM approach considers the relative relationship between all the observations in order to make fuzzier judgements. The FCM approach allows an observation to belong to different clusters, offering greater flexibility to handle the uncertainties found in real-word datasets. Specifically, the FCM approach provides a reasonable representation of clustering probabilities, known as the ‘‘membership degree.’’ In comparison with hard clustering algorithms, the FCM approach removes the ‘‘all or none’’
& Jinyan Pan [email protected]
1 Department of Automation, Xiamen University, Xiamen, China
2 College of Information Engineer, Jimei University, Xiamen, China
restriction, making the boundaries much fuzzier, which is more in line with real-world situations and facilitates out-lier detection. Researchers have advanced the study of FCM and related approaches in recent decades using approaches such as kernel fuzzy clustering, algorithms based of weighted methods [e.g., new weighted fuzzy
c-means (NWFCM) [13] and fuzzy clustering with the
entropy of attribute weights (EWFCM) [14]], sparse
rep-resentation-based methods [e.g., fuzzy double c-means
(FDCM-SSR) [6]], etc.
Although the FCM approach has been refined in many ways, data processing remains a thorny issue. To the best of the authors’ knowledge, noise can vary between differ-ent evdiffer-ents. For clustering tasks, how to define noise and how to avoid the impact of noise are two tough problems, and increased noise can make the prediction process dif-ficult. Therefore, the subject of noise rejection is still of great importance.
To further improve the robustness of such methods to noise, great efforts have been made by researchers from many directions; For instance, spectral subtraction can extract the interesting features of the implied error resulting from noise estimation in the power-spectral domain. However, in FCM, noise is treated in an intuitive way. In ordinary fuzzy logic, a point is identified as noise with an extremely low membership degree. However, this approach does not offer perfect noise robustness, so different forms of regularization have been adopted to improve this aspect of its performance. This problem is discussed below based on various approaches to noise robustness, after the dis-cussion of the following two essential questions:
• There is no reasonable standard for the evaluation of
noise, so how can one define noise universally?
• How can one address noise compatibly when applying
the FCM approach?
In fact, noise is indeed undefinable in real-world data-sets because noise can behave in different ways, resulting in unmeasurable uncertainty. Mathematically, of all types of noise, the outlier is the most typical and definable form. Outliers generally have abnormal features in contrast to some cluster and fall into the category that one would like to describe asUNCLASSIFIABLE [3]. Practically speaking, to
obviate the undesirable effects of such outliers, outlier detection methods are applied to try to reveal their con-trasting features based on statistical methods [15].
Various methods have been applied in this regard for FCM in recent years. To eliminate noisy features in
high-dimensional data, Chang et al. proposed L1=2-CM, which
introduces Lq-norm ð0\q1Þ sparse regularization into
FCM to shrink the weights of irrelevant features in an
analytic form whenq=1/2, although its performance may
be limited by the fact that such sparse feature selection cannot deal with outliers that are hidden in relevant
fea-tures [16]. Brayda addressed this problem from the
stand-point of the sensitivity to noise estimation errors and proposed the TeFCM (L2)L2R and TeFCM (L2)L1R based
on the use of tolerance vectors [17,18], although how to determine suitable parameters for the upper bound of the tolerance vectors and regularization parameters remains a
problem [17]. To deal with the uncertainty of fuzzy
coef-ficients and limit the impact of outliers, the setting of empirical intervals to design and manage the uncertainty of fuzzy coefficients is another idea. Rubio et al. combined a pattern set with interval type-2 fuzzy sets using more than one fuzzification to handle uncertainty and susceptibility to noise [19], with applications such as website hotel selection
[20]. To reduce the computational complexity of this
approach, all the secondary memberships are weighted uniformly for each primary membership, hence limiting its generalizability. To improve the performance of interval
type-2 FCM, Minh et al. applied multiple kernels [21],
although this requires the introduction of more fuzzifica-tions, which greatly increases the parameter complexity. Instead of assigning a single possible interval to each ele-ment in a given reference set, with detailed analysis of fuzzy multisets [22] and intuitionistic fuzzy sets [23], the concept of hesitant fuzzy sets based on the application of a set of membership functions to each element to deal with uncertainty has also been introduced [24–26].
To avoid high computational complexity, we add rele-vant regularization to remove as much uncertainty as possible. We take the noise robustness and retention capacity of fuzzy clustering as the starting point and attempt to disperse the impact of outliers within the overall range. Besides, it is vital to promote the divisibility between different clusters as well as the similarity within each cluster.
To achieve this goal, the distance from an observation to a cluster, denoted askdk, could be a good criterion to judge the reliability of an observation. The less reliable the observation, the more serious the penalty it produces. In other words, the penalty guides how the loss function behaves. Besides, the loss caused by unreliable observa-tions should not be so severe that the the impact of noise is overemphasize and unstable clustering results are induced. It is well validated that norm normalization techniques can efficiently inhibit the undesirable impact of noisy data [16,27,28]. Applying norm regularization with respect to
kdk in FCM helps a lot to control the overall effect in
theory [6,16,17].
Ding [29] and Nie [30] proposed the adaptive-loss
concept, which serves as an assembling type of norm regularization as an adaptive embedding for
interpolates betweenL1 andL2 error functions, consistent
with the expected effects of unsupervised fuzzy clustering tasks. To advance such research, the application of adap-tive loss in unsupervised cluster algorithms represents a great innovation. Stimulated by Ding’s and Nie’s work, we first study the adaptive loss function in fuzzy clustering algorithms in this paper. Note that the outlier sensitivity of FCM originates from the fact that constrained
member-ships cannot distinguish between EQUAL EVIDENCE and
IG-NORANCE when two points are quite far away from the
centroid of a cluster, resulting in heavy tails on the
mem-bership assignment [31]. Based on this observation, we
explore a membership-assignment-based strategy, which differs from previous distance-based ones, with the aid of an adaptive norm.
In terms of fuzzy logic, a troublesome obstacle to the
application of the adaptive norm is that theL2-norm and
L1-norm restrain the fuzzy level of FCM, hence limiting its
clustering performance. Taking the adaptive norm as a prototype, we extend it to a general norm called the adaptiveL1;m-norm to fit FCM. The adaptive L1;m-norm is
expressed as kuk1;m¼ Xn i¼1 ð1þdÞjuijm dþ juijm1 ; ð1Þ
whereudenotes the membership degree of a point anddis
a positive coefficient controlling the adjustment of theLm
-norm and L1-norm. We bridge the L1;m-norm over the
standard FCM objective function, resulting in a novel model called adaptive-FCM, with the aim of achieving
noise robustness, divisibility, and similarity. Sects. 2.2
and5 analyze the characteristics of adaptive-FCM and
different types of norm regularization.
In addition, entropy information contained in the data should be fully utilized to achieve noise robustness. Researchers have used the maximum-entropy model as a regularization to make the clusters much fuzzier or more dissimilar via its maximizing strategy [14, 32]. Li et al. proposed a maximum approach to fuzzy clustering, and Zhou et al. proposed fuzzy clustering with the entropy of attribute weights (EWFCM) by combining
attribute-weighted information with the theory of entropy [14].
EWFCM provides a good criterion for attribute weight assignment and works well for nonspherically shaped clusters. Zarinbal et al. introduced the distribution metric characteristic of relative entropy, the general case of entropy, into FCM (REFCM) to measure the distance
between two distributions [32]. This combination combines
the objective loss with a Gaussian distribution, making FCM more robust to noise to some degree.
Recall that, for real-world datasets, erratic noise occurs by chance in any distribution. However, in addition to the
problem of how to treat noise compatibly, another issue is the treatment of the imbalance which exists between dif-ferent dimensions. To deal with high-dimensional datasets, Donald et al. embedded a fuzzy covariance matrix as a nature metric into the FCM model and obtained more accurate clustering [33].
Ultimately, inspired by recent entropy-based FCM methods, we further include the relative entropy function and propose a novel FCM model (adaptive-REFCM) to address these problems and capture the overall structure of the dataset.
In summary, the contributions of this paper are threefold:
• To study the use of the adaptive-loss function in the
FCM domain to achieve superior noise robustness.
• To provide a membership-assignment-based viewpoint
to address the impact of outliers in FCM, in contrast to traditional distance-based approaches.
• To propose two complete FCM-based models
(adap-tive-FCM and its extension adaptive-REFCM) to handle noisy and dimensionally imbalanced situations, which outperform related state-of-the-art FCM methods according to experiments on real-world (noise-free or noisy UCI repository and image segmentation) and artificial datasets.
2 Related Work
Definition Given fx1;x2;. . .;xng as n unsupervised data
points of the same dimensionality, denote the data matrix as X¼fx1;x2;. . .;xng;X2Rsn, where s is the
dimen-sionality. Define cas the expected number of clusters and
C¼fv1;v2;. . .;vcg as the vectors of all the clusters.
2.1 FCM
In fuzzy c-means clustering algorithms, m is defined and
given as the fuzzy coefficient. The goal is to achieve the best assignment for uij 8i;j. The Euclidean distance from
the jth observation to the centroid of the ith cluster is
defined as dij¼ kxjvik2;1. The whole loss function is
defined as arg min u;d Jðu;dÞ ¼arg min u;d Pn j¼1 Pc i¼1 um ijd 2 ij s:t:P c i¼1 uij¼1;0uij1: 8 > > > < > > > : ð2Þ
Applying the Lagrange multiplier method to complete the whole iterative optimization computation with respect to uij, the optimization can be expressed as
uij¼ Xc k¼1 dij2 d2 kj ! 1 m1 0 @ 1 A 0 @ 1 A 1 i¼1;2. . .c;j¼1;2. . .n: 8 > > > < > > > : ð3Þ
Asmincreases, all theuijtend to become closer, making
the assignment fuzzier, which increases the impact on the whole dataset and individual observations. In comparison with hard clustering algorithms, such fuzzy assignment extracts the information about clusters more reasonably, because the interaction among the observations is taken into consideration.
It is natural to identify points with extremely low membership degree as noise. However, this definition ofuij
suffers from the disadvantage that one cannot automati-cally assign observations with quite low membership degree to noise, resulting in serious noise sensitivity.
2.2 Norm Regularization
To handle outliers in optimization problems, norm
regu-larization techniques such as the well-known Lq-norm
family mainly concentrate on the reasonable applications of distance-based loss function strategies.
Typically,kdk2(L2-norm) andkdk1(L1-norm) are taken
as the two major forms for such regularization methods,
among the Lq-norm family. From the perspective of
numerical analysis,kdknðn[1Þis smaller thankdk1when
0\d\1, and kdk1 grows more slowly than kdkn (n[1) whend[1. In comparison withkdk2, the use ofkdk1as a penalty softens the treatment of unreliable observations but penalizes reliable ones too much. In conclusion, use of
kdk2 results in central representations while use of kdk1
aids regularization to achieve noise robustness.
Moreover, the L1-norm has also been proven to be
effective for variable selection. The least absolute
shrink-age and selection operator (LASSO) method uses theL1
-norm penalty function, viz.kxk1 ¼
Pn
i¼1ðjxijÞ, to achieve
complete variable selection while also reducing the
com-putational complexity [34]. However, in the case of
vari-ables that are highly correlated or when pn, LASSO
tends to select parts of the variables while ignoring others because it is not strictly convex and does not have a unique solution [35]. The use of an elastic net [35] overcomes the
overfitting problem of LASSO by bridging the L2-norm
penalty function into the estimation ofb^, which is defined as b^¼arg minbðkYXbk2þk1kbk1þk2kbk2Þ. By
adjustingk1 andk2 separately, the elastic net controls the
behavior of the L2-norm and L1-norm to achieve the
desired benefits of group effects and noise robustness.
For noise rejection, the above-mentioned regularization theories can be introduced into the knowledge system of FCM; For instance,L1-norm regularization provides a rigid
constraint on the positive membership degree, resulting in sparse assignments during the iterations of the optimiza-tion. This operation extracts the principal characters adaptively. In comparison with theL1-norm, application of
the L2-norm for regularization in FCM promotes the
compactness within each class but does not favor the divisibility between different classes. Nie et al. studied an adaptive norm as an elastic embedding constraint for linear
models, ultimately simplifying the adjustment of the L2
-norm andL1-norm functions [30] to enhance the robustness
of noise during semisupervised learning.
The adaptive loss function, first studied by Ding [29],
serves as an assembling type of regularization which
smoothly interpolates between the L1 and L2 error
functions.
From the perspective of optimization, we extend the adaptive norm to fit the FCM approach and design
adap-tive-FCM as shown in Eq.4 to serve as a fuzzy clustering
model that combines theL1-normðkxk1¼ P ij jÞxi and the Lm-normðkxkm¼ P ij jximÞ. arg min u;d Jðu;dÞ ¼arg min u;d Xn j¼1 Xc i¼1 ð1þdÞum ij uijm1þd dij2 s.t. X c i¼1 uij¼1; 0uij1;d[0: 8 > > > > < > > > > : ð4Þ
In Sect. 5, we discuss and compare the properties of the
original adaptive-norm and the proposed adaptive-FCM in detail.
2.3 Relative Entropy
The relative entropy, also called the Kullback–Leibler (KL) divergence, of two distributions Q and P is defined as
DKLðQkPÞ ¼
Xc
i¼1
lnQðiÞ PðiÞ;
which has the nonnegative property that DKLðQkPÞ 0,
while DKLðQkPÞequals zero if and only if8i;PðiÞ ¼QðiÞ.
These properties of cooperation and nonnegativity make it suitable for convex optimization.
Considering relative entropy as the general case of entropy that measures the distance between two distribu-tions, it can be applied for noise robustness in both hard and soft clustering.
REFCM adds the relative entropy to the objective function of FCM by considering the degree of fuzziness
[32]. The objective function of REFCM can be expressed
arg min u;d Jðu;dÞ ¼arg min u;d Xn j¼1 Xc i¼1 umijdij2 bX n j¼1 Xc i¼1 Xc k¼1;k6¼i uijln uij ukj s:t:X c i¼1 uij¼1; 0uij1; 8 > > > > > > > > > > > < > > > > > > > > > > > : ð5Þ
wherebis the tradeoff coefficient to adjust the impact of
the relative entropy term. Based on the summation of the relative entropy of uij and ukj ðk6¼iÞ, REFCM achieves
discriminable assignment to the membership degrees, thereby maximizing the dissimilarity between clusters and more effectively detecting true negative data points to improve the robustness to noise. However, REFCM does not handle dimension normalization and thus is not suit-able for nonspherical datasets.
2.4 Dimension Normalization
In practical applications such as geographic information integration or text classification, some elements always behave according to Gaussian distributions with different variances. It is thus advisable to normalize the feature dimensions. EWFCM applies different weights to each dimension in order to achieve the desired improvement
[14]. Later, the Mahalanobis distance was introduced into
FCM for dimensional regularization. In terms of statistical analysis, the Mahalanobis distance is used to establish a unified measurement standard for each feature dimension and to achieve better adjustment for existing membership estimation. Liu et al. improved FCM by using the standard
Mahalanobis distance [36]. The Mahalanobis distance has
been proved to be effective for complex clustering tasks. Zhao et al. introduced the Mahalanobis distance based on a
fuzzy clustering algorithm for image segmentation [37].
In this paper, we apply the normalized negative expo-nential of the Mahalanobis distance as a form for the membership possibility. We then apply this possibility for the relative entropy regularization in combination with the membership degrees of the observations.
In this paper, the Mahalanobis distance in the dataset is
defined as DM¼ðXCÞ
T RX
1ðXCÞ, where C and
Xare defined as
Definition Under this full-rank linear transformation of the data space, hidden information is fully preserved.
In summary, adaptive-REFCM introduces the adaptive norm, relative entropy regularization, and Gaussian coop-eration with the Mahalanobis distance into FCM. A com-plete analysis of the modeling process is presented in Sect.5.
3 Algorithm Process
Adaptive-REFCM is designed based on standard FCM. The viable objective function of this model is defined as
arg minu;dJðu;dÞ ¼ arg minu;d
Pn j¼1 Pc i¼1 ð1þdÞumij uijm1þd dij2 þbPnj¼1Pci¼1uijln uij cij s:t:Pci¼1uij¼1; 0uij1;d;b[0; 8 > > > > > < > > > > > : ð6Þ which satisfies cij¼ expðxjCjÞTRi1ðxjCiÞ Pc k¼1expðxjCkÞ T Rk1ðxjCkÞ Ri¼ 1 n Xn j¼1 pijðxiCjÞTðxiCjÞ pij¼ um ij Pn k¼1ukjm ; 8 > > > > > > > > > > < > > > > > > > > > > : ð7Þ
wheredij denotes the distance from the jth observation to
the centroid of the ith cluster,uij denotes the membership
degree of the jth datum with respect to the ith cluster, cij
denotes the prior approximate evaluation ofuij, anddandb
are positive coefficients for the adaptive norm and relative entropy terms, respectively.
The algorithm is completed via the following steps: Step 1: Simplify the model
We discuss the adaptive norm term separately. The objective function can be modified to
oJ uð ;dÞ ouij ¼f0ð Þu þ2ð1þdÞ mdþgijðuÞ 2ðgijðuÞ þdÞ2 dij2gijð Þu g0ijð Þu ; ð8Þ
wheref uð Þis the relative entropy term. To minimize Eq.8
w.r.t.uij, let gijð Þ ¼u umij1 gij0ð Þ ¼u ðm1Þumij2 Mij¼ð1þdÞ mdþgijð Þu gijð Þ þu d 2: 8 > > > > < > > > > : ð9Þ Equation8 is equivalent to oJ uð ;dÞ ouij ¼f0ð Þ þu Mijdij2gijð Þu g0ijð Þ ¼u 0; ð10Þ
Mij is considered as a variable uncorrelated withuij. This
Thus, the optimization of the model is simplified to the solution of Eq.11. min u f uð Þ þ 1 2 Xn j¼1 Xc i¼1 Mijgijð Þu 2dij2: ð11Þ
Step 2: Apply the Lagrangian multiplier method Following step 1, kj¼1;2;3;. . .;N, the following
function is minimized by the application of Lagrangian multipliers: J uð ;k;dÞ ¼min u b Xn j¼1 Xc i¼1 uij lnuijlncij þ1 2 Xn j¼1 Xc i¼1 Mijgijð Þu 2 dij2 X n j¼1 kj Xc i¼1 uij1 ! ð12Þ
Minimization of Eq.11 w.r.t. uij while satisfying Eq.10
yields b lnuijlncijþ1 kj¼ Mijd2iju 2m3 ij ðm1Þ: ð13Þ
Both sides of the equation are multiplied by2mbþ3to give
2mþ3 ð Þ lnuijlncijþ1 kj b ¼ð2m3Þðm1Þ b Mijd 2 iju 2m3 ij : ð14Þ
In Sect.4, it is proved that the solutionuijof Eq.14is the
optimum solution of Eq.11.
Step 3: Determineuij
Letting Yij¼ lnuij and uij¼eðYijÞ, Eq.14 can be
converted to 2m3 ð Þ Yijþlncij1 þkj b ¼ð2m3Þðm1Þ b Mijd 2 ije ð2m3ÞYij: ð15Þ Let C¼ð2m3Þ Yijþlncij1 þkj b D¼ð2m3Þðm1Þ b Mijd 2 ije ð2m3ÞYij E¼DeC 8 > > > > > < > > > > > : ð16Þ
Then, based on the computation method of the LambertW
function, we get E¼ð2m3Þðm1Þ b Mijd 2 ije 2m3 ð Þlncij1þ ki b ½ : ð17Þ
Note thatceC¼E is expressed as a transcendental
equa-tion, viz. the LambertWfunction, which is also called the
omega function, suggested to calculate the solution C¼
W0ð ÞE [38]. With the aid of the auxiliary function, Yijcan
be determined. Yij¼ 1 2m3W0ð Þ þE 1lncij kj b; ð18Þ then uij¼eYij¼e2m31 W0ðEÞþ1lncij kj b E¼ð2m3Þðm1Þð1þdÞ mdþgijð Þu 2bgijð Þþu d2 d 2 ije 2m3 ð Þ lncij1þ kj b 8 > > < > > : ð19Þ Step 4: Determinekj
Because of the complex form ofkj, it is hard to obtain an
analytical solution kj. However, this situation can be
han-dled by supposing a range forkj. According to the equation
uij¼eYij ¼e 1 2m3W0ð ÞEe1þlncijþ kj b, we get W0ð ÞE uij e1þlncijþ ki b !ð2m3Þ ¼W0ð ÞE eW0ð ÞE; W0ð ÞE eW0ð ÞE ¼E: 8 > > < > > : ð20Þ E¼ð2m3Þðm1Þð1þdÞ mdþgijð Þu 2b gijð Þþu d 2 d 2 ije 2m3 ð Þ lncij1þ kj b uij¼ E e1þlncijþ kj b ð2m3Þ W0ð ÞE 0 B B B @ 1 C C C A 1 2m3 8 > > > > > > > > > < > > > > > > > > > : ð21Þ
It is obvious thatE0 whenm1. Thus, we explore how
to determinekjto allowuijto satisfy 0uij1 as follows:
• According to the mapping relationship in Eq.20, it is
inevitable that Eq.22makes sense.
sgnð Þ ¼E sgnðW0ð ÞE Þ ð22Þ
Furthermore,uij satisfies Eq.23,
sgn e1þlncijþ
kj b
ð2m3Þ!
¼1; ð23Þ
so uij is positive anduij0 is a necessary inequality,
which proves the first condition ofuij0.
• We now explore the other condition, viz.uij1, which
E e1þlncijþ kj b ð2m3Þ W0ð ÞE 0 B B B @ 1 C C C A 1 2m3 1 ð24Þ
Applying simple operations, Eq. 24is equivalent to
kjb 1 2m3ln W0ð ÞE E þ1lncij ð25Þ
Finally, the upper bound on kj is determined as
kjb
1
2m3W0ð Þ þE 1lncij
: ð26Þ
In conclusion, the range ofkj is determined to beð1;
bð 1
2m3W0ðEÞ þ1lncijÞ.
Step 5: Update the centers of the clusters dij¼xjci oJ uð ;dÞ oci ¼0 8 > > < > > : ð27Þ
Theith center is updated using Eq.28,
ci¼ Pn j¼0 dþ1 ð Þþum1 ij dþum1 ij xj Pn k¼0 dþ1 ð Þþum1 ik dþum1 ik : ð28Þ
4 Convergence and Constancy
Proof The solutionuij of Eq.14is the optimum solution
of Eq.11.
• Compute the Hessian matrix ofJ uð ;dÞas
o2J uð ;dÞ ou2 ij ¼ b uij þðm1Þð2m3ÞMijd2iju 2m4 ij : BecauseMij¼ð1þdÞ mdþgijð Þu gijð Þþu d
ð Þ2[0, all the elements
of o2J uoðu2;dÞ ij
satisfy o2J uoðu2;dÞ ij
[0.
• Compute the first-order derivative ofJ uð ;dÞas
oJ uð ;dÞ ouij ¼b lnuijlncijþ1 þMijdij2u 2m3 ij ðm1Þ kj: ð29Þ oJ uð;dÞ
ouij is a monotonically increasing function of uij and
o2J uð;dÞ
ou2 ij
[0, which proves the theorem. h
5 Analysis of the Algorithm
To solve the clustering task properly with multiclass
datasets, adaptive-REFCM effectively integrates the
adaptive norm, relative entropy term, and Gaussian mixture model (GMM), which cooperate with each other in this method. Great performance is achieved in experiments. In this section, three main properties of adaptive-REFCM are analyzed.
5.1 Property I: Noise Robustness
The adaptive loss-minimizing method [30] relaxes the rigid linear model constraint by applying an elastic constraint, such that the data structure can be better explored. The original adaptive norm can be expressed in vector form as
shown in Eq. 30 or in matrix form as shown in Eq.31,
wherexidenotes theith vector of matrixX:
xd ¼ X i dþ1 ð Þx2 i dþj jxi ; ð30Þ Xd¼ X i dþ1 ð Þxi2 2 dþxi 2 : ð31Þ
Nie [30] pointed out that the adaptive norm is an
inte-gration of the L1-norm and L2-norm with the adaptive
coefficient d. In Fig.1, the abscissa represents the
Eucli-dean distancedijbetween a random point and the center of
a cluster while the ordinate represents the value that the
loss function gains. In comparison with the L1-norm and
L2-norm, Fig. 1 shows the results for the adaptive norm
obtained from theL1-norm andL2-norm based on the value
of d, here set to 0.01, 0.1, or 1, to reveal its behavior. The core of the design for the clustering loss function is to set a proper standard for the evaluation of observations in the dataset. Generally speaking, it is more reasonably that those points which are closely gathered into a compact structure belong to the same cluster. To follow this core concept of clustering, an increase in the absolute value of dijði¼1;2;. . .;c;j¼1;2;. . .;nÞ indicates that the point
will make a larger contribution to the total loss. On the other hand, qualitatively speaking, a point that deviates a lot from the centroids of all the clusters is more likely to be considered as noise. From this perspective, one tends to allocate a relatively smaller cost for small dij values but
larger values for largedij.
However, this is accompanied by another problem, i.e., that outliers produce too high a cost, seriously affecting the retention of the potential structure of the data when extracted by the clustering process. Thus, it is advisable to adjust the cost into a reliable range for large dij values, to
Use of the L1-norm as the loss function offers the
advantage of weakening the effect of noise, but is less favorable for cluster concentration compared with use of
the L2-norm. Nevertheless, using the squared L2-norm as
the loss function can preserve the local structure but is sensitive to outliers.
Therefore, the adaptive norm based on a mixture of the L1-norm with theL2-norm is a compromise to increase the
degree of compactness by adjusting the cost function of smallerdijvalues to approach theL2-norm while increasing
the robustness to noise by decreasing the cost of higherdij
values to approach theL1-norm, as shown in Fig.1.
Inspired by this adaptive norm, we extend it to Eq.1and
propose the adaptive-FCM shown in Eq. 32 (m=2) by
adopting the adaptive norm with the cost of membership assignment. Note thatuijanddij are negatively correlated,
so the effects of theL2-norm andL1-norm in the FCM are
opposite. min J uð ;dÞ ¼minX n j¼1 Xc i¼1 1þd ð Þjuijjm juijj m1 þd d 2 ij ð32Þ
Consider the situation of c¼2. Limited by the rigid
constraint Pci¼1uij¼1;0uij1, in case the jth
obser-vation is likely to be outlier, one of the two membership
degrees of thejth observation tends to drop from 1 while
the other tends to be quite small and increase from 0 (Fig.2). However, it is suggested that uijði ¼ 1;2Þ be
allocated more uniformly for a outlier, so as to decentralize the impact of noise on all the clusters and reduce the loss.
From this point of view, standard FCM (Eq.2) allocates
more uniformly for a outlier with largerm, leading to the
fact that theL2-norm offers better noise robustness than the
L1-norm. Moreover, theL2-norm simultaneously makes the
margin between clusters softer compared with theL1-norm,
providing greater potential for partition between clusters. On the other hand, adding theL1-norm touijtends to make
the judgement explicit for observations quite close to the centroid of some cluster, resulting in better condensation within clusters.
However, a problem occurs in that FCM combined with the original adaptive norm loss suffers from an inherent limitation in the regulation of the fuzzy level, because the
integration of the L1-norm and L2-norm limits the fuzzy
ability fromk-means to standard FCM. To confirm this, we
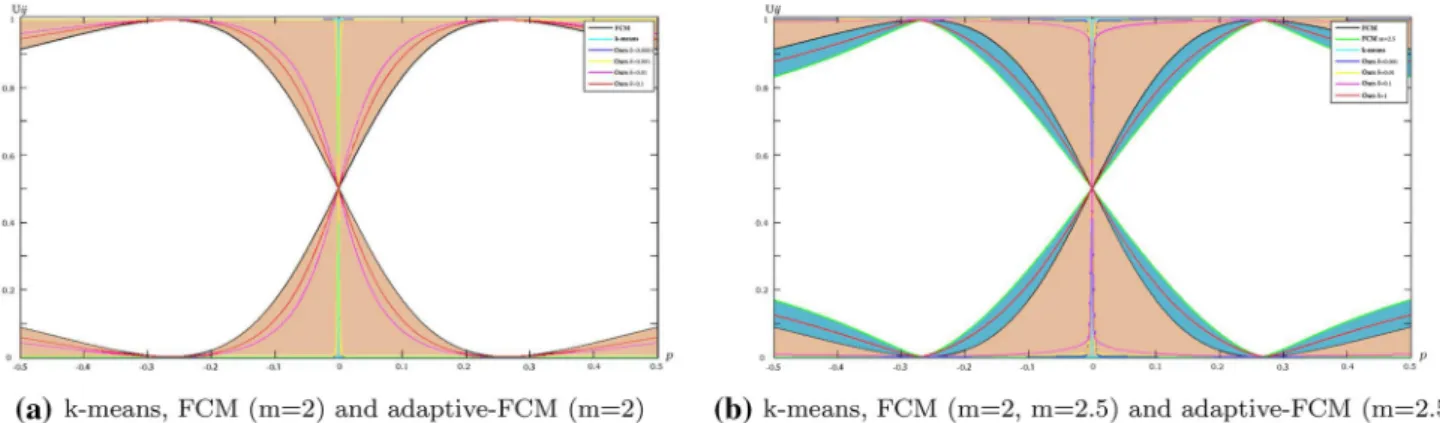
consider a dataset with a uniform distribution and cluster into two subclusters using FCM and adaptive-FCM (Eq. 32) with different values ofd. The curves representing the membership degrees in the different situations are shown in Fig. 2to prove this inference. The ordinate refers to the value of the membership degreeu, while the abscissa shows the absolute one-dimensional position of an obser-vation. For a fuzzier result, the curve tends to be closer to
the middle horizontal line in Fig.2a. It can also be seen
from Fig.2a that the curves of the original adaptive-FCM
with different values ofdalways lie between those of FCM
andk-means (dark-red-shaded region in Fig.2a) and
can-not get fuzzier than the results of FCM.
To achieve better robustness to outliers in FCM, one approach is to blur the impact of outliers by making their
membership fuzzier than FCM. A larger value ofmassigns
fuzzier membership in FCM, at the cost of reduced com-pactness within clusters, which may result in unexpected uncertainty. Pal concluded based on cluster validity that the best interval formis [1.5, 2.5] [39]. Bezdek concluded that,
when m=2, the most meaningful partition can be
obtained by FCM [40]. Therefore, simply increasing the
value ofmis not a compatible strategy. Alternative ways to handle this situation include interpolative selecting of dif-ferent values ofm(e.g., interval-FCM [21]) or to retain the
compactness of the L1-norm in adaptive-FCM and expand
the properties of the Lm-norm (m ¼ 2) by using a larger
value ofm.
To achieve flexibility in the regulation of the fuzzy level to work better with noisy datasets, we further expand its
form into a novel form by combining theL1-norm with the
Lm-normðm[2Þas shown in Eq.4. Use of a larger value
for the fuzzy coefficient m enables fuzzier performance.
According to Pal’s range for m, we choose m=2.5 for
adaptive-FCM. Taking Fig. 2a as a reference, it can be seen Fig. 1 Loss ofL1-norm,L2-norm, and adaptive norm withd¼0:01;0:1;1
from Fig.2b that, in comparison with adaptive-FCM
(m=2), adaptive-FCM (m=2.5) further expands the
domain ofUij(dark-blue-shaded region) w.r.t. the value of
d.
Figure3 shows the clustering results of FCM (m=2)
and adaptive-FCM (m=2.5, d=1), confirming the
effectiveness of adaptive-REFCM in terms of the mem-bership degrees. Definepas the position of an observation.
As shown in Fig.3, the p of the two cluster centroids is
-0.25 and 0.25. In comparison with FCM, adaptive-FCM
keepsuexplicit (close to 1 or 0) whenpis close to-0.25 or 0.25, much fuzzier (closer to 0.5) whenpis close to the
edges (p ¼ 0:5 and p ¼ 0:5), and much fuzzier when
p ranges from -0.2 to 0.2 (the margin that is fuzzy for
clustering). Obviously, the expected performance in terms of noise robustness is achieved.
Summing up the results described above, the adaptive loss minimization method extracts a holistic representation of the whole dataset while showing robustness to noise.
5.2 Property II: Global Adaptive Adjustment
In this section, we focus on the global adaptive adjustment of the algorithm and explore the effect of the relative
entropy. Firstly, recall the relative entropy (RE) from Eq. 6: REpart¼min u Xn j¼1 Xc i¼1 uij lnuijlncij : ð33Þ
In our method, we combine GMM in the RE for the reason that datasets behave differently in different situations and an underlying mechanism associated with such a mixture model is observable in fields such as documents, hand-writing recognition, iris datasets, etc. In the RE,cijdenotes
the probabilistic presence of subpopulations within the overall population to correspond to the distribution of the clusters. The concept of membership degree is similar to the probability of a subpopulation, thus GMM provides prior knowledge for the learning of degrees of belonging in
our clustering method. To minimize the RE ideally,uijand
cij must satisfy uij¼cij 8i;j, which indicates that cij
expresses the prior presence of all the subpopulations.
5.3 Property III: Dimensional-Wise Normalization As mentioned in GMM, the Mahalanobis distances of all the observations to all the centroids of the clusters are calculated. The Mahalanobis distance uses the covariance matrix of Euclidean distances of observations to clusters in order to normalize high-dimensional data to a specific standardization in order to eliminate the side-effect of dimensional scale disunity, making the method more reli-able for calculating the imbalance between different observations and clustering high-dimensional data such as nonspherical, ellipsoidal, or speech recognition datasets.
For standard FCM, the membership degree is obtained by Eq. 34, uij¼ Xc k¼1 d2ij=dkj2 1=ðm1Þ!1 ; ð34Þ
Fig. 2 Comparison of membership degrees ofk-means, FCM, and adaptive-FCM w.r.t.dandm
Fig. 3 Membership degrees of FCM and adaptive-FCM in terms of distances
wheredij2=d2kjis the decisive factor used to determineuij. As
a result, the fuzzy degree is not associated with the size of the different clusters. In Fig.4, we take the clustering of two clusters as an example to represent the shortcoming of FCM. The two thick black circles indicate the different distribution ranges of the two clusters, while the two inner blue circles filled with diagonal lines indicate the range where the membership degrees of the two clusters are more unambiguous than a given fuzzy threshold.
Figure4a shows that FCM results in two blue circles
with the same radius, while Fig.4b shows that
adaptive-REFCM results in two blue circles with different radii. In Fig.4b, the dark-grey part retains the blue region resulting
from FCM in Fig. 4a. For the same threshold a, a cluster
with larger variance results in a larger blue region for the
reason that the Gaussian collaborates with the
Maha-lanobis distance. This indicates that adaptive-REFCM is beneficial compared with FCM to tackle the problem of variance imbalance by assigning membership degrees in line with the variance of each cluster, making the model more general for fuzzy clustering tasks.
In summary, this section presents in-depth analysis of the three main properties of this model. Its experimental performance is reported in Sect.6.
6 Experimental Analyses
This section further evaluates the classification capability of the proposed methods on noise-free and noisy datasets and nonspherical datasets. In addition, several related state-Fig. 4 Comparison of fuzzy regions of FCM and adaptive-REFCM
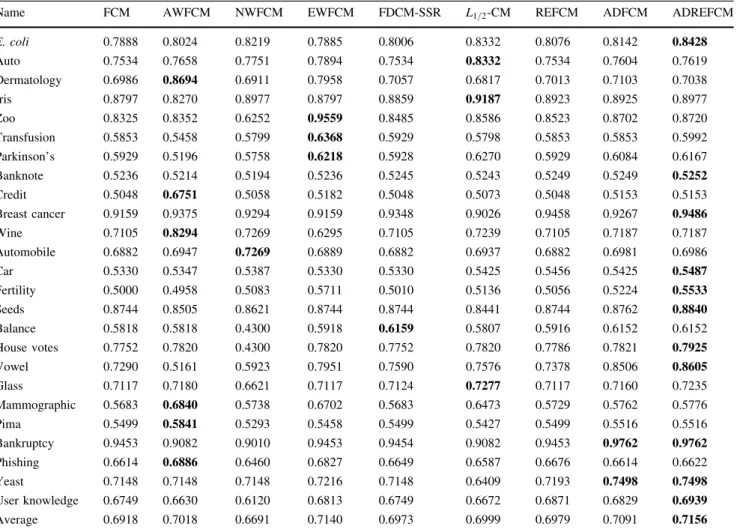
Table 1 Comparison of average accuracy in 100 trials over 25 datasets without extra outliers
Name FCM AWFCM NWFCM EWFCM FDCM-SSR L1=2-CM REFCM ADFCM ADREFCM
E. coli 0.7888 0.8024 0.8219 0.7885 0.8006 0.8332 0.8076 0.8142 0.8428 Auto 0.7534 0.7658 0.7751 0.7894 0.7534 0.8332 0.7534 0.7604 0.7619 Dermatology 0.6986 0.8694 0.6911 0.7958 0.7057 0.6817 0.7013 0.7103 0.7038 Iris 0.8797 0.8270 0.8977 0.8797 0.8859 0.9187 0.8923 0.8925 0.8977 Zoo 0.8325 0.8352 0.6252 0.9559 0.8485 0.8586 0.8523 0.8702 0.8720 Transfusion 0.5853 0.5458 0.5799 0.6368 0.5929 0.5798 0.5853 0.5853 0.5992 Parkinson’s 0.5929 0.5196 0.5758 0.6218 0.5928 0.6270 0.5929 0.6084 0.6167 Banknote 0.5236 0.5214 0.5194 0.5236 0.5245 0.5243 0.5249 0.5249 0.5252 Credit 0.5048 0.6751 0.5058 0.5182 0.5048 0.5073 0.5048 0.5153 0.5153 Breast cancer 0.9159 0.9375 0.9294 0.9159 0.9348 0.9026 0.9458 0.9267 0.9486 Wine 0.7105 0.8294 0.7269 0.6295 0.7105 0.7239 0.7105 0.7187 0.7187 Automobile 0.6882 0.6947 0.7269 0.6889 0.6882 0.6937 0.6882 0.6981 0.6986 Car 0.5330 0.5347 0.5387 0.5330 0.5330 0.5425 0.5456 0.5425 0.5487 Fertility 0.5000 0.4958 0.5083 0.5711 0.5010 0.5136 0.5056 0.5224 0.5533 Seeds 0.8744 0.8505 0.8621 0.8744 0.8744 0.8441 0.8744 0.8762 0.8840 Balance 0.5818 0.5818 0.4300 0.5918 0.6159 0.5807 0.5916 0.6152 0.6152 House votes 0.7752 0.7820 0.4300 0.7820 0.7752 0.7820 0.7786 0.7821 0.7925 Vowel 0.7290 0.5161 0.5923 0.7951 0.7590 0.7576 0.7378 0.8506 0.8605 Glass 0.7117 0.7180 0.6621 0.7117 0.7124 0.7277 0.7117 0.7160 0.7235 Mammographic 0.5683 0.6840 0.5738 0.6702 0.5683 0.6473 0.5729 0.5762 0.5776 Pima 0.5499 0.5841 0.5293 0.5458 0.5499 0.5427 0.5499 0.5516 0.5516 Bankruptcy 0.9453 0.9082 0.9010 0.9453 0.9454 0.9082 0.9453 0.9762 0.9762 Phishing 0.6614 0.6886 0.6460 0.6827 0.6649 0.6587 0.6676 0.6614 0.6622 Yeast 0.7148 0.7148 0.7148 0.7216 0.7148 0.6409 0.7193 0.7498 0.7498 User knowledge 0.6749 0.6630 0.6120 0.6813 0.6749 0.6672 0.6871 0.6829 0.6939 Average 0.6918 0.7018 0.6691 0.7140 0.6973 0.6999 0.6979 0.7091 0.7156
of-the-art (SOTA) methods from recent years are compared under the same experimental settings and using the same initialization.
It should be emphasized that the details of the experi-ments are deliberately chosen for comparison of the per-formance of the proposed model with RE (adaptive-REFCM) and without RE (adaptive-FCM) to confirm whether the global adaptive adjustment of RE works or not. Note that adaptive-FCM is referred to as ADFCM while adaptive-REFCM is referred to as ADREFCM for short in this section.
6.1 General Performance Comparison on UCI
Twenty-five real-world datasets are selected randomly
from the UCI repository [41]. We implement several
related state-of-the-art FCM methods, and Table1collects
the clustering accuracy (also called the Rand index [42]) of the 25 UCI datasets without extra noise. It turns out that, generally, ADFCM and ADREFCM achieve better per-formances in comparison with FCM and REFCM. Note that the clustering accuracy of ADREFCM is higher by 2.38% on average compared with FCM and that it out-performs other enhanced fuzzy clustering algorithms in these trials.
6.2 Robustness to Noise
6.2.1 Clustering of UCI Datasets with Outliers
This section compares the average accuracy in 100 trials over 25 datasets with outliers. There is no explicit mathe-matical definition for an outlier, so we apply the definition
of a small group of observations whose size is1001 of the
size of the original dataset and whose centroid is two times the maximum distance of the original observations away from the centroid of all the points in the dataset. The performance results indicate that ADFCM and ADREFCM are superior to standard FCM and REFCM in dealing with outliers in real-world situations. The average clustering accuracy of ADFCM and ADREFCM is 2.70% and 5.75% higher compared with FCM, respectively, and both out-perform other enhanced fuzzy clustering algorithms among these trials.
6.2.2 Artificial Dataset Clustering
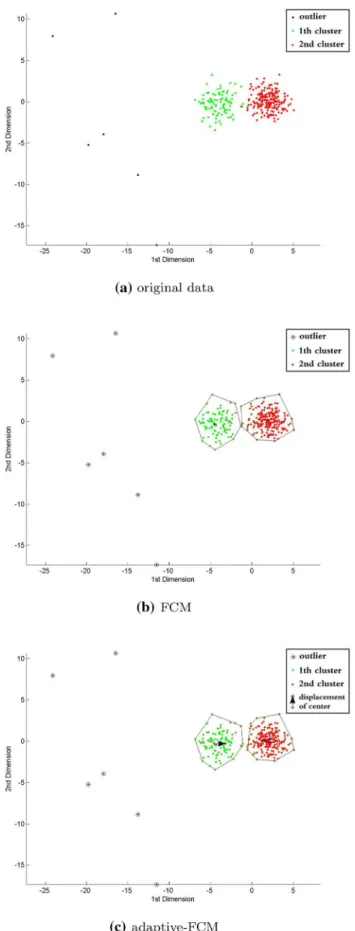
Figure5 shows the noise robustness in a more intuitive
way by pointing out the displacements of the clusters’
centers with arrows, as shown in Fig.5c, relative to the
clustering result of FCM. Moreover, the clustering convex
overlap-dataset consists of two partially overlapped clusters
sub-jected to Gaussian distributions with equall and equald.
In addition, extra stochastic outliers are added. Theoreti-cally, in this case, the overall dataset can be clustered into two clusters with balanced distribution using FCM. How-ever, the small amount of outlying observations whose values in the first dimension are much smaller than the normal data points serve as interference in the data struc-ture when using FCM, resulting from the fact that the computation of the membership degrees considers all the clusters. This leads to a global shift toward the location of the outliers during the clustering process. ADFCM weak-ens this uncertain influence of the outliers and adjusts the centers of the clusters to better positions (e.g., the centroid of the first cluster toward the right in this case), ultimately resulting in better clustering performance compared with
FCM (Table2).
6.3 Global Adaptive Adjustment and Dimensional-Wise Normalization
6.3.1 Image Segmentation
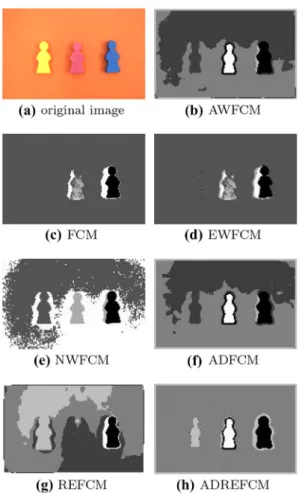
We carry out several trials on image segmentation using ADFCM and ADREFCM in comparison with other related algorithms. Taking red–green–blue (RGB) values (three dimensions) and spatial information as two-dimensional
(2D) coordinate positions into consideration, Figs. 6and7
present the performance of the different clustering
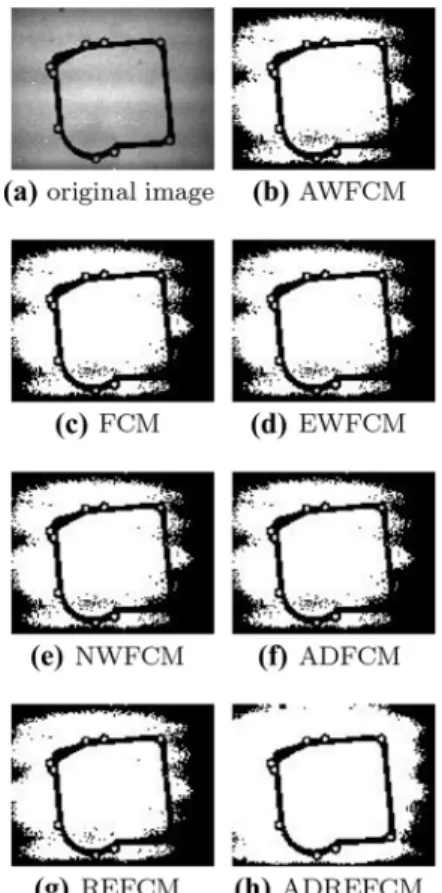
meth-ods. Figure6focuses on object segmentation, while Fig.7
focuses on computed tomography segmentation. Figure6a
shows the original image where four unique subclasses (three foreground subclasses and the background subclass) are included. FCM does not perform very well in the image
segmentation because of the potential dimensional
Table 2 Comparison of average accuracy in 100 trials over 25 datasets with outliers
Name FCM AWFCM NWFCM EWFCM FDCM-SSR L1=2-CM REFCM ADFCM ADREFCM
E. coli 0.8068 0.8171 0.8169 0.8077 0.8185 0.8628 0.8097 0.8306 0.8527 Auto 0.7654 0.7942 0.7769 0.6363 0.7690 0.7790 0.7654 0.7931 0.8257 Dermatology 0.6764 0.6808 0.6728 0.8900 0.6782 0.6808 0.7004 0.6879 0.6879 Iris 0.7637 0.7599 0.8580 0.7934 0.7709 0.8107 0.8180 0.8629 0.8684 Zoo 0.8103 0.8856 0.8636 0.9743 0.8693 0.8310 0.8182 0.8874 0.8850 Transfusion 0.6368 0.6369 0.6368 0.6368 0.6368 0.6368 0.6368 0.6368 0.6368 Parkinson’s 0.6270 0.6270 0.6287 0.6270 0.6270 0.6270 0.6270 0.6270 0.6846 Banknote 0.5205 0.5165 0.5196 0.5373 0.5205 0.5229 0.5205 0.5290 0.7549 Credit 0.5036 0.5036 0.5194 0.5036 0.5412 0.5036 0.5036 0.5036 0.5048 Breast cancer 0.9000 0.8922 0.9080 0.9000 0.9026 0.9186 0.9000 0.9000 0.9431 Wine 0.6688 0.6882 0.6923 0.3451 0.6689 0.6928 0.6697 0.6879 0.7296 Automobile 0.6578 0.6536 0.6742 0.2450 0.6688 0.6697 0.6583 0.6759 0.6895 Car 0.5330 0.5430 0.5516 0.5364 0.5335 0.5515 0.5425 0.5514 0.5569 Fertility 0.5014 0.5080 0.5033 0.7286 0.5085 0.5190 0.5216 0.5392 0.7867 Seeds 0.8076 0.7695 0.7827 0.8147 0.8147 0.7875 0.8102 0.8147 0.8108 Balance 0.5160 0.5323 0.5181 0.5512 0.5182 0.5270 0.5604 0.5833 0.5800 House votes 0.7752 0.7718 0.7821 0.7855 0.7820 0.7821 0.7810 0.7881 0.7881 Vowel 0.6514 0.6482 0.6537 0.7509 0.6601 0.6514 0.6608 0.8543 0.8518 Glass 0.6791 0.7061 0.6574 0.6797 0.6799 0.6730 0.6842 0.6962 0.6929 Mammographic 0.5757 0.5757 0.5757 0.5785 0.5776 0.5725 0.5757 0.5757 0.5925 Pima 0.5450 0.5451 0.5451 0.5450 0.5451 0.5451 0.5450 0.5450 0.5668 Bankruptcy 0.9762 0.9762 0.9762 0.9762 0.9762 0.9762 0.9762 0.9762 0.9762 Phishing 0.6490 0.6629 0.6536 0.6608 0.6673 0.6598 0.6919 0.6492 0.6928 Yeast 0.7115 0.6488 0.6928 0.7204 0.7127 0.7115 0.7322 0.7376 0.7292 User knowledge 0.6782 0.6833 0.6666 0.6807 0.6782 0.6782 0.6791 0.6804 0.6876 Average 0.6775 0.6811 0.6850 0.6762 0.6850 0.6868 0.6875 0.7045 0.7350
imbalance between the RGB and spatial information. Inheriting the result of FCM and restarting consecutive
iterations using AWFCM, EWFCM, NWFCM, and
ADFCM does not achieve much improvement for the same reason as mentioned above, but in combination with GMM, ADREFCM adaptively adjusts the situation. A seen in
Fig.6d, the background and three foreground objects are
visibly separated when using ADREFCM.
As presented in Figs.8, 9, 10, and 11, four more
experiments are carried out on a scenery picture and three images under the condition of low illumination, where the partially overlapping objects have limited color features. Extra sparse outliers (extremely bright spots) are added to these images as shown in the ‘‘original image’’ in each case. The outliers pull the centers of the objects toward the negative directions and destroy their structure in the ima-ges, resulting in uncertainty in the data structure extracted by the clustering process. By global adjustment of the RE term, ADREFCM segments the components more effec-tively, outperforming the other related FCM algorithms as shown in Figs.8,9,10, and11.
6.3.2 Artificial Dataset Clustering
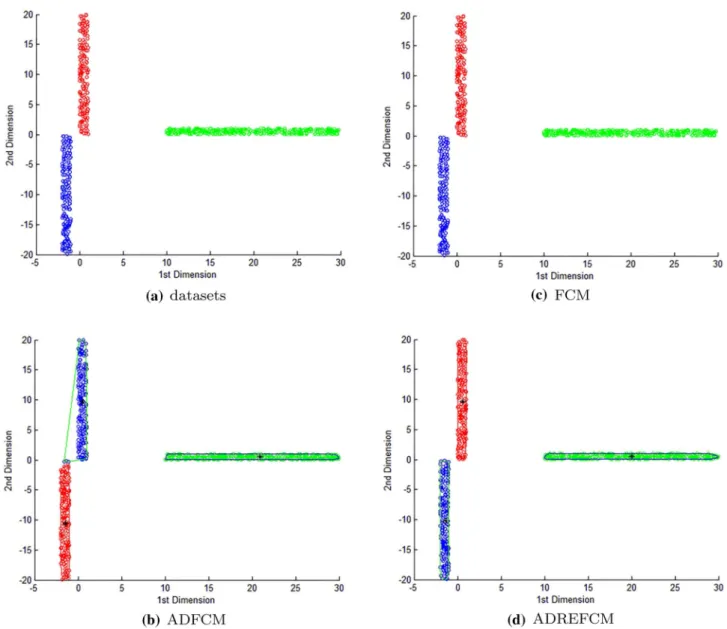
This section discusses the clustering results of two-di-mensional nonspherical data belonging to two clusters.
As shown in Fig.12a, the original dataset consists of
three rectangular clusters. Figure 12b–d presents the
clustering results achieved using the different algorithms. Note that points of the same color belong to the same cluster.
FCM is based on Euclidean distance, which can result in improper clustering when dealing with nonspherical
data-sets, as shown in Fig.12c. ADFCM is sensitive to
dimensional inconsistency, as shown in Fig.12b. In
com-parison with FCM, the centroids of the clusters are adap-tively pushed slightly when using ADREFCM to fit the distribution of the dataset, which can capture its latent structure well, as shown in Fig.12d.
Fig. 6 Segmentation experiments on image containing three fore-ground subclasses and one backfore-ground subclass
Fig. 7 Image segmentation experiments on X-ray output of a patient’s skull
Fig. 8 Image segmentation experiments on industry image I under low-illumination condition
Fig. 9 Image segmentation experiments on noisy scenery image I
Fig. 10 Image segmentation experiments on industry image II under low-illumination condition
6.4 Parameter Sensitivity Analysis
To analyze the sensitivity of the algorithm to its parame-ters, we arbitrarily cluster 15 splits out of the UCI
reposi-tory with an extra 1
100 outliers using ADREFCM while
varyingdandb, as done by Luo and Wen [43,44].bhelps consideration of the global information in the dataset. However, outliers cause data distribution deviations, thus excessivebwill result in overconsideration of noisy global information, so we set the value ofbwithin a certain range.
In this experiment,d andb are tuned within the range of
½104;103 and ½0;102, respectively. Figure13visualizes
the d-b accuracy histogram of ADREFCM, showing the
mean standard deviation (MS) of the clustering accuracy.
These results indicate greater sensitivity to b than d,
although they are both important for promoting the per-formance of the algorithm. The optimal values of these parameters are data dependent. In most cases, we conclude that the optimal ranges ofdandbare [0.01, 1] and [0, 10], respectively.
In summary, the parameter sensitivity analysis and properties of the proposed methods discussed in detail in this section reveal that the proposed methods can achieve the targeted performance in dozens of real-world and artificial experiments.
7 Conclusions
Adaptive-FCM is proposed as an extension of the adaptive
norm to mth order, to weaken the impact of noise while
preserving the aggregation ability of FCM within clusters. In addition, by combining the Gaussian mixture model and the relative entropy, adaptive-REFCM is proposed to solve the problems of both noise robustness and dimen-sional normalization in clustering tasks, considering not only fuzzy membership but also the distribution of clusters. Great performance of adaptive-REFCM is achieved based on its higher clustering accuracy in experiments on real-world (noise-free or noisy UCI repositories and image segmentation) and artificial datasets. With regard to future research, it is recommended to study the integration of existing noise-sensitive algorithms with the core design of adaptive-FCM and adaptive-REFCM to address their deficiency of noise sensitivity.
Acknowledgements This study was supported by the National Nat-ural Science Foundation of China (61203176) and the NatNat-ural Science Foundation of Fujian Province (2013J05098, 2016J01756).
References
1. Bock, H.H.: Origins and extensions of the k-means algorithm in cluster analysis. Elect. J.4, 2 (2008)
2. Zadeh, L.A.: Fuzzy logic = computing with words. Physica-Verlag, Heidelberg (1999)
3. Bezdek, J.C., Ehrlich, R., Full, W.: FCM: the fuzzy c-means clustering algorithm. Comput. Geosci.10(2–3), 191–203 (1984) 4. Zadeh, L.A.: Fuzzy sets. Inf. Control 8(3), 338–353 (1965).
https://doi.org/10.1016/S0019-9958(65)90241-X
5. Dunn, J.C.: A fuzzy relative of the isodata process and its use in detecting compact well-separated clusters. J. Cybern.3(3), 32–57 (1973).https://doi.org/10.1080/01969727308546046
6. Jing, G., Jiao, L., Yang, S., Fang, L.: Fuzzy double c-means clustering based on sparse self-representation. IEEE Trans. Fuzzy Syst.99, 1–1 (2018)
7. Keller, A., Klawonn, F.: Fuzzy clustering with weighting of data variables. Int. J. Uncertain. Fuzziness Knowl. Based Syst.8(06), 735–746 (2000)
8. Le, H.S., Tien, N.D.: Tune up fuzzy c-means for big data: some novel hybrid clustering algorithms based on initial selection and incremental clustering. Int. J. Fuzzy Syst. 19(5), 1–18 (2016). https://doi.org/10.1007/s40815-016-0260-3
9. Hu, Z., Bodyanskiy, Y.V., Tyshchenko, O.K., Samitova, V.O.: Fuzzy clustering data given on the ordinal scale based on mem-bership and likelihood functions sharing. Int. J. Intell. Syst. Appl.
9(2), 1–9 (2017)
10. Raja, S., Ramaiah, S.: An efficient fuzzy-based hybrid system to cloud intrusion detection. Int. J. Fuzzy Syst.19(1), 62–77 (2017). https://doi.org/10.1007/s40815-016-0147-3
11. Zhao, X., Yu, L., Zhao, Q.: A fuzzy clustering approach for complex color image segmentation based on gaussian model with interactions between color planes and mixture gaussian model. Int. J. Fuzzy Syst.20(1), 309–317 (2018).https://doi.org/10.1007/ s40815-017-0411-1
12. Davarpanah, S.H., Liew, W.C.: Spatial possibilistic fuzzy c-mean segmentation algorithm integrated with brain mid-sagittal surface information. Int. J. Fuzzy Syst.19(2), 1–15 (2017).https://doi. org/10.1007/s40815-016-0247-0
13. Hung, C.C., Kulkarni, S., Kuo, B.C.: A new weighted fuzzy c-means clustering algorithm for remotely sensed image
classification. IEEE J. Select. Topics Signal Process. 5(3), 543–553 (2011)
14. Zhou, J., Chen, L., Chen, C.L.P., Zhang, Y.H., Li, H.X.: Fuzzy clustering with the entropy of attribute weights. Neurocomputing
198, 125–134 (2016). https://doi.org/10.1016/j.neucom.2015.09. 127
15. Kroger, P.: Outlier detection techniques. In: Proceedings of the 16th ACM SIGKDD international conference on knowledge discovery and data mining (2010)
16. Chang, X., Wang, Q., Liu, Y., Wang, Y.: Sparse regularization in fuzzyc-means for high-dimensional data clustering. IEEE Trans. Cybern.47(9), 2616–2627 (2017).https://doi.org/10.1109/TCYB. 2016.2627686
17. Hamasuna, Y., Endo, Y., Miyamoto, S.: Comparison of tolerant fuzzy c-means clustering withl1 andl2 regularization. In: IEEE international conference on granular computing, pp. 197–202 (2009)
18. Yun-Xia, Y.U., Wang, S.T., Zhu, W.P.: On fuzzy c-means for data with tolerance. Comput. Eng. Des.31(3), 612–615 (2010) 19. Rubio, E., Castillo, O.: Designing type-2 fuzzy systems using the
interval type-2 fuzzy c-means algorithm. Stud. Comput. Intell. (2014).https://doi.org/10.1007/978-3-319-05170-3_3
20. Yu, S.M., Wang, J., Wang, J.Q.: An interval type-2 fuzzy like-lihood-based mabac approach and its application in selecting hotels on a tourism website. Int. J. Fuzzy Syst. 19(1), 47–61 (2017).https://doi.org/10.1007/s40815-016-0217-6
21. Vu, M.N., Long, T.N.: A multiple kernels interval type-2 possi-bilistic c-means. Stud. Comput. Intell. (2016).https://doi.org/10. 1007/978-3-319-31277-4_6
22. Miyamoto, S.: Multisets and fuzzy multisets. Springer, Berlin (2000)
23. Atanassov, K.T.: Intuitionistic fuzzy sets. Fuzzy Sets Syst.20(1), 87–96 (1986).https://doi.org/10.1016/S0165-0114(86)80034-3 24. Liao, H., Xu, Z., Herrera-Viedma, E., Herrera, F.: Hesitant fuzzy
linguistic term set and its application in decision making: a state-of-the-art survey. Int. J. Fuzzy Syst.20(12), 1–27 (2017).https:// doi.org/10.1007/s40815-017-0432-9
25. Torra, V.: Hesitant fuzzy sets. Int. J. Intell. Syst.25(6), 529–539 (2010).https://doi.org/10.1002/int.20418
26. Wang, J., Wang, J.Q., Zhang, H.Y., Chen, X.H.: Multi-criteria group decision-making approach based on 2-tuple linguistic aggregation operators with multi-hesitant fuzzy linguistic infor-mation. Int. J. Fuzzy Syst.18(1), 81–97 (2016).https://doi.org/10. 1007/s40815-015-0050-3
27. Wen, F., Liu, P., Liu, Y., Qiu, R.C., Yu, W.: Robust sparse recovery for compressive sensing in impulsive noise using p-norm model fitting. In: 2016 IEEE international conference on acoustics, speech and signal processing (ICASSP), IEEE, pp. 4643–4647 (2016)
28. Tang, M., Nie, F., Jain, R.: Capped lp-norm graph embedding for photo clustering. In: Proceedings of the 24th ACM international conference on Multimedia, pp. 431–435. ACM (2016)
29. Ding, C.: A new robust function that smoothly interpolates between l1 and l2 error functions. Univerisity of Texas at Arlington Tech Report
30. Nie, F., Wang, H., Huang, H., Ding, C.: Adaptive loss mini-mization for semi-supervised elastic embedding. In: International joint conference on artificial intelligence, pp. 1565–1571 (2013) 31. Krishnapuram, R., Keller, J.M.: A possibilistic approach to
clustering. IEEE Trans. Fuzzy Syst.1(2), 98–110 (1993)
32. Zarinbal, M., Zarandi, M.H.F., Turksen, I.B.: Relative entropy fuzzy c-means clustering. Inf. Sci.260(1), 74–97 (2014).https:// doi.org/10.1016/j.ins.2013.11.004
33. Gustafson, D.E., Kessel, W.C.: Fuzzy clustering with a fuzzy covariance matrix. In: 1978 IEEE conference on decision and control including the symposium on adaptive processes, pp. 761–766 (2007).https://doi.org/10.1109/CDC.1978.268028 34. Tibshirani, R.: Regression shrinkage and selection via the lasso: a
retrospective. J. R. Stat. Soc. Series B Stat. Methodol. 73(3), 273–282 (2011). https://doi.org/10.1111/j.1467-9868.2011. 00771.x
35. Hui, Z., Hastie, T.: Regularization and variable selection via the elastic net. J. R. Stat. Soc.67(5), 768–768 (2010).https://doi.org/ 10.1111/j.1467-9868.2005.00527.x
36. Liu, H.C., Jeng, B.C., Yih, J.M., Yu, Y.K.: Fuzzy c-means algorithm based on standard Mahalanobis distances. Proc. Int. Symp. Inf. Process15, 581–595 (2009)
37. Zhao, X., Li, Y., Zhao, Q.: Mahalanobis distance based on fuzzy clustering algorithm for image segmentation. Digit. Signal Pro-cess.43, 8–16 (2015)
38. Corless, R.M., Gonnet, G.H., Knuth, D.: On the Lambertw function. In: Advances in computational mathematics, p. 329–359 (1996)https://doi.org/10.1007/BF02124750 39. Pal, N.R., Bezdek, J.C.: Correction to on cluster validity for the
fuzzy c-means model (1997)
40. Bezdek, J.C.: A physical interpretation of fuzzy isodata. IEEE Trans. Syst. Man Cybern.6(5), 387–389 (2007)
41. Dheeru, D., Karra Taniskidou, E.: UCI machine learning repos-itory (2017).http://archive.ics.uci.edu/ml
42. Rand, W.M.: Objective criteria for the evaluation of clustering methods. Publ. Am. Stat. Assoc.66(336), 846–850 (1971) 43. Luo, M., Nie, F., Chang, X., Yang, Y., Hauptmann, A.G., Zheng,
Q.: Adaptive unsupervised feature selection with structure regu-larization. IEEE Trans. Neural Netw. Learn. Syst.29(4), 944–956 (2018)
44. Wen, Z., Liu, X., Chen, Y., Wu, W., Wei, W., Li, X.: Feature-derived graph regularized matrix factorization for predicting drug side effects. Neurocomputing287, 154 (2018)
Yunlong Gao was born in
Shanxi, China in 1979. He received the M.S. degree in computer science from Lanzhou University, Lanzhou, Gansu, China in 2005, and the Ph.D. degree in control science and engineering from Xi’an Jiao-tong University, Xian, Shanxi, China in 2011. Since 2011, he has been an Associate Professor at the Department of Automa-tion, Xiamen University, Xia-men, Fujian, China. His current research interests include dimensionality reduction, statistical pattern recognition, and machine learning.
Dexin Wangreceived the B.E. degree from the Department of Automation, Xiamen University in 2019. He is now working toward the M.S. degree at Tianjin University. His research interests cover fuzzy clustering, computer vision, and multi-modal learning.
Jinyan PanAssociate Professor in Information Engineering College, Jimei University, China, obtained the Ph.D. degree in control science and engineering from Xian Jiaotong University in 2008, with research interests including optimization methods and their application to machine learning and data mining.
Zhihao Wangreceived the B.E. degree from Xiamen University in 2016 and the M.S. degree from Xiamen University, Fujian, China in 2019. His research interests include pat-tern recognition and machine learning.
Baihua Chenreceived the M.S. degree from Xiamen University in 2017. He is now working toward the Ph.D. degree at Xiamen University. His research interests include pat-tern recognition, machine learning, and data dimensional-ity reduction.