TR
OP
E
R
HC
RA
ES
E
R
PAI
D
I
THE 2013 FACE RECOGNITION
EVALUATION IN MOBILE ENVIRONMENT
Manuel Günther Artur Costa-Pazo Changxing Ding
Elhocine Boutellaa Giovani Chiachia
Honglei Zhang Marcus de Assis Angeloni
Vitomir Struc Elie Khoury
Esteban Vazquez-Fernandez Dacheng Tao
Messaoud Bengherabi David Cox Serkan Kiranyaz
Tiago de Freitas Pereira Jerneja Zganec-Gros
Enrique Argones-Rúa Nicolas Pinto
Moncef Gabbouj Flávio Simões Simon Dobrisek
Daniel González-Jiménez Anderson Rocha
Mário Uliani Neto Nikola Pavesic
Alexandre Falcão Ricardo Violato
Sébastien Marcel
Idiap-RR-36-2013
NOVEMBER 2013
Centre du Parc, Rue Marconi 19, P.O. Box 592, CH - 1920 Martigny
The 2013 Face Recognition Evaluation in Mobile Environment
M. G¨unther,1A. Costa-Pazo,2C. Ding,3E. Boutellaa,4G. Chiachia,5H. Zhang,6M. de Assis Angeloni,7V. ˇStruc,8E. Khoury,1E. Vazquez-Fernandez,2D. Tao,3M. Bengherabi,4D. Cox,10S. Kiranyaz,6 T. de Freitas Pereira,7J. ˇZganec-Gros,9E. Argones-R´ua,2N. Pinto,10M. Gabbouj,6F. Sim˜oes,7S. Dobriˇsek,8
D. Gonz´alez-Jim´enez,2A. Rocha,5M. Uliani Neto,7N. Paveˇsi´c,8A. Falc˜ao,5R. Violato,7S. Marcel1
1
Idiap Research Institute (CH),2Galician Research and Development Center in Advanced Telecommunications (ES),
3
University of Technology, Sydney (AUS),4Centre de D´eveloppement des Technologies Avanc´ees (DZ),
5
University of Campinas (BR),6Tampere University of Technology (FIN),7CPqD (BR),
8
University of Ljubljana (SLO),9
Alpineon Ltd. (SLO),10
Harvard University (US)
Abstract
Automatic face recognition in unconstrained environ-ments is a challenging task. To test current trends in face recognition algorithms, we organized an evaluation on face recognition in mobile environment. This paper presents the results of eight different participants using two verifi-cation metrics. Most submitted algorithms rely on on or more of three types of features: local binary patterns, Ga-bor wavelet responses including GaGa-bor phases, and color information. The best results are obtained from UNILJ-ALP, which fused several image representations and feature types, and UC-HU, which learns optimal features with a convolutional neural network. Additionally, we assess the usability of the algorithms in mobile devices with limited resources.
1. Introduction
Since it started in the late 1980th [1], automatic face
recognition is an ongoing topic and enormous progress has been made [2]. On good quality facial images with frontal pose and moderate illumination, current automatic face recognition systems outperform humans [3] on this job. Still, recognizing facial images in low resolution images and under uncontrolled pose is a challenging task for au-tomatic face recognition systems.
To evaluate different face recognition algorithms on this kind of data, the Biometric Group at the Idiap Research Institute organized a face recognition evaluation in mobile environment. Together with the speaker verification evalu-ation [4], it is the second in an ongoing series of face and speaker recognition evaluations [5]. The evaluation is car-ried out on the MOBIO database [6], which contains videos
of talking faces that were captured with mobile devices. In total, eight institutions participated in the face recog-nition evaluation. To assure a fair competition and compa-rable results, all participants had to strictly follow an unbi-ased evaluation protocol. In the first phase of the evaluation, thetrainingand thedevelopmentset was made available to the participants. In these sets, each image was labeled with theclient ID, and the participants were allowed to optimize their system parameters according to these data. In the sec-ond phase, anevaluationset was given to the participants. In the evaluation set, the file names were anonymized, so that client ID could not be read out from them. Participants were asked to compute the scores according to the proto-cols and send the final score files to the organizers of the evaluation, which evaluated them.
The structure of this paper is as follows: first we intro-duce the database and the evaluation method, then we de-scribe the face recognition systems of the participants. Af-terward, we evaluate the verification performances of the submitted systems and discuss some further characteristics of them. Finally, we close this paper with a conclusion.
2. The MOBIO Database
The MOBIO database is a bi-modal (face/speaker) video database recorded from 152 people. The database has a female-male ratio of nearly 1:2 (100 males and 52 females) and was collected from August 2008 until July 2010 in six different sites from five different countries. In total 12 ses-sions were captured for each individual.
The database was recorded using two types of mobile de-vices: mobile phones (NOKIA N93i) and laptop computers (standard 2008 MacBook). In this evaluation we only use the mobile phone data. The MOBIO database is a challeng-ing database since the data is acquired with uncontrolled il-1
lumination, facial expression, and face pose, and sometimes only parts of the face are visible. For this face recognition evaluation, one facial image was extracted from each video and the eye positions were labeled by hand and made avail-able to the participants.
More technical details about the MOBIO database can be found in [6] and on its official web page1, which also
contains instructions on how to obtain the data.
Based on the gender of the clients, two different evalu-ation protocolsfemaleandmaleexist. In order to have an unbiased evaluation, the clients of the database are split up into three different sets: the training set, the development set and the evaluation set.
Training set. The images from training set can, e. g., be used to compute projection matrices for PCA. For some sys-tems, these images also serve as the negative examples in a classification system. Furthermore, these images can be used as cohort images for score normalization. The training set consists of both male and female subjects, and partici-pants are allowed to separate the clients in the training set according to the gender. If desired, participants are also al-lowed to use other data to train their algorithms, but none of the participants makes use of this option.
Development set. The development set can be used to choose the meta-parameters of the algorithms, e. g., the di-mension of a PCA projection matrix and the distance func-tion. For each client in this set, the images are subdivided into theenrollmentand theprobegroup. For the enrollment of a client model, 5 images per client are provided, andit is forbidden to use the information of other clients of the development setfor enrolling a client model. The remain-ing images of the clients serve as probe images, and simi-larity scores have to be computed between all probe images and all client models. In systems that required score cal-ibration, these scores can be used to train the calibration system.
Evaluation set. The evaluation set is used to assess the fi-nal unbiased system performance. The subdivision into en-rollment and probe groups is similar to the one in the devel-opment set, and also the model enrollment uses similar data. To disallow participants to optimize system parameters on the evaluation set, the probe image names are anonymized and shuffled.
Table 1 statistically details each of the sets described above. It specifies the number of files, clients, and probe images; and the number of scores that need to be computed.
1https://www.idiap.ch/dataset/mobio
3. Performance Measures
The metrics that are used to evaluate face verification performance are based on thefalse acceptance rate(FAR) and thefalse rejection rate(FRR). The definition of these rates is dependent on a certainthresholdθ:
FAR(θ) = |{simp|simp≥θ}|
|{simp}|
FRR(θ) = |{scli|scli< θ}|
|{scli}|
(1)
wherescliare client scores, whilesimpare imposter scores. We evaluate the FAR and the FRR for both the development and the evaluation set independently.
The first evaluation metric is based on the equal error rate(EER) and thehalf total error rate (HTER). Particu-larly, it defines a score thresholdθ∗ based on the EER of
the development set, and computes the final HTER using this threshold:
θ∗= arg min
θ
|FARdev(θ)−FRRdev(θ)|
EER = FARdev(θ∗) + FRRdev(θ∗) 2
HTER = FAReval(θ∗) + FRReval(θ∗) 2
(2)
The second metric is the receiver operating charac-teristics (ROC). In this metric, the correct acceptance rate(CAR) withCAR = 100%−FRRis plotted against the FAR. Commonly, the focus is put on the low FAR values and, hence, we plot the FAR axis in logarithmic scale.
4. Participants
In total, eight institutions participated in the evaluation. Please refer to table2for the names of the participants and their abbreviation. In this section we briefly review the face recognition systems of the participants, split into systems that use a single algorithm and systems that fuses scores from different algorithms.
As long as not stated otherwise, all face recognition sys-tems use the provided hand-labeled eye positions to geo-metrically normalize (align) the faces.
4.1. Simple Systems
Baseline. The baseline system that we provide computes a PCA+LDA [7] projection matrix on the raw pixel values of aligned64×80pixel images that were enhanced using histogram equalization. The dimensions of the PCA and LDA subspaces are limited to 200 and 199, respectively. The projected features of one model and a probe image are
Table 1. PARTITIONING OF THEMOBIODATABASE.This table exemplifies the number of clients and images of the training set, as well as the number of clients and enrollment images, and the number of probe images and scores for the development and the evaluation set for the two protocols Male and Female.
Protocol Training set Development set Evaluation set
Enrollment Probe Enrollment Probe
Clients Images Clients Images Probes Scores Clients Images Probes Scores
Female 13 2496 18 90 1890 34020 20 100 2100 42000
Male 37 7104 24 120 2520 60480 38 190 3990 151620
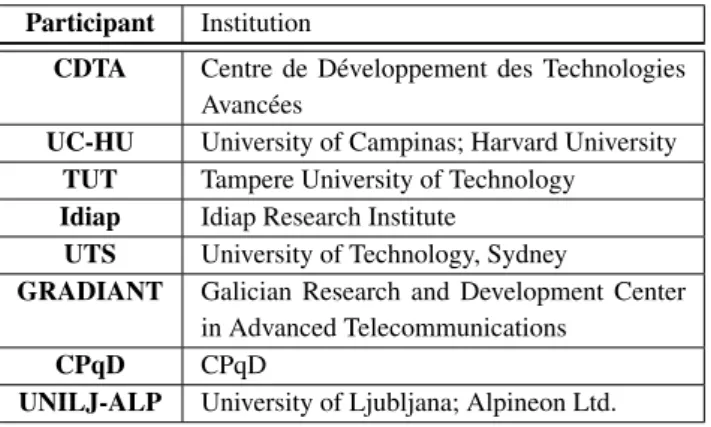
Table 2. PARTICIPANTS.This table lists the participants and their institutions.
Participant Institution
CDTA Centre de D´eveloppement des Technologies Avanc´ees
UC-HU University of Campinas; Harvard University
TUT Tampere University of Technology
Idiap Idiap Research Institute
UTS University of Technology, Sydney
GRADIANT Galician Research and Development Center
in Advanced Telecommunications
CPqD CPqD
UNILJ-ALP University of Ljubljana; Alpineon Ltd.
compared using the cosine similarity measure, and the high-est similarity value for all model images of a client is cho-sen. Note that the baseline system solely uses open source software [8] that was developed at Idiap.2
CDTA. The CDTA system compares adapted histograms oflocal binary patterns(LBP) from the geometrically nor-malized images of resolution 64×80, which are photo-metrically normalized [9]. Each image is divided into 80 blocks of size8×8 pixels and histogramsHk of LBPu2
8,2
features [10] are extracted from each blockk= 1, . . . ,80. A global histogramHwk is computed from the training
im-ages. Each model histogram is enrolled using (there are five models per client):
b Hck=α H k w+ (1−α)H k c : k= 1, . . . , N (3)
where the parameterαis optimized on the development set. The score between a model histogramHbk
c and a probe
his-togramHk r is computed by: S=X k [−χ2(Hrk,Hb k c) +χ 2( Hrk, H k w)] (4)
using the defaultχ2histogram similarity measure [10]. The second term in (4) aims for eliminating the cohort effect. For each client, the highest score of all five model his-tograms is taken.
2http://www.idiap.ch/software/bob
UC-HU. The UC-HU system employs a three layer hi-erarchical convolutional neural network similar to the one described in [11]. This neural network takes as input raw pixel values from gray scale images of200×200pixels, in which the faces are aligned to 56 pixels inter-eye-distance. Additionally, Fisher LDA is used in order to represent the samples in a more meaningful way,i.e., adapted to the dis-criminant face aspects of the individuals in the training set, and the number of retained projection vectors is determined using the development set.
On top of this representation, person-specific linear mod-els are learnt at enrollment time in a one-versus-all setting, considering the samples of the person being enrolled for the positive class and all samples in the training set for the neg-ative class. Scores between the model and probe samples are computed by dot product.
TUT. The TUT system extractslocal Gabor binary pat-tern histogram sequences(LGBPHS) [12] from the aligned images of resolution 140 ×154 pixels. First, a Gabor wavelet transform with the default 40 Gabor filters is per-formed. Afterward, LBPu2
8,2 [10] are extracted from the
absolute values of the Gabor filter responses. The image is split into 49 blocks and 49×40 LBP histograms are extracted and concatenated. For dimensionality reduction, only the 8000 histogram bins with highest variance are kept (variances are estimated on 1000 images from the training set).
For face verification, thepartial least square(PLS) clas-sifier [13] is used. For each client, the PLS classifier is learnt using the 5 enrollment images as positive and ran-dom 1000 training images as negative class. All PLS clas-sifiers are learnt with 64 latent components. The final score between a client model and a probe vector is given by the classification score of the according PLS classifier.
Idiap. The Idiap system extracts Gabor jets in a regular grid with 6 pixels inter-node distance and compares them using a Gabor phase based similarity measure. After align-ing images to resolution120×150pixels, they are prepro-cessed by extracting non-uniform LBP8,2features [14].
On top of the LBP codes, 40 Gabor filter responses are extracted using Gabor wavelet parameters optimized on the 3
development set.20×25Gabor jets including absolute and phase values [15] are extracted from a regular grid positions and form the feature. For client model enrollment, all 5 model features are stored. The score between a client model
Gand a probePis computed as:
S= 500 X n=1 5 max m=1 Sn+C(Gm,n,Pn) (5)
whereGm,nis the Gabor jet of thenthposition of themth
model feature. The Gabor jet similarity functionSn+C
in-corporates both the absolute values and disparity corrected phase differences [15] of two Gabor jets.
4.2. Fusion Systems
UTS. The UTS system fuses the results of Gabor phases and local phase quantization(LPQ) features [16]. After performing a photometric normalization [9] on the aligned images, they are split into7×7local regions, in which his-tograms of LPQ patterns are extracted; and8×8regions for extracting histograms of Gabor phases.
For both subsystems, the local histograms are concate-nated into one histogram sequence each. Scores between one model histogram and a probe histogram are computed using the histogram intersection measure and for each client the model histogram with the lowest score is taken. Scores for both subsystems are calibrated using mean and vari-ance of the scores from the development set, and fused with weight 0.5.
GRADIANT. The GRADIANT system fuses two differ-ent face recognition systems: patterns of oriented edge magnitudes(POEM) [17] andGabor jets(Gabor) [18] from a10×10regular grid. After aligning the face images to
125×140(POEM) or85×100(Gabor) pixels, an adapta-tion of the retina layer model [19] was used to preprocess the images. To the Gabor feature vectors, a change of basis using face information is performed.
For both subsystems, the scores between one model im-age and the probe were computed using a normalized corre-lation measure. For each client, the highest score of all five model images was taken. Finally, POEM and Gabor scores are fused after performing a score calibration using logistic regression.
CPqD. The CPqD system fuses scores from 4 different subsystems: LBP, dLBP, MSLBP-108, and MSLBP-68. The LBP system extracts LBPu8,22 histograms [10] from 64
blocks of aligned and preprocessed [9]108×108pixel im-ages. The dLBP system extracts histograms of direction-codedLBP features [20] from 16 blocks of aligned and pre-processed [9]68×68pixel images. Both MSLBP systems extractmultispectralLBPu2
8,2codes [21] from 16 blocks of
Figure 1. BLOCK DIAGRAM OF THEUNILJ-ALPFACE RECOG-NITION SYSTEM.
108×108or68×68pixel color images preprocessed with histogram equalization of each color layer.
For the client model enrollment of the three subsys-tems LBP, dLBP, and MSLBP-68, linear support vector machines(SVM) are trained using the 5 features from the model as positive and the images from the training set as negative class. The score between the client model and the probe feature is the SVM output of the according client. For MSLBP-108, an average histogram sequence is computed from the 5 model histogram sequences, and histogram inter-section is used to compare client model and probe feature.
Finally, the scores of the 4 subsystems are fused using
linear logistic regression.
UNILJ-ALP. The face recognition system submitted by UNILJ-ALP exploits multiple facial representations, PCA, and the whitened cosine similarity measure for recognition as shown in figure1. In the first step, the system uses the manually marked eye-centers and an automatically detected mouth location to geometrically normalize each given facial image. Afterward, the system crops the facial area from the input image using three bounding boxes of different size. This procedure results in three distinct facial areas (a tightly, a normally, and a broadly cropped one), each of which is then represented in theYCbCrcolor space.
In the next step, the luminance component (Y) of the cropped images is photometrically normalized [19] toPN
(cf. figure 1). Together with the remaining color compo-nentsY,Cb, andCrit forms the basis for the feature extrac-tion.
In the feature extraction step, various image descriptors, such as intensity values, Gabor features, and LBP features are computed from the image representations and subjected to PCA for dimensionality reduction. In the last step, all feature vectors corresponding to the given probe image are
matched against the corresponding enrollment feature vec-tors to produce 5 similarity scores per client, which are nor-malized using a special type of ZT normalization and ulti-mately combined using a variant of the recently proposed
temporal fusion[22].
5. Results
5.1. Verification Performances
We evaluate the score files that have been sent by the participants using the two different verification metrics that are presented in section3.
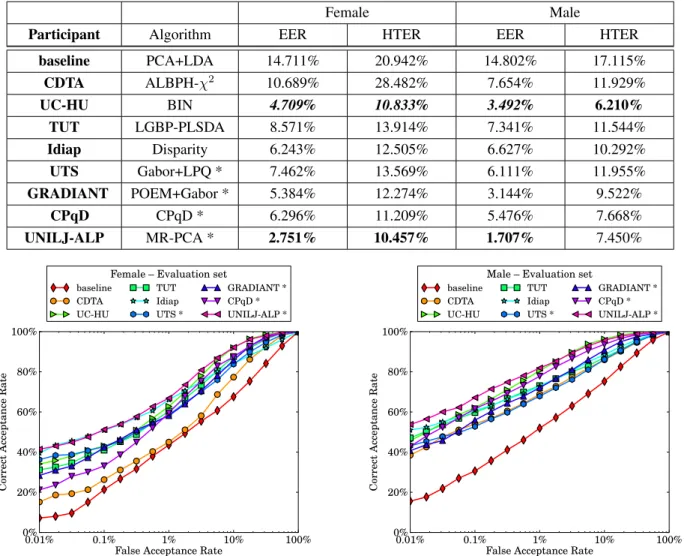
Table 3 shows the equal error rates on the develop-ment set and the half total error rates on the evaluation set. Clearly, the error rates on the evaluation set are higher than on the development set. This is most probably caused by the fact that all algorithms are optimized to the development set and there is a slight mismatch between the conditions in both sets. In general, the male clients are slightly easier to recognize, maybe caused by the fact that women more often wore different hair styles or make-up during the database recordings, or since the database (and also the training set) contains more men than women.
In this evaluation we discriminate the fusion systems that are marked with a * in table3. The best overall rates are highlighted in bold font, while the best results of the non-fusion systems are in italics. Among the non-fusion systems, clearly UNILJ-ALP gets the best scores, but the perfor-mance differs drastically between development and evalu-ation set. Apparently, the fusion systems like UNILJ-ALP and GRADIANT seem to over-tune their parameters to the development set.
For the non-fusion systems, the clear winner in this eval-uation is the UC-HU system since it gets best results in all four rates. In the evaluation set of the male protocol they could even outrival the fusion systems. With few excep-tions, all other systems perform comparably well and all systems are able to outperform the baseline.
Inspecting the receiver operating characteristics of the evaluation set, which are given in figure2with a logarith-mic FAR axis, one can see that different systems have dif-ferent preferred working points. For example, the Idiap, TUT and UTS systems perform comparably well in lower FAR regions while being average for higher FAR’s. On the other hand, UC-HU and UTS have low performance on low FAR but improve with increasing FAR. Generally, the best system is again UNILJ-ALP .
5.2. System requirements
One important point, especially in mobile environments, is the requirements of the face recognition system in terms of speed and memory. Usually, the requirements can be split into an offline training and enrollment phase, and an online
verification phase.
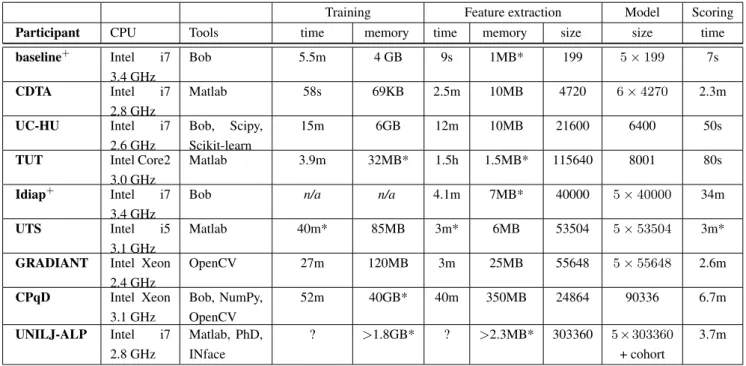
The participants were asked to report the size of their features and models; and also measure the time required for training, feature extraction and scoring. Since the time requirements are influenced by several factors, also the CPU and the tools that they use should be mentioned. Table4
gives an overview of the requirements of the systems. The reported feature extraction time measures the extraction of all 3990 images of the male probe set from the evaluation protocol, and the scoring time is computed for all 151620 scores of the male evaluation set. Unfortunately, UNILJ-ALP could not report training and feature extraction times.
A special attention should be paid to the elements that are required online. In a verification scenario, usually a probe image is compared with an enrolled model. Hence, the device must possess enough memory to hold the model and the feature, but also the memory required for probe im-age preprocessing, feature extraction, and the comparison. In table4, this includes the feature extraction memory, the feature size and the model size. Obviously, even though the best performing system UNILJ-ALP is able to compute the result rapidly, the required memory exceeds the capac-ity of mobile devices. The UC-HU system, which performs also very well, can run online since feature extraction and scoring do not require too much memory, but the model en-rollment, which needs 600MB of memory, needs to be done offline.
The time for feature extraction and scoring is also an im-portant factor. Except for the TUT system that needs around 1.4 seconds3to extract the features of one image, all algo-rithms are fast enough to be useful in mobile devices.
Looking at the trade-off between verification perfor-mance and hardware requirements, the algorithms from UC-HU, GRADIANT, Idiap and UTS are most suitable for mobile applications.
Another interesting point is the reproducibility of the re-sults and the algorithms. Therefore, in table 4the institu-tions that provide the source code for their algorithms are highlighted as well. Unfortunately, additionally to the base-line only one participant releases source code for the algo-rithm.
6. Conclusion
In this paper we have shown the results of the face recog-nition evaluation in mobile environments. In total, eight institutions participated, four of which submitted fusion al-gorithms. Most of the algorithms relied on one or more features of three different kinds:local binary patterns, Ga-bor wavelet responses(especiallyGabor phases) andcolor information. Notably, the best performing simple system
3TUT uses Matlab to extract the features. A faster implementation is
surely possible.
Table 3. EVALUATIONRESULTS. This table shows the equal error rates on the development set and the half total error rates on the evaluation set of the participants for the female and male protocol. Algorithms that perform score fusion are marked with *.
Female Male
Participant Algorithm EER HTER EER HTER
baseline PCA+LDA 14.711% 20.942% 14.802% 17.115% CDTA ALBPH-χ2 10.689% 28.482% 7.654% 11.929% UC-HU BIN 4.709% 10.833% 3.492% 6.210% TUT LGBP-PLSDA 8.571% 13.914% 7.341% 11.544% Idiap Disparity 6.243% 12.505% 6.627% 10.292% UTS Gabor+LPQ * 7.462% 13.569% 6.111% 11.955% GRADIANT POEM+Gabor * 5.384% 12.274% 3.144% 9.522% CPqD CPqD * 6.296% 11.209% 5.476% 7.668% UNILJ-ALP MR-PCA * 2.751% 10.457% 1.707% 7.450% 0.01% 0.1% 1% 10% 100%
False Acceptance Rate 0% 20% 40% 60% 80% 100% C or rec t A cc ep ta n ce R a te
Female – Evaluation set baseline CDTA UC-HU TUT Idiap UTS * GRADIANT * CPqD * UNILJ-ALP * 0.01% 0.1% 1% 10% 100%
False Acceptance Rate 0% 20% 40% 60% 80% 100% C or rec t A cc ep ta n ce R a te
Male – Evaluation set baseline CDTA UC-HU TUT Idiap UTS * GRADIANT * CPqD * UNILJ-ALP *
Figure 2. ROCCURVES OFEVALUATION SET.This figure display the receiver operating characteristics with logarithmic FAR axis of the participants on the female and male protocol of the evaluation set. Algorithms that perform score fusion are marked with *.
does not rely on hand-designed features, but learns the ex-tracted features with a convolutional neural network. The fusion systems perform very well on the development set, but these very good results cannot generalize to the evalua-tion set. Unfortunately, the reproducibility of the results is limited since only one participant provides source code.
The usability of the algorithms in mobile devices is two-fold. Usually, algorithms need to have a good balance be-tween requirements in terms of memory and execution time, and verification accuracy. Depending on the available hard-ware, different algorithms might be preferred. Also, all al-gorithms in this evaluation used the hand-labeled eye posi-tions, while algorithms might work different if the face is detected by an algorithm rather than annotated by a human. Finally, future work will focus on a biometric verifica-tion system that fuses scores from face and speaker [4] ver-ification systems.
Acknowledgments This evaluation has received fund-ing from the European Community’s FP7 under grant agreements 238803 (BBfor2: bbfor2.net) and 284989 (BEAT:beat-eu.org). Furthermore, we want to thank all participants of the evaluation for their great work and their responsiveness.
References
[1] L. Sirovich and M. Kirby. Low-dimensional procedure for the char-acterization of human faces.Journal of the Optical Society of Amer-ica A, 4(3):519–524, March 1987.
[2] P.J. Phillips, P.J. Flynn, T. Scruggs, K.W. Bowyer, and W. Worek. Preliminary face recognition grand challenge results. InProceedings 7th International Conference on Automatic Face and Gesture Recog-nition, pages 15–24, 2006.
[3] A.J. O’Toole, P.J. Phillips, F. Jiang, J. Ayyad, N. Penard, and H. Abdi. Face recognition algorithms surpass humans matching faces over changes in illumination.IEEE Transactions on Pattern Analysis and Machine Intelligence, 29:1642–1646, 2007.
Table 4. MEMORY ANDTIMEREQUIREMENTS. This table shows the memory footprints and the time requirements of the algorithms. Entries marked with * are estimated based on theoretical values.Institutions that provide the source code are marked with+
.
Training Feature extraction Model Scoring
Participant CPU Tools time memory time memory size size time
baseline+ Intel i7 3.4 GHz Bob 5.5m 4 GB 9s 1MB* 199 5×199 7s CDTA Intel i7 2.8 GHz Matlab 58s 69KB 2.5m 10MB 4720 6×4270 2.3m UC-HU Intel i7 2.6 GHz Bob, Scipy, Scikit-learn 15m 6GB 12m 10MB 21600 6400 50s
TUT Intel Core2 3.0 GHz
Matlab 3.9m 32MB* 1.5h 1.5MB* 115640 8001 80s
Idiap+
Intel i7 3.4 GHz
Bob n/a n/a 4.1m 7MB* 40000 5×40000 34m
UTS Intel i5
3.1 GHz
Matlab 40m* 85MB 3m* 6MB 53504 5×53504 3m*
GRADIANT Intel Xeon
2.4 GHz OpenCV 27m 120MB 3m 25MB 55648 5×55648 2.6m CPqD Intel Xeon 3.1 GHz Bob, NumPy, OpenCV 52m 40GB* 40m 350MB 24864 90336 6.7m UNILJ-ALP Intel i7 2.8 GHz Matlab, PhD, INface ? >1.8GB* ? >2.3MB* 303360 5×303360 + cohort 3.7m
[4] E. Khoury et al. The 2013 face recognition evaluation in mobile environment using the MOBIO database. Insubmitted to: ICB2013, 2013.
[5] S. Marcel et al. On the results of the first mobile biometry (MOBIO) face and speaker verification evaluation. InProceedings of the 20th International conference on Recognizing patterns in signals, speech, images, and videos, ICPR’10, pages 210–225, 2010.
[6] C. McCool et al. Bi-modal person recognition on a mobile phone: using mobile phone data. InIEEE ICME Workshop on Hot Topics in Mobile Multimedia, 2012.
[7] W. Zhao, R. Chellappa, and A. Krishnaswamy. Discriminant analysis of principal components for face recognition. InFG, pages 336–341. IEEE Computer Society, 1998.
[8] A. Anjos, L. El Shafey, R. Wallace, M. G¨unther, C. McCool, and S. Marcel. Bob: A free signal processing and machine learning tool-box for researchers. InProceedings of the ACM Multimedia Confer-ence, October 2012.
[9] X. Tan and B. Triggs. Enhanced local texture feature sets for face recognition under difficult lighting conditions. IEEE Transactions on Image Processing, 19(6):1635–1650, 2010.
[10] T. Ahonen, A. Hadid, and M. Pietikainen. Face recognition with local binary patterns. InEuropean Conference on Computer Vision, pages 469–481. Proc. Workshop Dynamical Vision, 2004. [11] D.D. Cox and N. Pinto. Beyond simple features: A large-scale
fea-ture search approach to unconstrained face recognition. InFG, pages 8–15, 2011.
[12] W. Zhang, S. Shan, W. Gao, X. Chen, and H. Zhang. Local Gabor bi-nary pattern histogram sequence (LGBPHS): A novel non-statistical model for face representation and recognition. Computer Vision, IEEE International Conference on, 1:786–791, 2005.
[13] R. Rosipal and N. Kr¨amer. Overview and recent advances in partial least squares. InSubspace, Latent Structure and Feature Selection, number 3940 in Lecture Notes in Computer Science, pages 34–51. Springer Berlin Heidelberg, January 2006.
[14] G. Heusch, Y. Rodriguez, and S. Marcel. Local binary patterns as an image preprocessing for face authentication. InIEEE Int. Conf. on Automatic Face and Gesture Recognition (AFGR), January 2006. [15] M. G¨unther, D. Haufe, and R.P. W¨urtz. Face recognition with
disparity corrected Gabor phase differences. InArtificial Neural Networks and Machine Learning, volume 7552, pages 411–418. Springer Berlin, September 2012.
[16] T. Ahonen, E. Rahtu, V. Ojansivu, and J. Heikkil. Recognition of blurred faces using local phase quantization. InInternational Con-ference on Pattern Recognition, pages 1–4, 2008.
[17] N. Vu and A. Caplier. Face recognition with patterns of oriented edge magnitudes. InProceedings of the 11th European conference on Computer vision: Part I, ECCV’10, pages 313–326, Berlin, Hei-delberg, 2010. Springer-Verlag.
[18] E. Argones-R´ua, J.L. Alba-Castro, and C. Garc´ıa-Mateo. Quality-based score normalization and frame selection for video-Quality-based per-son authentication. InBIOID, pages 1–9, 2008.
[19] N. Vu and A. Caplier. Illumination-robust face recognition using retina modeling. InProceedings of the 16th IEEE international conference on Image processing, ICIP’09, pages 3253–3256. IEEE Press, 2009.
[20] J. Trefn`y and J. Matas. Extended set of local binary patterns for rapid object detection. InProceedings of the Computer Vision Winter Workshop, 2010.
[21] C. Chan, J. Kittler, and K. Messer. Multispectral local binary pattern histogram for component-based color face verification. In Proceed-ings of the First IEEE International Conference on Biometrics: The-ory, Applications, and Systems, 2007. BTAS 2007., pages 1–7. IEEE, 2007.
[22] N. Poh, J. Kittler, and F.M. Alkoot. A discriminative parametric approach to video-based score-level fusion for biometric authentica-tion. InProceedings of ICPR 2012, volume 1, pages 2335–2338, 2012.