Crystal Plasticity Based Numerical
Modelling of Dynamic
Recrystallization in Magnesium
Alloys
byEvdokia Popova
A thesispresented to the University of Waterloo in fulfillment of the
thesis requirement for the degree of Doctor of Philosophy
in
Mechanical Engineering
Waterloo, Ontario, Canada, 2015 c
I hereby declare that I am the sole author of this thesis. This is a true copy of the thesis, including any required final revisions, as accepted by my examiners.
Abstract
The automotive industry has not been able to take full advantage of the lightweight of magnesium, or its alloys, because of its reduced formability at room temperature. In order to enhance the workability of magnesium and restore its ductility, elevated temperature forming needs to be performed. Hot working of metallic alloys is often accompanied by dynamic recrystallization (DRX), whereby the deforming grain structure is partially or completely replaced by new defect free grains during deformation. Dynamic recrystalliza-tion allows the final microstructure, as well as the properties of the material (grain size, texture strength), to be controlled. Therefore, DRX can be used as a tool to design a materials microstructure.
Because it would be advantageous to be able to redesign the material properties of magnesium, particularly for the automotive industry, this work takes a step towards such an outcome by presenting a new model that predicts DRX in magnesium. The model predicts DRX in magnesium alloys by using a crystal plasticity based finite element model (CPFEM) coupled with a probabilistic cellular automata model (CA). The CPFEM em-ploys microstructural information obtained by electron backscatter diffraction (EBSD) as input and computes dislocation density evolution corresponding to the active deformation modes. Because DRX proceeds via nucleation of new grains and their subsequent growth, a nucleation criterion based on the local mismatch in dislocation density is employed. Sub-grains formed during deformation constitute the nuclei, and only those subSub-grains that have a boundary with misorientation above a threshold value can grow. The probabilistic CA is used to identify successful nucleation sites. The growth of viable nuclei depends on the difference in the stored energy of the nucleus and the stored energy of the surrounding matrix. As such, the model is developed to predict the texture of magnesium alloys that have experienced dynamic recrystallization solely from the initial texture and the applied strain path.
The model is then extended to include deformation twinning and it can then be used to study its effect on the evolution of DRX. Deformation twinning is activated when the c-axis of hexagonal close packed (HCP) crystal is under a tensile load and leads to the reorientation of the crystal by specific angle. However, rather than including both contrac-tion and extension twins, only extension twins are considered in the model due to their important role during deformation at room temperature and above. Extension twins grow during deformation at ambient temperatures and their influence on the texture formation at elevated temperatures is not well studied. Contraction twins were not included in the model because they are known to have negligible effect on the final texture of magnesium alloys due to their relatively low thickness and inability to grow. In order to investigate
the effect of the extension twins on DRX evolution, a reorientation of the entire element is performed to the dominant twin orientation before DRX is initiated. The approach is similar to the PTR scheme (predominant twin reorientation).
To validate the capability of the developed model, first, tensile simulations are per-formed on rolled AZ31 commercial magnesium alloy at 300◦C. The tensile test along the rolling direction is a slip dominated deformation. The softening behaviour as well as the final texture are compared with available experimental data. Then, in order to activate twinning, the compression test is simulated on the extruded AZ31 alloy along extrusion direction (ED). Various temperatures are simulated to investigate the effect of the twin-ning at higher temperatures. Finally, the parametric study is accomplished to examine the effect of the different parameters in the model on the evolution of DRX. The simulations with the new model show excellent agreement with experiments presented in the literature.
Acknowledgements
First and foremost, I would like to acknowledge and thank my supervisor Dr. Kaan Inal for his encouragement, support and guidance throughout my PhD. I am grateful for this opportunity to pursue my PhD degree, and without my supervisor this work would not be possible. Thank to Professor Inal, these 4.5 years of my graduate research were on a positive note.
I would like to thank Dr. Abhijit Brahme for sharing his knowledge and wisdom that helped me to overcome the challenges I faced during my graduate studies, for his guidance, advices and friendship.
I am grateful to a good friend of mine and colleague Dr. Yauheni Staraselski, who has been always out there for me when I needed, for his endorsement and great help during my PhD.
I would also like to thank Dr. Raj Mishra for his scientific input and discussions, for providing experimental data, without which this work would not be the same as it is now. I would like to thank Dr. Mohammed Cherkaoui, Dr. Michael Worswick, Dr. Mary Wells and Dr. Susan Tighe for serving on my committee and providing many helpful comments that helped in the improvement of this thesis.
I would like to acknowledge all my friends, who were like a family to me in Canada. And last but not least, I would like to thank my parents and relatives back home in Yakutia, without whom I would not be where I am today.
Dedication
Table of Contents
List of Tables x List of Figures xi Nomenclature xv 1 Introduction 1 2 Background 72.1 Crystal structure of magnesium . . . 7
2.2 Deformation mechanisms in HCP crystals . . . 8
2.2.1 Slip. . . 8
2.2.2 Deformation twinning . . . 10
2.3 Texture . . . 12
2.4 Recrystallization . . . 13
3 Literature Review 15 3.1 Crystal plasticity models . . . 15
3.2 Dynamic recrystallization . . . 16
3.2.1 Experimental Work . . . 17
3.2.2 Modelling Dynamic Recrystallization . . . 20
4 Scope and Objectives 30
5 Modeling Framework 33
5.1 Crystal Plasticity Constitutive Model . . . 33
5.2 New Dynamic Recrystallization Model: Probabilistic Cellular Automata . . 37
5.2.1 Modelling of a grain nucleation . . . 37
5.2.2 Grain growth and its kinematics during DRX. Probabilistic Cellular Automata. . . 43
5.2.3 Local behaviour of recrystallized grains . . . 48
5.3 Summary . . . 49
6 Results and Discussions 51 6.1 Dynamic recrystallization without twinning: Tensile test of Mg AZ31 alloy 51 6.1.1 Experimental data . . . 51
6.1.2 Initial material and finite element discretization . . . 52
6.1.3 The simulation results . . . 52
6.1.4 Conclusions . . . 65
6.2 Dynamic recrystallization with twinning: The Role Of Deformation Twin-ning In Modeling DRX . . . 65
6.2.1 Modelling procedure . . . 66
6.2.2 Experimental and input data . . . 68
6.2.3 The simulation results . . . 68
6.2.4 Conclusions . . . 83
7 Effect Of The Model Parameters On DRX 84 7.1 Critical conditions for the DRX initiation and nucleation . . . 84
7.2 Effect of the grain boundary mobility on texture evolution . . . 89
7.3 Conclusions . . . 91
9 Future Work 96
Appendix 98
List of Tables
1.1 Governing deformation mechanisms during DRX at different temperature ranges . . . 5
2.1 Slip and twinning systems used in the model . . . 11
6.1 Various parameters used in the current tensile simulation . . . 54
6.2 CRSS values for different temperature simulations. The strain rate is the same ˙= 10−4s−1 . . . . 72
7.1 Temperature dependent parameters of the model and their influence on the DRX evolution based on Fig.7.1. . . 85
List of Figures
1.1 Comparison of (a) beams of equal weight and (b) beams of equal stiffness
in various materials . . . 2
1.2 Application of magnesium alloys in the car . . . 3
1.3 The flow stress of magnesium alloy AZ31 deformed at various temperatures 4 2.1 Crystal structures: FCC, BCC, HCP . . . 7
2.2 Hexagonal close packed crystal axes. . . 8
2.3 Shearing on a slip system. . . 9
2.4 Main slip systems in HCP crystal . . . 10
2.5 Schematic representation of deformation twinning . . . 11
2.6 Schematic representation of the projection sphere . . . 12
2.7 Projection of hexagonal crystal orientations . . . 12
2.8 Change in microstructure during annealing of Al-0.1% Mn after 95% cold rolling . . . 13
2.9 Abnormal grain growth showing abnormally large grains along with smaller grains. . . 14
3.1 {0001}pole figure of commercial magnesium alloyAZ31 shows strong basal texture . . . 18
3.2 Experimental observation of the DRX inside of deformation twinning. . . . 19
3.3 Schematic representation of domain division for Monte Carlo method . . . 23
3.4 Schematic representation of the domain with grain boundaries in the phase-field model . . . 24
3.5 Schematic of vertex model grain boundary . . . 25
3.6 Schematic of grain boundaries in cellular automata . . . 27
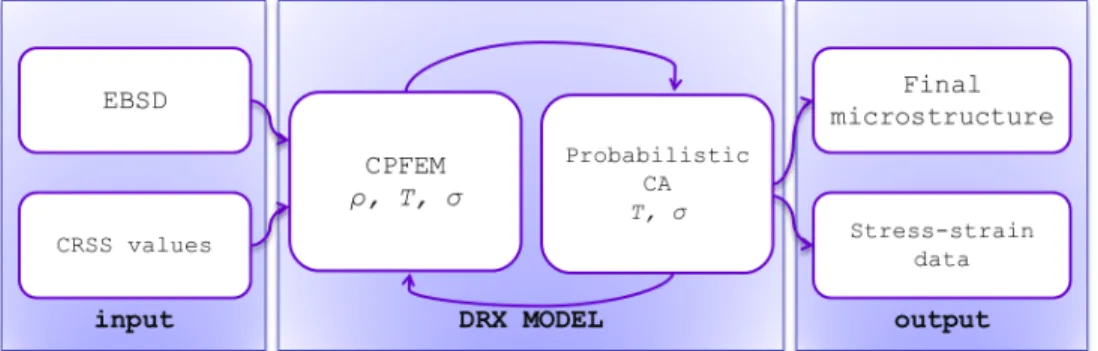
4.1 Flow chart of the coupling of CPFEM and CA . . . 31
5.1 Schematic of deformation gradient decomposition . . . 34
5.2 Schematic representation of the nucleus . . . 38
5.3 Schematic representation of the ρcr. . . 40
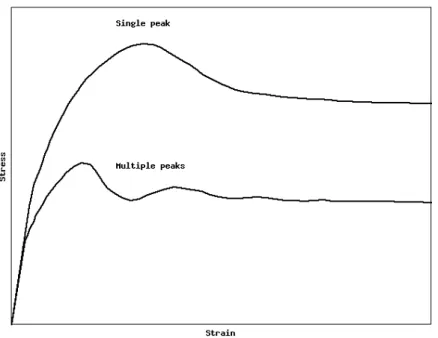
5.4 Schematic of single and multiple peaks of stress-strain curve . . . 41
5.5 An example of calibration of ρcr value. . . 41
5.6 Schematic of evolution of ρmax and ρavg. . . 43
5.7 Schematic diagram of possible distribution of mobility function depending on misorientation angle. . . 45
5.8 Defining the element and its neighbours (a) 4-point scheme (b) 8-point scheme . . . 47
5.9 The shape of the grains after simulation using (a) 4-point and (b) 8-point schemes . . . 48
5.10 True stress vs. true strain curves deformed at different temperatures for pure magnesium tensile test . . . 49
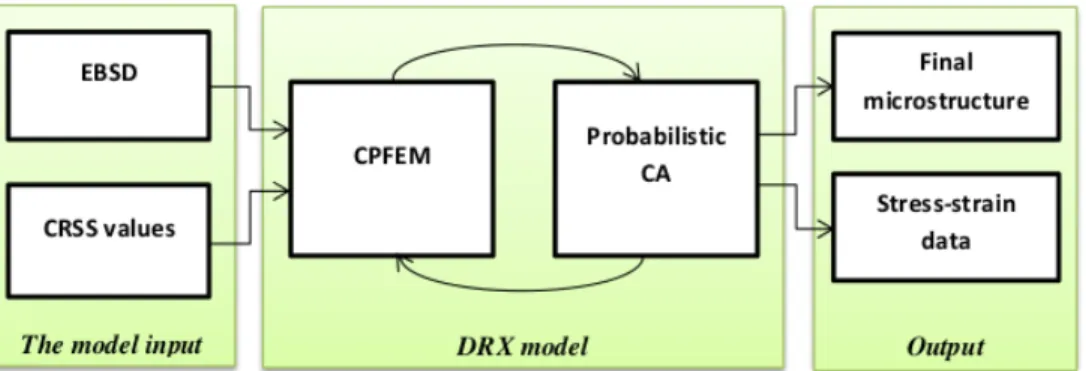
5.11 Flow chart of the coupling of CPFEM and CA . . . 50
6.1 Initial EBSD IPF map and{0001}and{10¯10}pole figures of AZ31 Mg alloy sheet with strong basal texture . . . 53
6.2 Experimental flow curve and simulation flow curve to show the point of the calibration of the CPFEM parameters. . . 54
6.3 Predicted and experimental true stress vs.true strain curve during tension test along RD at 300◦C and strain rate 5×10⁻⁴s−1. . . 55
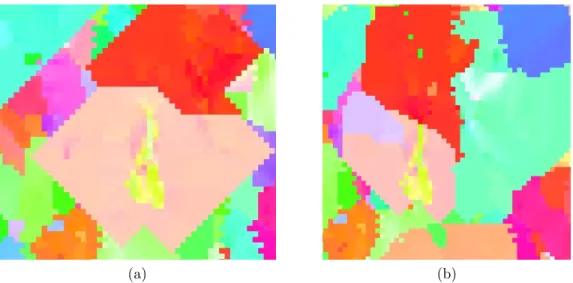
6.4 Schematic representation of growth of a few nuclei through two DRX steps 56 6.5 EBSD IPF maps of (a) Initial microstructure used as input (b) Simulated up to 35% of tensile strain without DRX (c) Final simulated microstructure after DRX . . . 57
6.6 {0001}and{10¯10}pole figures of the recrystallized sample after 35% tension (after DRX) . . . 58
6.7 Experimental {0001} and {10¯10} pole figures of the recrystallized sample after 40% tension at 400◦C, 1×10⁻³ (after DRX). . . . . 58
6.8 Distribution of the misorientation angle through the sample (a) Initial (un-deformed) and (b) Final (after DRX) . . . 60
6.9 Grain size distribution (a) initial (undeformed) and (b) final (after DRX).. 61
6.10 Normalized distribution of dislocation density over the sample (a) Initial at ∼3% strain (b) Final (after DRX). . . 62
6.11 Volume fraction of recrystallized elements obtained from the simulation.. . 63
6.12 The plot of true strain vs. true stress curves of the simulations with and without DRX on top of the evolution of the volume fraction of DRX. . . . 64
6.13 {0001} and {10¯10} pole figures after 35% tension without DRX . . . 64
6.14 Schematic of loading direction . . . 66
6.15 Schematic representation of the twin incorporation into the mesh . . . 67
6.16 Misorientation angle distribution: initial and after reorientation (degrees
<10 are excluded) . . . 67
6.17 Example of the reoriented structure: EBSD IPF maps showing initial and reoriented structure and partitioning of the twins and the matrix. . . 69
6.18 Initial texture of the extruded AZ31 Mg alloy (a) Pole figure; (b) EBSD IPF map. . . 70
6.19 Schematic of the location of HCP crystal orientations on the pole figure. . 71
6.20 CRSS values for slip systems used in the simulations for different temperatures 73
6.21 Histogram of the number of the reoriented elements and the volume fraction of the reoriented elements vs. time increment. . . 74
6.22 Experimental and simulated true stress vs. true strain curves for 200◦C . . 74
6.23 Final {0001} pole figure after DRX at 200◦C . . . 75
6.24 Simulation results of 200◦C compression (a) Slip systems activity (pyram1 and pyram2 denote pyramidal a and hc+ai systems respectively (b) Evo-lution of the volume fraction of DRX. . . 76
6.25 Experimental final {0001} and {10¯10} pole figures after DRX at different temperatures (a) 200◦C (b) 300◦C (c) 400◦C. . . 77
6.26 Experimental and simulated true stress vs. true strain curves for the ED compression at (a) 300◦C (b) 400◦C . . . 78
6.27 Slip systems activity during ED compression simulations at (a) 300◦C (b) 400◦C. . . 80
6.28 Evolution of the volume fraction of DRX (a) 300◦C (b) 400◦C. . . 81
6.29 The histogram of the grain size distribution: initial and final after DRX at three simulated temperatures. . . 82
6.30 Final {0001} pole figures after DRX at (a) 300◦C (b) 400◦C. . . 82
7.1 Schematic of the influence of the model parameters on different regions of a flow curve . . . 85
7.2 Final DRX pole figures for the different values of c2 in theρcr . . . 87
7.3 Stress-strain curves for different values of c2 (dρcr =const). . . 88
7.4 Volume fraction of recrystallized elements for different values of c2 (dρcr =
const). . . 88
7.5 Final EBSD IPF maps after DRX for the different values of C0 in thedρcr. 90
7.6 Volume fraction of recrystallized elements during the simulations for the different values of C0 in the dρcr. . . 91
7.7 Final DRX pole figures for the different values of C0 in thedρcr. . . 92
7.8 Schematic of mobility functions used in the study (a) step function; (b) one peak function. . . 93
7.9 Crops from the final full EBSD samples after simulations with different mobility functions (a) step function (b) one peak function . . . 93
Nomenclature
˙γ(α) rate of shear strain on α slip system ˙
f(β) the rate of the volume fraction of twinning system β γa accumulated shear on all the slip systems
µ shear modulus
ωswitch switching parameter
Ω spin tensor ρα
GN(e) edge part of the geometrically necessary dislocations (GNDs) density ραGN(s) screw part of the geometrically necessary dislocations (GNDs) density ραGN geometrically necessary dislocations (GNDs) density
σ Cauchy stress
τ dislocation line energy
τ(α) resolved shear stress on the slip systemα τc critical resolved shear stress (CRSS)
θ misorientation angle ξ random number b Burgers vector
F deformation gradient
F∗ elastic part of deformation gradient Fp plastic part of deformation gradient
fβ volume fraction of twinning system β
Hm activation enthalpy
h(0) initial hardening rate of the slip system h(αβ) latent hardening matrix
h(β) hardening rate of the slip system K constant of the order 10
L dislocation mean free path M grain boundary mobility M0 pre-exponential factor
m(α) plane normal vector of slip systemα N switching variable for nucleation n hardening exponent
Ns number of slip systems
Ntw number of twin systems P stored deformation energy
S grain boundary energy per unit area s(α) direction vector of slip systemα T rotation matrix of the element v velocity
D strain rate L velocity gradient
Chapter 1
Introduction
Magnesium, being the lightest of the structural metals, is receiving significant interest from automotive industry. Because magnesium is 36% lighter than aluminum, and 76% lighter than iron, while also boasting the highest strength-to-weight ratio of all the structural met-als (demonstrated in Fig.1.1), magnesium could be used to replace aluminum in vehicles [1]. By replacing aluminum parts with magnesium parts, vehicle weight can be reduced, and thus, fuel efficiency can be improved.
Currently, the amount of magnesium used in cars ranges between 14 and 26 kg saving about 20% of weight over aluminum [3]. Fig. 1.2 shows an application of magnesium products in a car, which is limited to cast alloys, and it is used in such car parts as steering wheel, transmission panel, gear box etc. The reason for the limited use of magnesium alloys in vehicles is its poor formability at room temperature caused by the low symmetry of the crystal structure and high anisotropy [4].
There are several ways to overcome this problem, the most effective of which are to use rare earth elements in the alloys [5] or to control the microstructure (grain size, tex-ture strength) [6]. The latter can be attained by high temperature deformation, which is accompanied by dynamic recrystallization (DRX).
Dynamic recrystallization takes place during hot working of metallic alloys, which can soften and restore the ductility of the metals [7]. Moreover, recrystallization can be used as a tool to control the final texture and grain size of metals, both of which play a significant role in the formability of the metals [8]. Fig. 1.3 presents an example of the flow curves obtained from tensile tests of Mg AZ31 alloy at various temperatures. At higher tempera-tures, the elongation can reach more than 100%, while at room temperature failure occurs at a strain of about 20%.
Figure 1.1: Comparison of (a) beams of equal weight and (b) beams of equal stiffness in various materials [2]
The process of dynamic recrystallization is a complex phenomenon, which occurs with migration of high angle grain boundaries driven by the stored energy associated with dislocations. DRX plays an important role in the texture formation during an elevated temperature deformation. However, the experimental methods used to provide a process-ing window for each alloy, as well as the optimal parameters needed to achieve certain characteristics for the alloy (grain size, texture strength) are both time-consuming and expensive. Therefore, the development of a numerical model, which is able to predict and investigate the effect of various DRX parameters on the texture formation in Mg alloys, is needed to save cost, at the very least. Yet, this model can also be used to compliment the experimental techniques that are currently in place.
Figure 1.3: Flow stress of magnesium alloy AZ31 deformed at various temperatures [9] In Mg alloys, DRX is observed at temperatures as low as 150◦C. Temperatures lower than 200◦C are defined as low temperatures for DRX. Table 1.1 presents the deformation mechanisms that accompany various temperature plastic deformations in Mg.
Numerous computational models to simulate DRX are available, and the most widely used models are categorized as follows: Monte Carlo, Cellular Automata, phase-field and
Table 1.1: Governing deformation mechanisms during DRX at different temperature ranges [10]
Temperature Deformation mechanisms
<200C twinning, basal slip and hc+ai pyramidal slip
200−250C cross-slip to form new grains from the subgrains (continuous DRX) 300−450C dislocation climb causes bulging of original grain boundaries and
sub-grain growth
vertex models. However, most of these are either phenomenological or have restrictions in texture prediction. Yet, the crystal plasticity theory is an established model that accounts for both the initial and the evolving texture of metals. With increasing computational resources, the crystal plasticity framework looks like an attractive tool for modelling poly-crystalline materials, because it is able to predict texture development, which is vital in modeling DRX [11].
This research project presents a new model to simulate dynamic recrystallization in HCP metals. The new model is based on a deterministic approach and employs the crystal plasticity finite element method (CPFEM). The main goal of the work is to implement a 2D computational model that is able to simulate texture evolution and mechanical re-sponse of magnesium alloys during dynamic recrystallization. The model is a hybrid of the probabilistic cellular automata coupled with the crystal plasticity finite element method. The CPFEM provides a deformation gradient, which is used then to calculate the dislo-cation density in the DRX part of the code. One of the benefits of using CPFEM is that it can obtain an inhomogeneous distribution of deformation gradient, which is essential in accurately representing the dislocation density. Moreover, the inhomogeneous distribution of dislocation density is also relevant because it can determine the nucleation sites with greater precision. The nucleation criterion employed in the model is based on the local dislocation density mismatch. The growth of the successful nuclei is determined by taking a probabilistic step by a switching parameter based on the grain boundary velocity.
The thesis has the following structure. The important terms used in the work are explained in Chapter 2, which includes the deformation mechanisms in hcp metals and also the recrystallization terms. Then, the literature review on both experimental and theoretical research on DRX is presented in the Chapter3, where the main types of DRX models are discussed with their major advantages and drawbacks. In Chapter4, the scope and the main objectives of the work are presented in detail.
In Chapter 5, the modelling framework is introduced. This Chapter is divided into three parts: first, a brief introduction to the finite element method is given, then the
crystal plasticity constitutive model for HCP materials is presented. The crystal plastic-ity formulation is based on the well-known Asaro-Needleman framework with proposed modification taking into account deformation twinning for HCP metals [12, 13, 14]. This formulation is implemented into a 2D in-house FE code.
The new model for dynamic recrystallization is presented in the next section of the chap-ter, which is also divided into three parts. First, the nucleation criteria for recrystallization is introduced along with the critical condition for DRX initiation. Second, kinematics of grain growth are given. And, third, the local behaviour of recrystallized grains is analyzed. Various challenges regarding the implementation of the method are also discussed in this chapter.
The main results and their discussions follow in Chapter 6. First, the results of the tensile simulations performed on magnesium alloy AZ31 are presented. This strain path does not involve the deformation twinning, because the c-axis is not under a tensile load, hence, twinning is unfavourable. The next results demonstrate the incorporation of the deformation twinning within the developed model. The results of the compression test simulations of extruded Mg alloy are presented for different DRX temperatures.
Chapter 7 includes a parametric study of the effect of the various model parameters on DRX behaviour. The critical conditions are investigated on their effect on the texture and stress-strain behaviour. While the mobility of the grain boundary is varied between a step function and one-peak function due to the lack of the experimental data for Mg. The effect of the functions on the microstructure evolution is examined.
Finally, conclusions and recommendations for future work are presented in Chapter 8
Chapter 2
Background
2.1
Crystal structure of magnesium
Crystal structures are divided into three types: face centered cubic crystals (FCC - alu-minum, copper etc.), body-centered cubic (BCC - steel) and hexagonal close-packed crystal structure (HCP - magnesium, titanium, zirconium etc.) (Fig.2.1). Magnesium has hexag-onal close-packed crystal structure, and hence, more complex deformation mechanisms compared to FCC and BCC metals [15].
Figure 2.1: Crystal structures: FCC, BCC, HCP [16].
In HCP crystals, there are a1, a2, a3 axes, which have 120◦ between each other and the c-axis, which is perpendicular to them (Fig.2.2). In the current framework, these axes are
transformed to the Miller orthonormal coordinate system for calculation convenience using the well-known procedure, which can be found, for instance in [17]. It should be mentioned that the ideal c/a ratio is √8/3 = 1.633 (which does not exist in any pure metals) and magnesium has ac/a ratio of 1.624, which is very close to ideal.
Figure 2.2: Hexagonal close packed crystal axes.
2.2
Deformation mechanisms in HCP crystals
In HCP metals, the major deformation mechanisms are crystallographic slip and deforma-tion twinning. A brief descripdeforma-tion of each mechanism is given below.
2.2.1
Slip
Slip is a main deformation mechanism in crystallographic materials [18]. When a load is applied, the plastic deformation proceeds by shearing on the slip system (slip plane m and direction s ) as shown in Fig. 2.3. The Schmid’s law states the condition for slip to occur (’yield’ point for crystallographic slip):
τc=±σxcosψcosφ (2.1)
Unlike fcc and bcc crystals, hcp has more complex slip systems. The major slip planes in HCP crystal are shown in Fig. 2.4. Basal slip system is the most active slip system in magnesium alloys and has the lowest CRSS value, while pyramidalhc+ai slip system has the highest CRSS at room temperature.
Figure 2.4: Main slip systems in HCP crystal
Note that each slip system, α, is defined by slip plane normal m(α) and slip direction s(α), which are orthogonal vectors.
2.2.2
Deformation twinning
Twinning is a complex deformation mechanism, when the lattice undergoes an abrupt rotation relative to specific planes [18]. The newly formed orientation is a mirrored ori-entation of the initial matrix grain. The schematic represori-entation of twinning is given in the Fig. 2.5. In HCP metals, twins can be divided into two different types: extension and contraction twins. The extension twin occurs, when the c-axis is under tensile loading, rotating the lattice by 86.6◦ degrees, while contraction twin occurs when c-axis is under compression and the rotation angle is 56.6◦.
The main difference of twinning from slip is a magnitude of rotation. Slip causes a slight rotation to the crystal lattice, while the rotation due to twinning is much larger. Another difference is that the shear displacement due to twinning is one directional, i.e. shear in one direction is not the same as in its opposite direction. Slip can occur on the specific plane in both direction.
Figure 2.5: Schematic representation of deformation twinning [18]
Table 2.1: Slip and twinning systems used in the model Slip systems {0001}h1¯210i Basal
{10¯10}h1¯210i Prismatichai {1¯101}h11¯20i Pyramidal
{1¯212}h1¯21¯3i Pyramidal hc+ai
2.3
Texture
Crystallite aggregates consist of grains, each of which has its orientation. The distribution of those orientations is usually not random [19]. A preferred orientation of the crystals in the material is called texture. It can be presented in terms of a pole figure. Fig. 2.7
presents a standard projection of the hexagonal planes on the spherical . The pole figure has equivalent 12 sections.
Figure 2.6: Schematic representation of the projection sphere [19]
Figure 2.8: Change in microstructure during annealing of Al-0.1% Mn after 95% cold rolling [22].
2.4
Recrystallization
Recrystallization is a collective term to describe the change in orientations of grains by grain boundary motion [21]. It proceeds via formation and migration of high-angle grain boundaries driven by the stored energy associated with dislocations. After plastic defor-mation, the stored energy renders a driving force for further deformation or the recovery process. Static recrystallization (SRX) happens during annealing treatment of the mate-rial, while dynamic recrystallization (DRX) occurs during plastic deformation at elevated temperatures. In Fig. 2.8, a few steps of recrystallization process are shown. As it can be seen from the final microstructure, a few grains have grown consuming the other small grains.
In the literature, dynamic recrystallization mechanisms are divided into two main types, discontinuous DRX states for nucleation and growth of high-angle boundaries; continuous DRX states for a recovery process of low-angle boundary movement consuming dislocations and forming high-angle boundaries [23].
It is known that DRX and SRX take place by the grain growth phenomenon. Normal grain growth is a process when all grains grow roughly at the same rate of boundary migration resulting with almost the same size. Abnormal grain growth is the growth of a few orientations (nuclei) at the expense of other grains. An example microstructure of abnormal grain growth is presented in Fig. 2.9. The final microstructure after abnormal grain growth is dominated by those nuclei orientations, and the sizes of recrystallized grains are much larger than the others [21].
Figure 2.9: Abnormal grain growth showing abnormally large grains along with smaller grains [24].
Chapter 3
Literature Review
3.1
Crystal plasticity models
The crystal plasticity model has been an established tool to simulate the mechanical re-sponse of a crystalline material at the grain scale. The following types of the models can be distinguished:
1. Sachs model [25] has an assumption of homogeneous distribution of the stress over all the grains in the aggregate.
2. Taylor type models[26] assume that all grains in the sample deform the same way, hence, have the same strain distribution.
3. Self-consistent models (VPSC, EPSC, EVPSC) [27][28] solve an Eshelby type problem for effective heterogeneous media in an infinite domain.
4. Crystal plasticity finite element models[29] [12][30] can account for local strain partitioning.
The Sachs model imposes the direction of stresses in every crystal (eigenvalues) to be equal to the external stress, however, the shear strain in each crystal will not be the same (based on the active slip systems), and therefore, the compatibility is violated [31]. The widely used Taylor model makes the assumption of equal deformation gradient over the polycrystalline material, implying the same deformation in each grain [26]. Although the Taylor model gives a good prediction of the texture evolution, the homogeneous distri-bution of the strain gradient makes it not suitable for dislocation density calculations.
Another approach, the visco-plastic self consistent model (VPSC) has also been used to simulate the texture evolution of polycrystals during deformation. However, this model does not take into account grain-to-grain interactions. Thus, the three approaches de-scribed above do not consider explicitly the interaction between grains in a polycrystal, and they make simplifying assumptions about either the stress or the strain distribution being homogeneous.
The so-called crystal plasticity finite element model (CPFEM) is based on the dis-cretization of the sample, and solve equilibrium of the forces and the compatibility of the displacements [11]. Crystal plasticity model formulations consist of the constitutive equations that consider the anisotropy of the grain deformation, for example, dislocation-density based models [32], mechanical twinning [33] [12][34]. One of the main advantages of the CPFEM is the ability to account for inter- and intra-grain interactions that can be used to calculate the dislocation density distribution. Since the stored deformation en-ergy comprises of dislocations, calculation of dislocation density is one of the major parts in modeling recrystallization. Thus, CPFEM has an advantage over the other models in modeling DRX.
Crystal plasticity models for hexagonal close-packed (HCP) crystal structured metals are more complicated, since HCP materials have more complex deformation mechanisms than FCC or BCC metals. Deformation twinning is one of main challenges while modeling the deformation of HCP metals using crystal plasticity models. Various approaches to incorporate twins within the crystal plasticity models were introduced by Kalidindi [12], Staroselsky and Anand [35], Van Houtte [36], Tome et al. [27]. The problem still remains as one of the ’hot topics’ in the computational materials science. In the CPFEM, deformation twinning is implemented as a pseudo-slip mechanism [12], activated based on the Schmid’s law. The volume fraction of twins is tracked during the simulations, and the stresses are calculated as a volume average in the twinned region and in the matrix separately.
3.2
Dynamic recrystallization
Numerous experimental and numerical studies have been published to investigate both dynamic and static recrystallization. This chapter gives a brief literature review of the current status of research on recrystallization problem. First, experimental works are reviewed, and then the major types of the models are listed by category. The reviewed literature is mainly for magnesium alloys, which is the primary material of this work.
3.2.1
Experimental Work
Aluminum is already well investigated and established in the automotive industry, whereas magnesium and its alloys are still being studied extensively [37]. Due to the lightweight of magnesium alloys and their potential to reduce the weight of the vehicles, the inter-est of the automotive industry is high. However, a hexagonal close-packed (HCP) crystal structure and consequent anisotropy makes magnesiums formability poor at room temper-ature. Therefore, in order to attain the ductility, magnesium alloys have to be deformed at high temperatures [38]. During the elevated temperature forming operations, dynamic recrystallization plays a significant role in the final texture formation as well as the over-all formability [39]. Therefore, there is a wide range of experimental studies on dynamic recrystallization in magnesium and its various alloys.
Deformation in magnesium alloys can be divided into slip or twin dominated deforma-tions. For example, during the tensile deformation of AZ31 alloy (pole figure is presented in Fig. 3.1) along rolling (RD) or transverse direction (TD), no prominent twinning is ob-served, while the compressive test along the same directions results in a twinning texture, whereby almost all the grains undergo twinning [40]. During the elevated temperature de-formation, non-basal slip systems are activated, namely, pyramidalhc+aislip systems that provide the additional deformation mechanism, which can suppress twinning [41] [42]. The deformation twinning is most active at room temperature, however, it was also observed during the higher temperature deformations as well [23]. Since dynamic recrystallization in magnesium alloys was reported at temperatures as low as 150◦C [37], it is important to study the effect of the deformation twinning on DRX.
There are limited works available on deformation twinning behaviour and its effect on texture evolution during DRX. The commercial magnesium alloy AZ31 was studied for DRX at different temperatures and strain rates [43,23,44]. Most of the DRX experiments reported in literature for AZ31 Mg alloy were performed under uniaxial compression, and various effects of the texture, strain rate and temperature were investigated. The initial texture ofAZ31 and deformation mode effects were studied in [45,46, 47, 48]. The exper-imental results showed that the initial texture has a significant effect on the stress-strain response as well as on the twinning behaviour at different temperatures and strain rates. It was found that deformation twinning active at the beginning of deformation can delay DRX at 300◦C. Proving this observation in another work [49], it was also concluded that
{10¯12}twins appeared at the initial stage of the deformation before DRX started and were not dominant deformation mechanisms above 200◦C. It was shown in [45] that the texture evolution is more sensitive to strain rate at 400 C in AZ31 Mg alloy, and a very small amount of twins were observed.
Figure 3.1: {0001} pole figure of commercial magnesium alloy AZ31 shows strong basal texture
In [50], the authors assumed that extension twin boundaries are highly mobile, and therefore, that they grow to thicken rather than to serve as a recrystallization site. The same assumption was made in the work by Ma et al. [51], where EBSD analysis showed the presence of twins during an extrusion of Mg AZ61 alloy at 450 C, emphasizing the importance of twins at high temperatures. The major suggestion was that at the elevated temperature extrusion,hc+aitype dislocations are generated, which can also be favourable for deformation twinning [52]. However, at the strain rates ˙ < 0.1s−1, the effect of the twinning was negligible at high temperature deformation [53]. Some elevated temperature tests also revealed very few twins [23][54] [55], which can be explained by the activation of non-basal slip systems, namely, pyramidalhc+aislip system. The authors in [10] reported active twinning, basal and hc+ai slip systems during deformation at < 200 C in ZK60 alloy. Twins were observed in TEM analysis after hot torsion at temperatures between 180−360 C and strain rates 0.01 and 1.0s−1 [43]. As the temperature decreased, the twin boundaries became less sharp and resulted in serrated boundaries.
Magnesium AZ31 alloy was tested in tension and compression at 200 C and 400 C and strain rates 0.01 and 10(−4)s−1 in [56]. Texture analysis showed that during 200 C compression test along extrusion direction (ED), most of the grains underwent twinning. The c-axis of HCP crystal was perpendicular to the compressive loading direction, which is favourable for the activation of twinning. The flow curves during the channel die compres-sion of pure Mg and AZ31 alloy revealed the plateau-type behaviour and rapid hardening at the temperatures of 200 C and 300 C and the strain rate 10−4s−1 in [57] [58]. Usually, this is a sign of active deformation twinning. In [23], the SEM plots were presented with
Figure 3.2: Experimental observation of the DRX inside of deformation twinning [23]
extension twins without recrystallization at the end of the deformation (Fig. 3.2). The reason why twins were left unrecrystallized was unknown, however, the authors suggested that they might have appeared during unloading of the sample.
In the other work by Al-Samman et al. [23], it was assumed that the deformation twinning can be a potential nucleation site for DRX, since the stored energy of twinning is higher than in the matrix, and twins also provide a high angle boundary (86◦ for extension twins). However, recrystallization that occurs inside twin lamellae was restricted within twin area, which was observed in the experimental studies of the single crystal, as in [59] for example (Fig.3.2). This observation was also confirmed by the other studies of single crystals under compression and tension at different temperatures [60, 61, 62].
Even though compression tests are reported for DRX studies, there is very little data available in the literature regarding tensile tests of AZ31 where DRX was also studied. Thus, texture evolution studies during the tensile deformations at 400 C and 500 C demon-strated that the initial weak fiber texture formed a strong texture after DRX [63]. Analysis of Schmid factors showed that {0001}h11¯20i slip system is the most active, but at larger strains, the{11¯22}h11¯2¯3islip system became the most dominant deformation mechanism. These results proved that the non-basal slip system is active at elevated temperatures.
Other experimental research on the tensile deformation of AZ31 also showed the pres-ence of non-basal hc+ai slip and the preservation of the initial wire texture [9, 64].
Recently, in [65], it was reported that, with increasing temperature and decreasing strain rate during tensile tests of magnesium alloy AM30, twinning was not the main deformation mode. Other magnesium alloys, namely those that include rare earth (RE)
metal particles were investigated to evaluate the role of particle-stimulated recrystallization (PSR) in extrusion texture[66]. Second phase particles can initiate the creation of a new orientation, different from the deformed one, and the second phase particles also seem to improve the strain hardening and formability of these alloys. Magnesium alloy ZK60 exhibited continuous dynamic recrystallization between the temperature range of 200−250 C and pre-existing grain boundary bulging mechanisms were also observed besides subgrain growth at higher temperatures [10, 67].
The three main conclusions from the experimental literature review are the following:
• At the elevated temperatures, magnesium and its alloys demonstrate the activity of non-basal slip systems, i.e. hc+ai pyramidal and prismatic.
• Twinning still plays an important role on the DRX evolution and texture formation at temperatures up to ∼300C.
• Double twins and recrystallized grains inside the twin domains are observed during DRX.
The detailed review of the experimental studies of DRX in magnesium alloys demon-strates the need for accurate models to investigate the DRX phenomenon. It is important to understand which deformation mechanisms are active and which conditions can lead to the preferred/desirable texture of the metals and/or which can restore the ductility. Moreover, there is a need in the research to study the effect of twinning during high tem-perature deformation to provide insights into the role of twinning during DRX. Since the limit of the experimental tools such as EBSD, TEM, SEM and others are not able to give full picture of DRX mechanisms, physical models can help researchers to explain various phenomena including the nucleation of DRX.
The experimental results and observations reviewed above will be used in the developing the model as well as in the calibration of the model parameters, and the model validation.
3.2.2
Modelling Dynamic Recrystallization
Recrystallization is known to be one of the main processes during the hot working of metals. Experimental techniques on their own are too time consuming and expensive to provide a processing window for each alloy. Therefore, being able to predict the behaviour of the material and microstructure evolution would provide an alternative opportunity to control various material properties [68]. Grain size control and texture development as well as un-derstanding the kinetics of grain boundary motion during plastic deformation are the main
advantages of accurate modelling of DRX [69]. However, the modelling of dynamic/static recrystallization still remains a challenging problem. As computational power increases, new tools become available for modelling DRX phenomenon such as molecular dynamics, atomistic level simulations and crystal plasticity models.
First attempts were taken in early 30s, when the analytical model was developed by Johnson and Mehl [70], Avrami [71], Kolmogorov [72], which is the so-called JMAK theory. In this model, the volume fraction of DRX was represented by an empirical equation:
fDRX = 1−exp(−ktn) (3.1)
where k is the nucleation rate function,t is the time and n is the Avrami exponent. This analytical expression describes the behaviour of the volume fraction of recrystallized grains with respect to the matrix and it is used by many researchers for model verification.
In [73], a theoretical model for subgrain growth by boundary migration during annealing was developed. The model was applied to two-phase alloys and pure metals. Another subgrain growth model was proposed later in [74] for heavily deformed aluminum. A numerical model to predict stress-strain curve during DRX was developed in [75], where the model took into account dynamic recovery as well as grain size.
However, with the development of powerful computational resources, various new nu-merical models were developed to simulate the process of recrystallization. As one can expect, each of these models has its own strengths and weaknesses. A number of overview papers are available in the literature on the modeling of both dynamic and static recrys-tallization [68, 8, 69, 76] . Accordingly, the most known models can be divided into the following groups:
• Monte Carlo models
• Phase-field models
• Vertex models
• Cellular Automata models
A brief literature review on each of these models is presented below, while a detailed overview can be found in [68, 8, 69,77].
Monte Carlo models
The Monte Carlo probability technique with application to recrystallization was used in the Potts model, which is a modified Ising model [78]. Extensive studies were performed to model recrystallization and grain growth using the Monte Carlo method in [79, 80, 81,
82, 83, 84,85, 86, 87,88, 89, 90].
In the Monte Carlo models, the domain is divided into lattice sites by a grid. The index si is assigned to each site, and this index is the same within one grain. The schematic
representation is given in the Fig. 3.3, where grain boundaries are represented with bold lines. Every lattice site is assigned its state variables. The switching parameter for the Monte Carlo step,ωswitch, depends on the energy change ∆E:
ωswitch(∆E) = 1 2ω0 1−tanh ∆E 2kTs (3.2) where ω0 is the reduced mobility between the current si and neighbouring sj sites, Ts is
the simulation temperature and k is the Boltzmann constant. According to the Monte Carlo method, a random number ξ ∈ [0,1] is generated, and the switch is accepted if ξ ≤ ωswitch(∆E); when the switch is accepted, the current site si takes an orientation of
the neighbouring site sj. The energy of the system is calculated as (consistent with Potts
model) : E = N X i=1 n X j=1 1 2γ(si, sj) +Es(si) ! (3.3) where Es is the stored energy and γ(si, sj) is the boundary energy which depends on the
state of the current sitesi and the neighbouring site sj, n is the number of the neighbours
for the current site andN is the total number of the grid sites.
Monte Carlo models are attractive with their simplicity as a numerical model, and they are relatively easy to implement. Hence, the computational costs of the model are minimal. However, since the update of the microstructure in Monte Carlo models hap-pens randomly, the process of defining correctly the nucleation sites becomes extremely important, since the final texture is highly dependent on the initial determination of the nuclei. Various nucleation models for Monte Carlo simulations were examined in [91, 92]. Another disadvantage of the model is a non-trivial correlation of the simulation time and length with physical time and length. Therefore, there is a need for scaling or matching with experimental data. Possible solutions of this problem were discussed in [93,94]. Nev-ertheless, Monte Carlo models are successfully used for grain growth problems as well as dynamic recrystallization modeling, where they showed good agreement with both
exper-Figure 3.3: Schematic representation of domain division for Monte Carlo method [68]
imental results and theory [83, 95, 96, 79] Further details on this model can be found in [69, 97].
Phase-field models
Another type of model used to simulate the recrystallization problem is the so-called phase-field models. In this model the phase-phase-field parameter ,ηk, is introduced, which represents
the fraction ofkphase. The phase-field parameter ,ηk, must satisfy the following condition: N
X
k=1
ηk = 1, whereηk ≥0,∀k
For example, ηk can represent a grain in the polycrystalline aggregate with N grains.
In that case, ηk is equal to 1 in the kth grain, and equal to 0 in the other grains. Grain
boundary is defined as a separate phase (Fig. 3.4) unlike in MC or CA models, where the boundary is not identified explicitly.
The method is computationally expensive, since it is based on the minimization of the energy, which is represented as a functional of the phase-field variables and their gradients. Therefore, the model is usually limited to 2D applications, however, a modified phase-field model was implemented to allow simulations of recrystallization problems in 3D [98].
Figure 3.4: Schematic representation of the domain with grain boundaries in the phase-field model [77]
A multi-phase-field model for dynamic recrystallization (MPF-DRX) was employed in [99], where the deformation of the grain was taken into account by resizing the grid. Their results of single grain growth simulations were in good agreement with theory.
A comparative study of phase-field modeling with Potts model for a grain growth prob-lem was performed in [100]. Both models gave very similar results. Phase-field modeling studies can also be found in [101, 102,103].
Vertex models
Vertex models (otherwise called front tracking models) were developed for curvature-driven grain growth problems. Comparing to MC or CA models, where the curvature of the grain boundary cannot be well described, vertex models have an advantage of introducing a deterministic grain boundary [104].
In this method, grain boundaries are considered as line segments and connected with vertices. Vertices are located at triple junctions (2D) and assumed to be in equilibrium. A grain boundary is described by its velocity v, which depends on the grain boundary mobility µand the grain boundary energy γ [77]:
Figure 3.5: Schematic of vertex model grain boundary [77]
whereT is the temperature, θ is the misorientation andk is the grain boundary curvature. The triple points are moved to the directions perpendicular to the plane at each time step depending on the transformation rules that are defined. The angles of the nodesφi can be
found from: γ1 sinφ1 = γ2 sinφ2 = γ3 sinφ3
where γi are the grain boundary energies. The detailed formulation of the kinematics
included in the vertex models can be found in [105].
This technique was used to simulate grain growth problems in [106, 107], while the stored energy along with mobility of grain boundaries was combined in [104] for cold rolled copper, and thus, they were able to model primary recrystallization as well. Simulation results showed good match with experimental data.
Even though the methodology is computationally expensive, 3D vertex models were also implemented and compared with 2D models [108]. The comparison showed that there is a deviation in a small grain size distribution, but 2D model was proved to be valid for the grain growth problems in thin films [109].
Finally, vertex model can also be used to simulate particles or solutes included in the microstructure, treating them as points at the nodes [97].
Overall, the vertex model is an attractive technique to simulate grain growth with improved representation of grain boundary curvature. However, it is not commonly used as MC or CA models because of its complexity of defining the kinematics of the movement of the nodes, as well as translation rules [68].
Cellular Automata
Cellular automata (CA) was first introduced by von Neumann for Turing automata [110]. Later, it was adopted for recrystallization problems [111]. CA method, when applied to recrystallization problems, is based on the discretization of time, physical space, and orientation space. Each discrete cell has its own state variables, which define the current status of the cell. Often dislocation density and crystal orientation are used as state variables in recrystallization problems. CA can be defined on the two- or three-dimensional lattice considering the first, second, and third order neighbor for the calculation of the local driving forces, while an initial state is assigned to represent the microstructure. An illustration of the grain boundary determination is presented in Fig.3.6. The state of each cell depends on the state of the neighbouring cells by a transition rule.
In recrystallization problems, a cell will be recrystallized if any neighbouring cells were recrystallized before [77]. The state of the entire aggregate is updated simultaneously, unlike in Monte Carlo models, for which the update of each site occurs randomly. The so-called deterministic CA switches the state of a cell by replacing the neighbor cells depending on the rate equation, however, the probabilistic CA calculates the switching probability of each cell and makes the switching based a probabilistic step [111]. Switching parameters are generally used as a function of the previous state of a cell and the state of the neighboring cells.
CA is defined as a general algorithm with a possibility to use a wide variety of state variables and transition rules. Therefore, it is an attractive candidate for modeling recrys-tallization problems. Another advantage of the CA models is that they are computationally simple while modeling physical processes [111].
One of the major problems with the CA models is the correlation of simulation time with real time, similar to MC models. However, CA has been successfully used in the materials science problems such as recrystallization [112, 112, 113, 114, 115,116,117].
Since a simulated area in the CA is discretized, a finite element can be coupled to model a real microstructure. If the time-scaling is calibrated correctly, the finite elements can represent cells. This is one of the main advantages of coupling CPFEM and CA [112].
Figure 3.6: Schematic of grain boundaries in cellular automata [118] Phenomenological and Crystal Plasticity models
The available models are not limited to the list above, and there are various other ap-proaches to model DRX. The main drawback of most of them is that they are phenomeno-logical, so the flow stress is represented by some empirical equations.
In the overview [68], level set models are mentioned for recrystallization problems. In this method, the boundary curvature is defined as an interface, which doesn’t have to be tracked. However, the mesh used in the method should be fine enough, which causes computational inefficiency. Nevertheless, the level set method was coupled with crystal plasticity to model static recrystallization in [119]. Another use of this method was presented in [120] for modeling multiple junction movement.
Crystal plasticity models coupled with other methods can be used to simulate recrystal-lization problem. The ability of such models to account for texture development and local strain partitioning is the main advantage of using them. However, crystal plasticity models require significant computing power, which makes these models less available. In the liter-ature, crystal plasticity finite element method (CPFEM) along with other models has been used to model static/dynamic recrystallization. [99, 121, 122, 123, 124, 112, 125]. Thus, CPFEM coupled with phase-field models to simulate recrystallization problem was
pre-sented by Takaki et al. [99, 121, 122], where the Kocks-Mecking (KM) equation was used to calculate dislocation density evolution giving the initial value to all the grid points. Furthermore, the macroscopic stress was related to the average dislocation density by Bailey-Hirsch equation. Potential nucleation sites were based on the critical value of the dislocation density and depending on the nucleation rate of the unit area per grain bound-ary, nuclei were placed randomly. In the works of Radhakrishnan et al. [123,124], CPFEM was coupled with Monte-Carlo method. A new nucleation criterion based on the assump-tion that nucleaassump-tion occurs potentially in the areas with high recovery rate was developed and implemented into a coupled mesoscale model to simulate the deformation and recrys-tallization in fcc and bcc bi-crystals and polycrystals.
Brown and Bammann [126] proposed a phenomenological plasticity model that is ca-pable of simulating both static and dynamic recrystallization. No critical condition for nucleation was employed, rather, the volume fraction of recrystallized material was as-sumed to evolve according to the empirical equation. The model showed the ability to predict single and multiple peaks behaviour of the flow stress of the copper at different temperatures and strain rates. However, the microstructure evolution was not presented in this work.
Another approach to model DRX was presented by Xiao et al. [127]. In this work, CA was coupled with a topology deformation technique to take into account the effect of the grain topology change on microstructure evolution during DRX. The dislocation density was uniformly distributed in each grain, and the nucleation criterion based on the critical amount of dislocation density was implemented. The microstructure evolution was modeled depending on the plastic deformation of recrystallization grains with different initial crystallographic orientations. This model is not a finite element model, and no real microstructure was used for simulations.
The recent work of Li et al. [125] proposed a crystal plasticity model to simulate DRX in a two-phase titanium alloy. In this study, the grains were assumed to have a spherical shape and consisted of matrix (M-grain) and recrystallized grain (R-grain). Dislocation density was calculated depending on the volume average of M and R grains separately, and a nucleation criterion based on the critical value of the dislocation density was employed. Nucleation rate depended on the temperature and strain rate as well as the radius of the nuclei and M-grain to account for the effect of the nucleation site. Since the M and R grains were based on the volume fraction of the spheroidal grains, the model was not capable of modeling real microstructure evolution.
CPFEM coupled with cellular automata (CA) model with probabilistic switching rule was presented previously by Raabe and Becker [112] to simulate static recrystallization in aluminum alloys. In their work, CPFEM was used to deform the material, and the final
microstructure and accumulated shear strain were then used as input to the CA model for the recrystallization problem. Even though this model provided valuable insight to static recrystallization phenomenon, its application to simulate DRX is not straight forward since modeling DRX would require a synchronous coupling between CPFEM and CA.
3.3
Summary
An overview of the current state of literature has been introduced in this Chapter. Exper-iments on dynamic recrystallization, mainly on magnesium alloys are analyzed to form the basis of a numerical model. In particular, deformation twinning behaviour at elevated tem-peratures has been reviewed. Also, the main types of models to simulate recrystallization problems have been introduced with a brief description of each approach.
In order to model DRX, first, dislocation density has to be introduced. While the exist-ing models use empirical equations to calculate the evolution of dislocation density, there are very few models that use a deterministic approach. The main challenge in the calcula-tion of the dislocacalcula-tion density is accounting for grain interaccalcula-tions, because the dislocacalcula-tion density is related to the gradient of plastic deformation with distance, therefore, it requires the information from neighbours. Therefore, CPFEM has an advantage over the other grain-scale models, since it is based on the discretized sample and provides neighbouring elements’ data. Moreover, crystal plasticity models can simulate microstructure evolution during deformation, which is another reason CPFEM is suitable to model DRX. Another important phenomenon that has to be captured during DRX simulations is the softening behaviour of stress-strain curve, for which the Kocks-Mecking equation is widely used in the literature. The Johnson-Mehl-Avrami-Kolmogorov empirical equation is used in the literature to simulate the evolution of DRX. Thus, most DRX models involve empirical equations.
The literature review of the existing models shows that models that can predict both microstructure evolution as well as softening behaviour of the flow stress during DRX with-out phenomenological expression, are rare. Most models use phenomenological expressions to calculate some components of DRX modeling. While phenomenological models can be used to investigate separate aspects of DRX, there is a need in a mechanism based DRX model for HCP metals in order to provide information on the DRX process and study the effects of various parameters (such as nucleation growth rate, critical conditions) on DRX evolution.
Chapter 4
Scope and Objectives
Modelling the DRX phenomenon is a challenging problem mainly due to its multiscale nature, as it involves the effects of the impurities, precipitation, dislocation motion, move-ment of the grain boundaries etc. Moreover, DRX is widely accepted as a problem, which is not completely deterministic due to the concurrency of the grain boundary motion and the complexity of the solutions from dislocation based mechanics (such effects as interactions between boundaries during recrystallization can have more than one stable state solutions [128]). The main scope of this research is to investigate the effect of different microstruc-tural features and deformation mechanisms on DRX evolution including softening in the flow curve and texture formation. Also the work aims to provide some insights into the material’s behaviour during DRX. Thus, the main objectives of the current research are to:
1. Develop a mechanism-based predictive model that can capture microstructure evolu-tion and stress-strain response during DRX in HCP materials using as input EBSD data and strain path. The model consists of the crystal plasticity finite element method and the DRX block. The DRX block, in turn, includes Cellular Automata with a nucleation criterion.
2. Incorporate deformation twinning into the model and investigate its effect on the final microstructure after DRX.
3. Validate the model (final texture, flow curve) with the available experimental data:
• Slip based deformation (tensile test of AZ31 alloy).
4. Study the effect of the various parameters in the model on the results (threshold values for nucleation criteria, grain boundary mobility).
Detailed objectives:
1. The model is a hybrid model, which couples CPFEM with probabilistic cellular au-tomata. The 2D crystal plasticity finite element code is developed for HCP metals. The CPFEM can account for experimental measurements like grain size, shape, tex-ture as well as experimental flow stress measurements and critical resolved shear stress to accurately predict deformed state at each time step. The CPFEM is used to calculate state variables such as dislocation density, crystal orientation, velocity and then, it is then passed to the DRX block. A brief flow chart of the input/output of the model is presented in Fig.4.1.
Figure 4.1: Flow chart of the coupling of CPFEM and CA
The DRX block consists of the probabilistic cellular automata (CA) model and the ki-netics of DRX. The CA formulation uses the state variables to determine the location of nuclei and their growth. The state variables are dislocation density, orientation of the grain, and recrystallization state. The probabilistic switching rule is employed for the growth of the recrystallized grains, which is based on the velocity of the grain boundary.
DRX proceeds by way of the grains’ nucleation and the subsequent growth of the nuclei. Therefore, one of the most important parts of modelling DRX is to determine nucleation of DRX. In this work, a new nucleation criterion has been developed based on the local mismatch in dislocation density. No assumption is made about the location of the successful nucleation sites, and it is calculated purely from the local grain orientations and the deformation states. This criterion can be implemented only
if the real microstructure is employed as input, since it is based on the inhomogeneous distribution of the dislocation density within a grain and across the grain boundary (which can be predicted by CPFEM). The nuclei form from the subgrains, which develop high angle grain boundaries during the deformation from the low angle grain boundaries. The nuclei have the same orientation as the matrix grain, and a new orientation is not generated during this process. Therefore, a random texture cannot be formed from a strong initial texture.
The proposed model couples CPFEM and CA to work synchronously, and a new method is presented to address the complicated problem of time and length scaling. A parameter ∆tDRX is introduced, the value of which can be calculated based on the
finite element size. The finite elements coincide with CA cells; therefore, the cells are represented by elements, eliminating the need to map the data from one model to the other. The element size in the model is the same as EBSD step size, which usually varies from 2 to 5 microns. The effect of second phase particles, solid solutions and other precipitates is not taken into account in the model. The framework can be used to model dynamic recrystallization in any single-phase metals.
2. The model is extended to incorporate deformation twinning, which is one of the major deformation mechanisms in HCP metals. The effect of the twin orientations on the final texture after DRX is studied by reorienting an element to the dominant twin orientation before DRX starts. The reorientation procedure is similar to the PTR scheme offered by Tome et al. [27].
3. The model is validated using available experimental data. First, tensile test is simu-lated on Mg AZ31 alloy, which has a strong basal texture. The tensile load is applied in the rolling direction (RD), when the deformation is dominated by basal and pris-matic slip systems. Then, a compression test is preformed on the extruded Mg alloy, when twinning is a favourable mechanism. The slip and twinning systems’ activities are analyzed during the deformation at various temperatures. The final DRX texture and the softening behaviour is then validated.
4. The developed model involves a number of parameters that affect the results of the simulations, and their influence needs to be studied. Thus, the main parameters of the model are the critical conditions used for DRX initiation and grain nucleation. Also, the grain boundary mobility curve is varied between the step function and one-peak function due to the lack of the experimental data for Mg.
Chapter 5
Modeling Framework
In this chapter, the modeling framework is presented. First, the crystal plasticity consti-tutive model is briefly introduced, and then, the new DRX model is proposed.
5.1
Crystal Plasticity Constitutive Model
A new in-house finite element code based on the crystal plasticity theory is developed. The well-known framework of Asaro and Needleman [129] with the assumption of pseudo-slip to simulate twinning [12] is employed in this model. The formulations presented below can also can be found in [13], where the same framework was used to implement a Taylor-type model for HCP metals. However, in order to model the recrystallization problem, there is a need in the neighbouring of the grains, which can be attained using finite element mesh. The grid provides the possibility to calculate a dislocation density, which is an incompatibility of the deformation between the neighbouring elements. This is one of the major reasons why the crystal plasticity finite element method (CPFEM) is chosen.
The crystallographic slip and deformation twinning mechanisms considered in the model are presented in Table2.1. A lattice undergoes plastic deformation by elastic deformation and rigid body rotation (Fig.5.1).
The deformation gradient can be expressed as:
F =F∗Fp (5.1)
where F∗ includes elastic deformation and rigid body rotations, while Fp represents
be specified by:
s∗(α) =F∗s(α), m∗(α) =m(α)F∗−1 (5.2) The velocity gradient is written as:
L= ˙F∗F∗−1+F∗( ˙FpFp−1)F∗−1 (5.3) Symmetric and antisymmetric parts of the relations5.3give a strain rate, D, and so-called spin, Ω, which can also be divided into elastic and plastic parts:
D=D∗ +Dp,Ω = Ω∗+ Ωp (5.4)
For computational simplifications, symmetric and skew-symmetric tensors for slip sys-tems are calculated as follows:
P(α) = 1 2 s∗(α)⊗m∗(α)+m∗(α)⊗s∗(α) (5.5) W(α)= 1 2 s∗(α)⊗m∗(α)−m∗(α)⊗s∗(α) (5.6) whereα denotes the slip system. Hence, the plastic strain rate and spin can be presented respectively as: Dp = 1− Ntw X β=1 f(β) ! "Ns X α=1 P(α)γ˙(α)+ Ntw X β=1 P(β)f˙(β)γtw # + Ns X β=1 " fβ Ns X α=1 (P(twβα) γ˙(twβα)) # (5.7) and Ωp = 1− Ntw X β=1 f(β) ! "Ns X α=1 W(α)γ˙(α)+ Ntw X β=1 W(β)f˙(β)γtw # + Ns X β=1 " fβ Ns X α=1 (W(twβα) γ˙(twβα)) # (5.8)
wherefβ is the volume fraction of twinning systemβ and ˙f(β)is its rate,γtw is shear strain on twinning systems and ˙γ(α) represents shear rate on the slip system α. Ns and Ntw correspond to number of slip systems and number of twin systems respectively.
The shear rate and rate of twinning are given by the following power-law equations: ˙ γ(α) = ˙γ(0)sgnτ(α) τ(α) g(α) 1/m (5.9) ˙ f(β) = ˙ f(0) γtwsgnτ(β) τ(β) g(β) 1/m (5.10) where τ(α) is the resolved shear stress on the slip system α, and is calculated as τ(α) = P(α) :σ ,g(α) is the hardness of the slip system, where the evolution can be calculated by the hardening law:
˙ g(α) = X β h(αβ) γ˙(β) (5.11)
where h(αβ) is the hardening moduli:
h(αβ) =q(αβ)h(β)(no sum onβ) (5.12) where h(β) is a hardening rate of the slip system andh(αβ) is the latent hardening matrix. The hardening rate is given as follows:
h(α)=h(0) h(0)γa τ(α)n + 1 n−1 +h1 (5.13)
whereh(0) is the initial hardening rate of the slip system,n is the hardening exponent and γa is the accumulated shear on all the slip systems:
γa = Z t 0 Ns X α=1 |γ(˙ α)|dt (5.14)
Finally, the Cauchy stress is calculated as a sum of stresses in the matrix and in the twinned region: σ= 1− Ntw X β=1 f(β) ! σmt+ Ntw X β=1 f(β)σtwβ (5.15)
The deformation twinning affects the deformation gradient by the rotation of the lattice. An initial transformation matrix was proposed by Van Houtte [36], considering m as a
![Figure 1.3: Flow stress of magnesium alloy AZ31 deformed at various temperatures [9]](https://thumb-us.123doks.com/thumbv2/123dok_us/1442020.2693097/21.918.197.737.389.792/figure-flow-stress-magnesium-alloy-deformed-various-temperatures.webp)
![Figure 2.8: Change in microstructure during annealing of Al-0.1% Mn after 95% cold rolling [22].](https://thumb-us.123doks.com/thumbv2/123dok_us/1442020.2693097/30.918.133.799.149.351/figure-change-microstructure-annealing-al-mn-cold-rolling.webp)
![Figure 3.2: Experimental observation of the DRX inside of deformation twinning [23]](https://thumb-us.123doks.com/thumbv2/123dok_us/1442020.2693097/36.918.199.735.144.397/figure-experimental-observation-drx-inside-deformation-twinning.webp)
![Figure 3.4: Schematic representation of the domain with grain boundaries in the phase-field model [77]](https://thumb-us.123doks.com/thumbv2/123dok_us/1442020.2693097/41.918.296.636.140.463/figure-schematic-representation-domain-grain-boundaries-phase-field.webp)
![Figure 5.7: Schematic diagram of possible distribution of mobility function depending on misorientation angle [7].](https://thumb-us.123doks.com/thumbv2/123dok_us/1442020.2693097/62.918.254.671.145.477/figure-schematic-possible-distribution-mobility-function-depending-misorientation.webp)