The Role of Technical Efficiency & Productivity Evolution
in Port Development:
An application to Caribbean Small Island Developing
States (SIDS) ports
SHELLY-ANN JULIEN BROWN
A thesis submitted in partial fulfilment of the requirements of
Edinburgh Napier University, for the award of
Doctor of Philosophy
ABSTRACT
Economic growth has continually remained an objective of every nation, particularly for lesser-developed countries such as the Small Island Developing States (SIDS). According to an UNCTAD (2014) report on “Small island developing States: Challenges in transport and trade logistics,” one way of attaining economic growth is by focusing attention on tackling the challenges faced by transport and trade logistics (UNCTAD, 2014).
Given the unique characteristics of SIDS nations, notably high import content, insularity, geographic remoteness and small economies, populations and areas, all of these factors emphasize the importance of having “well-functioning, reliable, sustainable and resilient transportation systems, in particularly the maritime sector for SIDS development and international trade survival” (UNCTAD, 2014).
Such policies would be consistent with what is generally referred to as ‘supply led’ economic development, where improvements in transport related infrastructure result in economic growth (Cowie, 2010). Such an approach assumes there is a latent demand for a country/region’s produce, but this is being prevented from being exploited, because of inefficiencies in, or a lack of adequate port infrastructures and human resources.
These challenges constitute a key policy concern for the sustainable development of SIDS’ ports and become not only a port concern but a national concern, as directing adequate funding to improving port efficiency, has become a top priority (UNCTAD 2014). For instance, according to the United Nations (UN), “benchmarks need to be established to monitor and improve port performance…”(UNCTAD, 2014), while SIDS such as the Caribbean Community (CARICOM) aim to improve their maritime sector, claims that “…enhancing the maritime sector has the potential to fuel CARICOMs trade, increase port productivity and generate significant cost savings…” (CARICOM, 2013).
This research aims to measure, analyse and compare port efficiency and productivity over a ten-year period (2001-2011), on 69 seaports, using non-
parametric DEA based tests. The primary focus is on the Caribbean SIDS (referred as the Caribbean for abbreviation purposes), benchmarked against top ports. This is investigated from the realm of how port policy and development strategies have affected efficiency and productivity over time. This research attempts to present greater insight into SIDS ports, with reference mainly to the Caribbean, whilst the approach can become a springboard, implemented on other port types and regions of the world. Additionally, its practical contribution may become a better guide for international (UNCTAD), regional (CARICOM) and country level decision makers.
Evolutionary technical efficiency and productivity for the Caribbean’s Small Island Developing States (SIDS) ports, during the period 2001-2011 are evaluated. Moreover, the region’s port development initiatives are assessed over the same period. Top ports received an average efficiency of 72%, outperforming the overall 66% average for Caribbean ports as was expected. Interestingly enough, efficiencies for top ports decreased on average by 0.5% per annum over the decade, whilst increases of up to 0.7% were found for Caribbean ports. Moreover, the region’s productivity grew by 3.2%, compared to their larger top counterparts, of up to 2% per annum.
This research concludes that trade volumes play an integral part in affecting efficiency and productivity. Additionally, given port development initiatives, the Caribbean’s progresses in efficiency/productivity has been mainly the effects of scale and technical progress respectively. Since these ports are usually smaller scale and yield lesser throughput (compared to their larger counterparts), when they begin to grow, the focus is on enlarging their production scales, however, this is at the expense of adjusting internal practises.
Compared to TOP ports, increases in productivity is solely the consequence of technical progress. Since these are usually larger scale ports and so likely yield more throughput, will likely be operating at the size of decreasing returns to scale. This suggests, that they are not properly focusing on internal practices and sizing their production scales to accommodate the rise in technical progress.
The research findings can potentially influence decisions made by local and regional authorities in the Caribbean, when it comes to port development initiatives, as it provides an overview of efficiency/productivity, but more so that which impedes these progresses.
ACKNOWLEDGEMENTS
“5Trust in the LORD with all your heart,
And lean not on your own understanding;
6 In all your ways acknowledge Him,
And He shall direct your paths.” Proverbs 3:5-6 (NKJV)
After three long years, I can certainly say that my thesis could not be a success without complete trust in God. It is because of Him, I had the opportunity to connect with reputable and distinguished individuals in and outside of my research. Their knowledge and advice have undoubtedly shaped my thesis, as well as my personal development. I could not have done it without their input, and for this may God bless them richly, for,”whoever brings blessing will be enriched, and one who waters will himself be watered.” (Proverbs 11:25-26, NKJV) (Nelson, 1995).
Furthermore, my supervisors have played a very crucial role in my accomplishment, together with Professor Tom Rye. Associate Professor Jason Monios (Director of Studies) and Dr. Johnathan Cowie (second Supervisor), stepped up tothe challenge, enabled and gained this successful PhD completion. Jason’s maritime knowledge, timely insistence, and caring personality, helped me to become more positive and confident about my research. While Johnathan’s economics/statistical background and technical expertise challenged my findings, and caused me to think much more critically. Their unique gifts, I must say, have together obtained a well- rounded thesis and academic researcher.
Moreover, this life achievement could not have been possible without the love and support of my loving husband- Nathan Brown, parents- Anselm (my primary motivation since day one of my university years) and Sandra Julien, sister- Gillian, nieces- Raeann and Renelle, In- laws- Sharon, Rudy, Frank, Urshula, Rhys, Ira, Leoni and Quinton, and my church family- Destiny Church, Edinburgh, including Louise Sarah Waqas, and the Foot Soldiers Enforcers Ministry, Faith Centre in Trinidad. I am deeply grateful for their prayers, encouragements, and financial support throughout the years. Additionally, I acknowledge the Government of the Republic of Trinidad and Tobago and am forever thankful to them for granting me this open
scholarship and opportunity to pursue my PhD.
Becoming a Doctor of Philosophy is one of the greatest accomplishments in my life. It is an honoured title, which I have always desired attaining, and while I did not know how it would happen, God saw my end from my beginning and called it into being. So, to God be the glory, for great things He has done. I am most grateful to see this journey come to pass, and look forward to the next season of my life where God will take this accomplishment and myself.
TABLE OF CONTENTS
ABSTRACT ... ii
ACKNOWLEDGEMENTS ... v
TABLE OF CONTENTS ... vii
LIST OF TABLES ... xii
LIST OF FIGURES ... xiv
LIST OF ABBREVIATIONS ... xvi
CHAPTER 1 INTRODUCTION ... 1
1.1RESEARCH BACKGROUND ... 1
1.2RESEARCH HYPOTHESES... 3
1.3METHODOLOGY ... 4
1.4IMPACT AND RELEVANCE OF THE RESEARCH FINDINGS ... 5
1.5STRUCTURE OF THE THESIS ... 6
CHAPTER 2. OVERVIEW OF THE CARIBBEAN ECONOMIES & PORTS ... 9
2.1INTRODUCTION ... 9
2.2THE CARIBBEAN ECONOMY ... 15
2.2.1Macro Economy ... 15
2.2.2Micro Economy ... 22
2.3INTERNATIONAL AND REGIONAL TRADE REGIME ... 24
2.3.1Patterns and Partners of Trade ... 24
2.3.2Trading Arrangements ... 28
2.4INTERNATIONAL TRADE RELATED PRIORITIES FOR ACTION ... 37
2.4.1Goal 1: Upgrading Key Economic Infrastructure ... 38
2.4.2Goal 2: Enhancing Competitiveness and Trade ... 40
2.4.3Goal 3: Deepening Regional Integration and Maximizing External Trade Agreements ... 41
2.5TRAFFIC THROUGHPUT AND MAJOR MARKETS OF THE CARIBBEAN ... 42
2.6THE CARIBBEAN’S PORT COMPOSITION ... 46
2.6.1Categorization of Caribbean Ports ... 46
2.6.2Port Management Models ... 51
2.7REPORTED HINDRANCES TO CARIBBEAN PORT DEVELOPMENT ... 55
2.8CONCLUSION ... 60
CHAPTER 3. THE ECONOMIC APPROACH TO CONTAINER PORTS ... 61
3.1INTRODUCTION ... 62
3.2THE PORT SYSTEM, ADMINISTRATION MODELS & BENEFITS OF CONTAINER PORTS ... 61
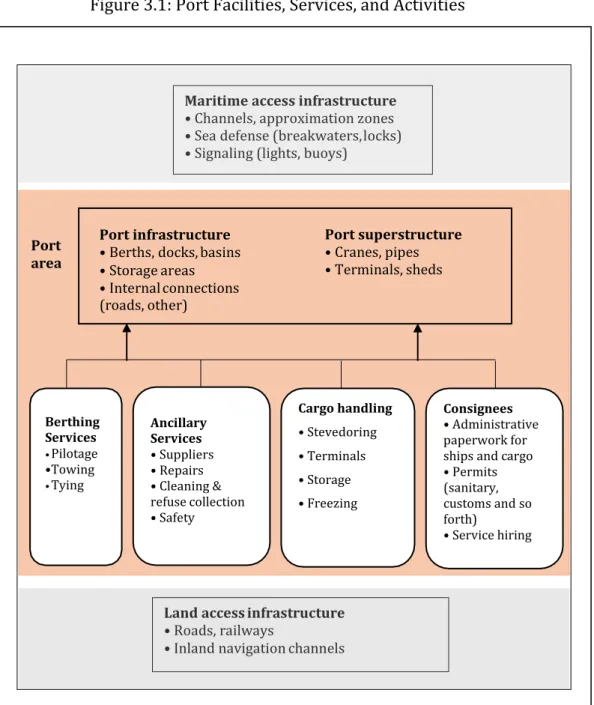
3.2.1The Port System (Facilities, Services, Activities) ... 61
3.2.2Port Administration Models ... 65
3.3EVOLUTION AND TREND OF CONTAINER PORTS ... 67
3.4PORT PLANNING AND DEVELOPMENT ... 70
3.5CONCLUSION ... 75
CHAPTER 4. PRODUCTION THEORY AND PORT EFFICIENCY: LITERATURE REVIEW ... 76
4.1INTRODUCTION ... 76
4.2PRODUCTION TECHNOLOGY & FUNCTION ... 77
4.3THE ECONOMIC CONCEPT OF TECHNICAL EFFICIENCY ... 81
4.4CONTEMPORARY METHODS OF TECHNICAL EFFICIENCY MEASUREMENT ... 84
4.4.1Data Envelopment Analysis ... 87
4.4.2Free Disposal Hull ... 97
4.4.3Corrected Ordinary Least Squares (COLS) ... 98
4.4.4Stochastic Frontier Approach ... 99
4.4.5Summary ... 101
4.5PORT TECHNICAL EFFICIENCY ANALYSIS WITHIN THE CONTAINER PORT INDUSTRY ...102
4.7CONCLUSION ... 111
CHAPTER 5. METHODOLOGY ... 113
5.1INTRODUCTION ... 113
5.2EFFICIENCY MEASUREMENT SYSTEM ... 113
5.3APPLICATION OF THE EFFICIENCY MEASUREMENT SYSTEM ... 117
Step 1: Identify the units/roles and objectives ... 118
Step 2: Initiate a Pilot exercise ... 119
Step 3: Choose Output Factors ... 122
Step 4: Choose Input Factors ... 122
Step 5: Collect data ... 124
5.3.1 Summary ... 124
5.4MODEL SPECIFICATION ... 125
5.4.1Efficiency Estimation ... 125
5.4.2Malmquist Productivity Index Parametric Estimation ... 129
5.4.3Testing for Statistical Difference in DEA Estimated Efficiencies ... 130
5.4.4Constant Returns to Scale or Variable Returns to Scale Efficiencies? ... 131
5.5CONCLUSION ... 132
CHAPTER 6. SUMMARY STATISTICS, EMPIRICAL RESULTS AND ANALYSIS ... 133
6.1INTRODUCTION ... 133
6.2EVOLUTIONARY PORT TRAFFIC & SUMMARY STATISTICS ... 133
6.3EMPIRICAL ANALYSIS ... 142
6.3.1Technical Efficiency Analysis ... 143
Technical Efficiency per sample ... 143
Technical Efficiency per sub group ... 145
Technical Efficiency per port ... 149
Data and Preliminary Tests ...153
Analysis of the Malmquist Index Summary of Annual Means… ... 154
Analysis of the Malmquist Index Summary per Sub-Group...158
Analysis of the Malmquist Index Summary per Port… ...164
6.4HYPOTHESIS TESTING ...169
6.5CONCLUSION ...173
CHAPTER 7. DISCUSSION OF RESULTS AND REFLECTION ON PORT DEVELOPMENT IN THE CARIBBEAN ...175
7.1INTRODUCTION ...175
7.2VALIDATING RESEARCH HYPOTHESES ...175
7.3IMPLICATION OF RESULTS ...182
7.4PORT DEVELOPMENT INITIATIVES IN THE CARIBBEAN ...183
7.4.1Recent Port Development Initiatives ...184
7.4.2Port Development Recommendations by Donor Organizations ...191
7.5 CONCLUSION ...194
CHAPTER 8. CONCLUSION, RECOMMENDATIONS, LIMITATIONS, AND AREAS FOR FURTHER RESEARCH ...195
8.1SUMMARY OF RESEARCH AND CONTRIBUTIONS ...195
8.2RECOMMENDATIONS ...200
8.2.1Legislation ...200
8.2.2Modernisation ...201
8.2.3Information Technology...202
8.2.4Regional Port Information Centralisation: Data and Research ...204
8.2.5Regional Logistics & Supply Chain: Data and Research… ... 205
8.2.6Labour Training/ Reformation ...206
8.2.7Private/Public Port Partnership ...208
8.4AREAS FOR FURTHER RESEARCH ...211
APPENDICES ...213
Appendix 1 Value of Imports and Exports by CARICOM countries: 2000- 2012 Current US$ Million ...213
Appendix 2 CARICOM Export and Import Volume Index 2000-2013 ...215
Appendix 3 Travel & Tourism Total Contribution to Gross Domestic Product (% share) ...217
Appendix 4 CARICOM Intra and Extra Regional Trade as a % of Total CARICOM Trade ...218
Appendix 5 CARICOM Intra- regional Imports & Exports 2000-2012 US$ Million ...219
Appendix 6 CARICOM Extra-regional Imports & Exports: 2000- 2012 US$ Million ...221
Appendix 7 Primary Data for 69 ports investigated………..223
Appendix 8 Sample ports per Sub-group ...242
Appendix 9 Mathematical Programming for Efficiency Measures ... .243
Appendix 10 Descriptive Statistics per annum using CRS & VRS estimates for the entire sample ...246
Appendix 11 Efficiency and Productivity Change per sub-group ...249
REFERENCES ...250
LIST OF TABLES
Table 1.1 Thesis Structure ... 8
Table 2.1 Caribbean Economies ... 14
Table 2.2 Structure of CARICOM Economies ... 24
Table 2.3 Free Movement Initiative and Level of Compliance ... 35
Table 2.4 Goals for CARICOM Trade Strategy ... 38
Table 2.5 Quality of Port Infrastructure Global Competitiveness Index ... 40
Table 2.6 Caribbean Maritime Concentration Ratio ... 44
Table 2.7 Global, Regional and Local Orientation Hub Ports of the Caribbean, Central and South America Littoral ... 48
Table 3.1: Port Administration Models ... 66
Table 4.1: Literature Review of Container Port Technical Efficiency: DEA ... 106
Table 4.2: Examples of Reviews on Malmquist Productivity Index in Port Technical Efficiency ... 109
Table 6.1: Port Traffic Growth per Sub-Group... 136
Table 6.2: Container Port Traffic Growth/Exports (US$M)) (20012011)… ... 136
Table 6.3: Summary Statistics per Sub-Group (2001-2011) ... 138
Table 6.4 Evolutionary Port Trend- Traffic and Inputs ... 140
Table 6.5: Evolutionary Port Trend- Traffic and Inputs: TOP vs. CARI ports ... 141
Table 6.6 Summary Statistics of Port Efficiency estimates according to DEA- CCR and BCC models ... 143
Table 6.7 Summary Statistics of Port Efficiency estimates per Sub-group According to DEA- CCR and DEA-BCC models ... 145
Table 6.8 Average Technical Efficiency ranking per port under DEA-CCR model… ... 151
Table 6.9 Average Technical Efficiency ranking per port under DEA-BCC model… ... 152
Table 6.10 Descriptive Statistics-Malmquist Index Decomposition ... 155
Table 6.11 Malmquist Index Summary Decomposition of Total Factor Productivity (2001-2011) ... 156
Table 6.12 Malmquist Index Summary Decomposition of Total Factor Productivity by per subgroup (average 2001-2011) ... 159
Table 6.13 Malmquist Index Summary Decomposition of Total Factor Productivity per port (average 2001-2011) ... 167
Table 7.1 Aid for Trade to CARICOM, USD millions (2009) ... 184
Table 7.2 Main Developments for Caribbean Ports and Enhancing Efficiency ... 185
Table 8.1 Information Technology in Caribbean ... 203
LIST OF FIGURES
Figure 2.1 Geographical Location of the Caribbean Region ... 13
Figure 2.2 CARICOM Rate of Growth of GDP: MDC & LDC ... 16
Figure 2.3 OECD/CARICOM Rate of Growth of GDP ... 16
Figure 2.4 CARICOM Av. Rate of Inflation (%) p.a. ... 18
Figure 2.5 Rate of Inflation (%) p.a. per country ... 18
Figure 2.6 CARICOM Trade Sector Contribution to Gross Domestic Product (2012) ...19
Figure 2.7 Trade Contribution to Gross Domestic Product per country (2012) ...20
Figure 2.8 CARICOM Export and Import Volume Index ... 21
Figure 2.9 Export and Import Volume Index per country (2013)... 21
Figure 2.10 CARICOM Total Imports and Exports ... 25
Figure 2.11 CARICOM Intra-regional Trade (US$ Mn) ... 27
Figure 2.12 CARICOM Extra- regional Trade (US$ Mn) ... 28
Figure 2.13 Geographical Location of CARICOM Countries3……….………..…32
Figure 2.14 Caribbean Region Containerized Traffic ... 43
Figure 2.15 CARICOMs Top Ten Export Trading Partners (2012)... 45
Figure 2.16 CARICOMs Top Ten Import Trading Partners (2012) ... 45
Figure 2.17 Caribbean Region Transhipment Hub Ports Throughput ... 49
Figure 2.18 Caribbean Transhipment: Market Share ... 50
Figure 2.19 Caribbean Transhipment: Transhipment Incidence ... 50
Figure 2.20 Port Management Models of Caribbean Ports ... 54
Figure 2.21 Main Bottlenecks in Port Efficiency per country ... 59
Figure 3.1: Port Facilities, Services, and Activities ... 64
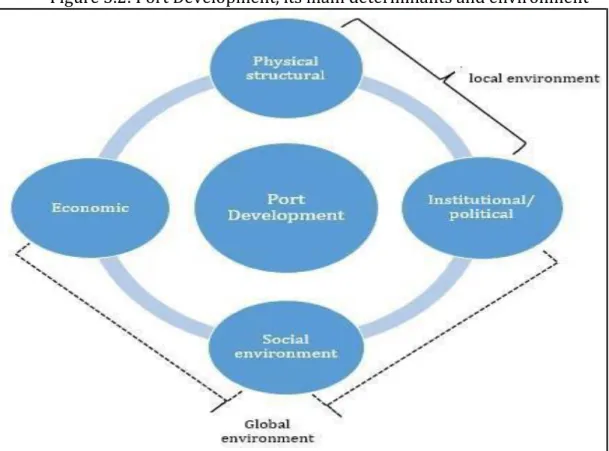
Figure 3.2: Port Development, its main determinants and environment ... 72
Figure 3.3: Horizontal and Vertical accumulation processes for Port Development ...73
Figure 3.4: Port Development and its main determinants ... 74
Figure 4.1 Total, Average and Marginal Product Curves ... 79
Figure 4.2 A General shaped Isoquant Curve ... 80
Figure 4.3 Input- Oriented and Output- Oriented Measures of Technical Efficiency (M=1, N=1) ... 82
Figure 4.5 Output - Oriented Measure of Technical Efficiency (N=2) ... 83
Figure 4.6 Alternative Approaches to Efficiency Measurement ... 86
Figure 4.7 CCR- Efficiency Production Frontier ... 90
Figure 4.8 BCC- Efficiency Production Frontier ... 91
Figure 4.9 Port practices for sources of efficiency gains ... 94
Figure 4.10 FDH- Illustration ... 98
Figure 5.1: Performance Measuring System ... 114
Figure 6.1 Port Market Share per Sub-Group in 2011 ... 134
Figure 6.2 Port Market Share per Sub-Group (2001-2011) ... 134
Figure 6.3 Caribbean Container Port Traffic and Exports (US$ Million) (2001-2011) ... 137
Figure 6.4 Container Port Traffic Contribution per port (2001-2011) ... 137
Figure 6.5 Evolutionary Technical Efficiency using DEA-CCR & DEA-BCC (2001-2011) ...144
Figure 6.6 Port Efficiency estimates per Sub-group according to DEA- CCR/ BCC ... 145
Figure 6.7 Evolution of Technical Efficiency per Sub-group applying DEA- CCR (2001-2011) ... 148
Figure 6.8 Evolution of Technical Efficiency per Sub-group applying DEA- BCC (2001-2011) ... 149
Figure 6.9 Effch, Sech and Pech- Radar Plot Sub-Group comparison... 162
Figure 6.10 Evolutionary Average Total Factor Productivity Growth per port (2001-2011)... 165
Figure 7.1 Development Vision of Caribbean Ports… ... 189
LIST OF ABBREVIATIONS
AGV Automated Guided Vehicles AP Average Product
ASYCUDA Automated System for Customs Data BCC Banker, Charnes and Cooper Model CAGR Compound Annual Growth Rate CARI Caribbean
CARICOM Caribbean Community
CDB Caribbean Development Bank CCR Charnes, Cooper and Rhodes Model COLS Corrected Ordinary Least Squares CRS Constant Returns to Scale
CSME Caribbean Single Market and Economy DEA Data Envelopment Analysis
DMU Decision Making Unit DRS Decreasing Returns to Scale EDI Electronic Data Interchange EFFCH Efficiency change
FP Fractional Programming GDP Gross Domestic Product
IADB Inter-American Development Bank
ICT Information and Communication Technology IRS Increasing Returns to Scale
IT Information Technology
LAC Latin America and the Caribbean LDC Lesser Developed Countries LP Linear Programming
MDC More Developed Countries MEC Managerial Efficiency Change MES Minimum Efficient Scale
MLE Maximum Likelihood Estimation MPI Malmquist Productivity Index
MRTS Marginal Rate of Technical Substitution MP Marginal Product
NCARI Non-Caribbean ports
OECS Organisation of Eastern Caribbean States. OLS Ordinary Least Squares
OSIDS Other Small Island Developing States PCS Port Community System
PE Port Efficiency
POS Port of Spain
PPF Production Possibility Frontier SE Scale Efficiency
SECH Scale Efficiency change SFA Stochastic Frontier Analysis SIDS Small Island Developing States
SLASPA Saint Lucia Air and Sea Ports Authority TECHCH TECHNICAL CHANGE
TFP Total Factor Productivity
TFPCH Total Factor Productivity change TOP Top World Ports
TOS Terminal Operation Systems TP Total Product
UN United Nations
UNCTAD United Nations Conference on Trade and Development UNECLAC United Nations Economic Commission for Latin
America and the Caribbean VRS Variable Returns to Scale
CHAPTER ONE
INTRODUCTION
1.1
RESEARCH BACKGROUND
Economic growth has continually remained an objective of every nation, particularly for lesser-developed countries such as the Small Island Developing States (SIDS). Economic growth is an increase in real output, resulting in higher average incomes. This means consumers can enjoy more goods/services and a better standard of living, firms can employ more workers to increase their production, which results in lower levels of unemployment, investments increase and more opportunities for more research and development, and the government enjoys higher tax returns (therefore reducing the country’s debt), and public services can improve. According to an UNCTAD (2014) report on “Small island developing States: Challenges in transport and trade logistics,” one way of attaining economic growth is by focusing attention on tackling the challenges faced by transport and trade logistics (UNCTAD, 2014).
Given the unique characteristics of SIDS nations, notably high import content, insularity, geographic remoteness and the smallness of economies, populations and areas, all of these factors emphasize the importance of having a “well- functioning, reliable, sustainable and resilient transportation systems, in particularly the maritime sector for SIDS development and international trade survival” (UNCTAD, 2014). Such policy would be consistent with what is generally known as ‘supply led’ economic development, where improvements in transport related infrastructure result in economic growth (Cowie, 2010, 2017; Merkert and Cowie, 2017a). Such an approach assumes there is a latent demand for a country/region’s produce, but this is prevented from being exploited due to the inefficiencies in, or a complete lack of, transport infrastructure.
Additionally, today’s seaports are confronted by a fast evolving global market place which includes extensive business networks, complex logistics systems, increasing vessel sizes and global terminal operators (Notteboom, 2007).
Therefore, lack of upgrading existing port facilities and services to meet this change in the industry, insufficient port financing for capital and maintenance projects, inadequate maintenance and management, and insufficiently skilled workforce, can hinder actually port efficiencies (CARICOM, 2013).
These challenges constitute a key policy concern for the sustainable development of SIDS’ ports and become not only a port concern but a national concern, as directing adequate funding to improving port efficiency, have become a top priority (UNCTAD 2014). For instance, according to the United Nations (UN), “benchmarks need to be established to monitor and improve port performance…”(UNCTAD, 2014), while SIDS such as the Caribbean Community (CARICOM) aim to improve their maritime sector, claims that “…enhancing the maritime sector has the potential to fuel CARICOMs trade, increase port productivity and generate significant cost savings…” (CARICOM, 2013).
While significant research has been conducted in the area of port efficiency and productivity over the years, none has been applied to the specific challenges faced by the SIDS ports. However, in recent times, three studies have analysed port efficiency and productivity in the Caribbean. Wilmsmeier et al.. (2013b) analysed the evolution of container terminal productivity and efficiency of 20 terminals in Latin America and the Caribbean (LAC) and Spain during the period 2005–2011. Serebrisky et al.. (2016) tested the efficiencies of 63 LAC ports representing 90% of cargo handling during 1999-2009. Suarez-Aleman et al.. (2016) investigated the regional differences in developing countries’ ports, including 64 LAC ports from 2000-2010. While key lessons have been drawn from these researches, this thesis builds on these papers by analysing Caribbean island ports in their context as SIDS ports, within the global sample of SIDS ports located throughout the world. This research therefore seeks to build on the recent work (Wilmsmeier et al.., 2013; Serebrisky et al.., 2016; Suarez-Aleman et al.., 2016), with primary focus on SIDS. It will also contribute to the existing literature on port efficiency and productivity, by looking at how and which factors influence these ports’ performance. Furthermore, it also brings a practical contribution to the future
development of SIDS ports, as is the agenda of local, regional (CARICOM), and international organizations (the UN).
This analysis centres on a comparison between the world’s top ports, ports of Central and South America, and the Caribbean and other SIDS. Given the importance of trade to Caribbean, this research will show the changes in the region and if it has kept pace or not compared to the progress of top ports and changes in international trade. A decomposition of productivity change in the form of efficiency and technical changes will be further investigated, while exploring the contributors of port efficiency.
1.2
RESEARCH HYPOTHESES
The primary research question of this investigation will seek to answer the question: “How has the technical efficiency and productivity of Small Island Developing States ports progressed over the last decade, due to port development opportunities?”
The research question will be answered by first proposing the following research hypotheses derived from a reading of the literature:
Efficiency:
Hypothesis 1: Under Constant Returns to Scale (CRS) measures, there has been no change in general port efficiency over the last decade.
Hypothesis 2: Given the effects of returns to scale, under Variable Returns to Scale (VRS) measures there has been a general improvement in port efficiency over the last decade.
Hypothesis 3: Caribbean ports are less efficient than TOP ports, but more efficient than Other Small Island Developing States (OSIDS) ports.
Productivity:
Hypothesis 4: Total Factor Productivity (TFP) in the port sector has been positive over the last decade, and most of this have been driven by technical progress (TC) and not efficiency change (EC).
Hypothesis 5: Over the whole period, Caribbean ports have experienced higher TFP changes than TOP ports, and most of this is because of efficiency change (EC) rather than technical progress (TC).
Hypothesis 6: Over the whole period, Caribbean ports have experienced higher scale efficiencies in comparison to TOP ports.
1.3
METHODOLOGY
Approach to Measuring Efficiency and Productivity
A formal definition of technical efficiency provided by Koopmans (1951; p.60) states that a decision making unit is fully efficient if and only if it is not possible to improve its output for a given level of inputs or decrease any of its input for a given level of output (Koopmans, 1951; Cooper et al.., 2007). Debreu (1951) and Farrell (1957) introduced two special cases of measuring technical efficiency- the input and output oriented approaches. With an input orientation, the output vector is fixed and calls a feasible input vector technically efficient if, and only if, no reduction in any input is feasible. On the other hand, an output oriented measure holds the input vector fixed and calls a feasible output vector technically efficient if, and only if, no increase in any output is feasible.
Over the past few decades, a number of methods used for measuring technical efficiency have been put forward, which are primarily centred on estimation of the production possibility frontier (discussed in the following chapters). Two main groups are those based essentially on the use of linear programming techniques, and those based on econometric measurement.
To date, however, within the literature on transport related studies there exists no academic research that justifies the best approach to measuring technical efficiency and productivity. Despite this, drawing from past research and particularly from within the maritime industry, the methods which are most commonly used. For purposes of this research, the Data Envelopment Analysis (DEA) will be employed, as it measures both efficiency and productivity changes, given panel data.
linear programming to measure the relative efficiency of a decision-making unit (DMU). The frontier is obtained by identifying the highest potential output given different input combinations, and the degree of efficiency is measured using the distance between the observation and the frontier (Liu 2010).
The DEA efficiencies are tested under the assumptions of constant returns to scale (CRS) and/or variable returns to scale (VRS), applying the CCR and BCC models respectively. The CRS assumption is only appropriate when all firms are operating at an optimal scale. Here the DMU is operating where an increase in inputs results in a proportionate increase in the output levels. With the VRS, an increase in inputs does not only result in the possibility of a constant change in the outputs (CRS) but is also characterized by increasing returns to scale (IRS) (output increases by more than that proportional change in inputs), and decreasing returns to scale (DRS) (output increases by less than that proportional change in inputs).
Furthermore, applying the DEA- based Malmquist Productivity Index (MPI), tests for productivity change overtime. This approach comprises of temporal (here, year on year) changes in technical efficiency (the catch up effect brought about by managerial best practises (pure effect) and investments in new facilities and/or expansion of existing facilities (scale effect)) and technology (frontier shift effect resulting from technological progress) over the entire period of investigation. This approach helps in not only identifying the change in productivity overtime, but also in identifying the main and secondary causes of the effects of technical efficiency on productivity (Nishimizu and Page, 1982; Grifell and Lovell, 1993; Estache et al.., 2004; Cheon et al.., 2010).
1.4
POSSIBLE IMPACT AND RELEVANCE OF THE RESEARCH
This research aims to explore the economic theories behind container port efficiency. Trends in total factor productivity are analysed by investigating its components: technical change and efficiency change, given a decade’s worth of data. This approach was undertaken, as this is one key component known to influence the port’s progress and development. The research applies the foundational micro-economic theory of production, which
produces a well-informed rationale leading to policy recommendations that can guide local, regional and international decision makers.
This research presents a framework that seeks to measure, analyse, and compare port efficiency and productivity over a ten-year period. This will be looked at from the perspective of how port policy and development strategies have affected efficiency and productivity over time.
The answers to the research hypotheses and emerging findings can contribute to the formulation of port policies in the SIDS region, as to the appropriate need for port investment or lack thereof. Policy recommendations can therefore provide input to the policy decisions of international (UNCTAD), regional (CARICOM) and country level decision makers.
1.5
STRUCTURE OF THE THESIS
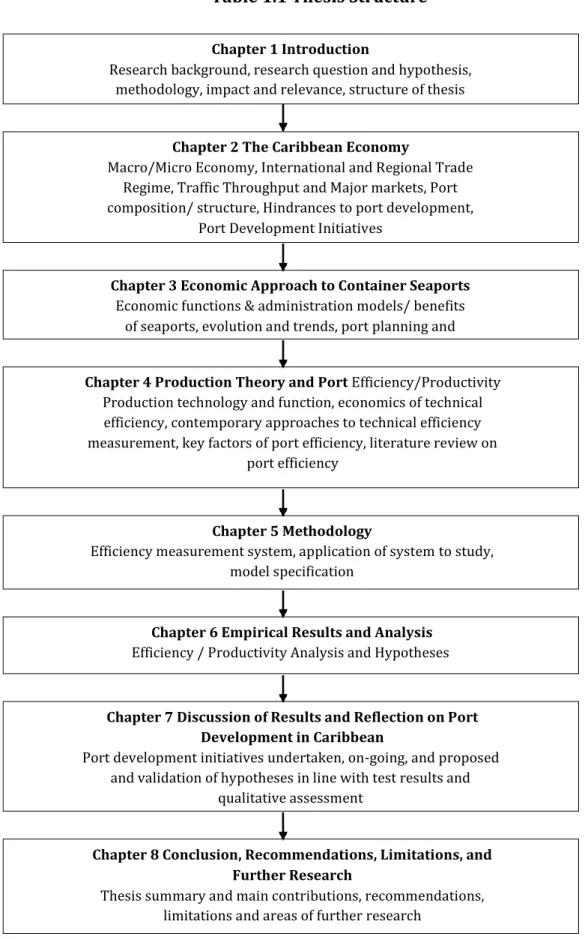
Following on from the introduction in Chapter 1, the structure of this thesis is depicted in Table 1.1 and as follows:
Since the Caribbean region is the primary focus of this research, Chapter 2 presents an overview of the Caribbean community. This gives much insight into the region’s international and regional trade, trading arrangements, port operations and traffic, and hindrances to the ports’ performance. This allows greater insights into the region, before empirical analysis begin in the following chapters. Lastly, the region’s development initiatives undertaken over the years concerning internal and external projects, donors, ongoing projects and future proposals, will be explored.
Chapter 3 takes an economic approach to discussing the operations, economic functions of container ports and their advancement over the centuries. Lastly, literature pertaining to port planning and development is reviewed to see how technical efficiency has come to play an integral part of the port’s development. Thereafter, chapter 4 presents a literature review on production theory, its applicability to port efficiency and previous research conducted. Moreover, the
available contemporary approaches to measuring technical efficiency/productivity and their uses in the container port industry are reviewed. Among others, this includes Data Envelopment Analysis (DEA). Thereafter the chapter explores the key factors influencing the operations and so efficiencies of seaports, and delves into the use of various tests employed by previous authors in testing for technical efficiency. This chapter provides a methodological foundation which will be used for further empirical analysis and testing of the technical efficiencies of container ports in the subsequent chapters.
The methodology aspect is considered in Chapter 5. This chapter presents an efficiency measurement system, which is a powerful tool for evaluating performance. The system is used as a framework for the units of analysis and sets the way for empirical analysis in the next chapter. This chapter includes identifying the units, recognising and justifying the choice of output and input factors, data sources and collection and the approaches used in measuring technical efficiency.
In Chapter 6 the empirical results, descriptive statistics and analysis are reported and critically discussed, while lastly hypotheses are validated. Chapter 7 discusses the results in the context of recent port development initiatives undertaken and future proposed for Caribbean ports. These results then lead into chapter 8 where a summary of the overall research is presented, followed by policy recommendations derived from the research. Finally, limitations of the research are discussed and the opportunity for further research is suggested.
Table 1.1 Thesis Structure
Chapter 1 Introduction
Research background, research question and hypothesis, methodology, impact and relevance, structure of thesis
Chapter 2 The Caribbean Economy
Macro/Micro Economy, International and Regional Trade Regime, Traffic Throughput and Major markets, Port composition/ structure, Hindrances to port development,
Port Development Initiatives
Chapter 3 Economic Approach to Container Seaports
Economic functions & administration models/ benefits of seaports, evolution and trends, port planning and
Chapter 4 Production Theory and Port Efficiency/Productivity
Production technology and function, economics of technical efficiency, contemporary approaches to technical efficiency measurement, key factors of port efficiency, literature review on
port efficiency
Chapter 5 Methodology
Efficiency measurement system, application of system to study, model specification
Chapter 6 Empirical Results and Analysis
Efficiency / Productivity Analysis and Hypotheses
Chapter 7 Discussion of Results and Reflection on Port Development in Caribbean
Port development initiatives undertaken, on-going, and proposed and validation of hypotheses in line with test results and
qualitative assessment
Chapter 8 Conclusion, Recommendations, Limitations, and Further Research
Thesis summary and main contributions, recommendations, limitations and areas of further research
CHAPTER TWO
OVERVIEW OF THE CARIBBEAN ECONOMIES & PORTS
2.1
INTRODUCTION
The Caribbean, having derived its name from one of the main indigenous groups of inhabitants referred as the Carib, is known for its tropical climatic attributes of ‘sun, sea and sand.’ The region is geographically situated within the territories of the south east of North America, east of Central America and to the north of South America while the expanse of waters surrounding the region includes the North Atlantic Ocean, the Caribbean Sea and the Gulf of Mexico.
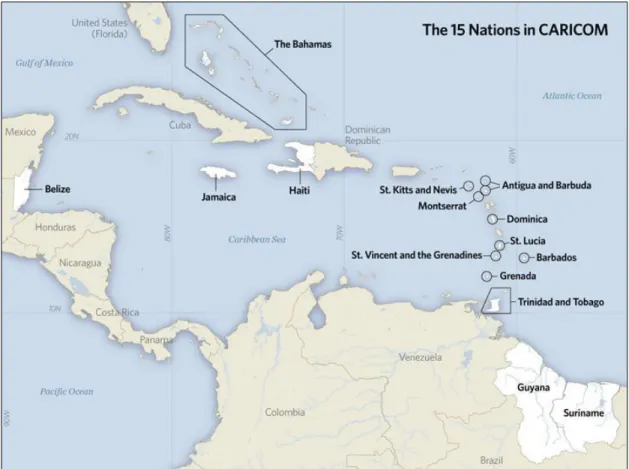
Given this regions’ physiography, its locality has allowed it to reap the advantages of maritime transport along the major transatlantic trade routes. It is mostly covered by sea and contains approximately 700 islands which are situated roughly between the latitudes 10˚ to 27˚N and longitudes 57˚ to 87˚W spanning the furthermost nations of the Bahamas in the north, Trinidad and Tobago to the south, Barbados in the east and the Cayman islands to the west (Nkemdirim 1997) (see Figure 2.1).
Among these 700 islands, most of which are uninhabited, thirty-one nations are populated; of these, thirteen countries have assumed independent status while eighteen of the other islands remain under the sovereignty of an authority by European nations such as the United Kingdom, France or the Netherlands.
Of these, twelve Caribbean islands are members of the fifteen CARICOM countries. Internationally classified by the UN as SIDS, and stipulated under the Revised Treaty of Chaguaramas Act, the More Developed Countries (MDCs) of CARICOM are The Bahamas, Barbados, Jamaica, and Trinidad and Tobago, while the Less Developed Countries (LDCs) comprise the rest of CARICOM. These are distinguished based upon the countries’ standards of living as MDCs display higher levels of growth and development than LDCs (CARICOM 2001, UN 2012) (see Table 2.1). 1
Over the past decades there have been substantial migration of Caribbean citizens to the developed nations primarily host nation the United States of America. In anticipation of better living standards for the emigrant and remaining local household, remittances have become a major source of revenue for the region. In 2013 remittances (i.e. local emigrants living abroad sending money back home to their family) were recorded at US $9billion compared to two decades ago when it was below US$2billion (Maldonado 2013, Sampson & Branch-Vital 2013).
This alarming level has benefitted the region in areas of poverty reduction, economic growth and development and balance of payment improvements. While this is so, it has not come without adverse effects resulting in the “brain-drain effect” as nationals migrate in search of better living opportunities carrying with them expertise and knowledge (Connell & Conway 2000). This has been the main reason, but not the only one, that has contributed to the steady decline in the region’s population over the past decade of above 30% at approximately 21 million in 2013 (World Bank, 2014a).
Every economy within the region remains unique, with respect to its culture, geographic size and economic structure. Its cultures have long been influenced by its past colony traditions which originate primarily from the British, French, Dutch and Spanish. These colonial powers governed the way in which each country’s economic affairs and institutional frameworks were planned and implemented and still today has left a lingering effect on independent states. Additionally, the influxes of labourers in the nineteenth century from Africa and Asia have resulted in elements of African and Indian traditions. Overall many influences have rendered the Caribbean culture multi-ethnic and multi-diverse concerning its culinary arts, artistic styles and general way of living.
Given each country’s relatively small geographic sizes, the United Nations has classified the region within its generic classification of SIDS among other south sea islands. The Caribbean’s size, together with its narrow natural resource endowments, high import content, vulnerability to natural disasters and economic shocks, remoteness, and high emigration, accounts for its lower level of economic growth than developed nations.
Furthermore, the region’s economic structures are dependent upon its unique resource endowments. The Bahamas, Barbados, the Organization of Eastern Caribbean States (OECS) (see Table 2.2); obtain their main source of income from the tourism industry (service industry). Jamaica, Belize, and the Windward Islands (viz Grenada, Martinique, Saint Lucia, Saint Vincent and the Grenadines) pride themselves in the agriculture sector (banana, sugar, spices, cocoa, alcohol: rum). On the other hand, Trinidad and Tobago receives most of its revenues from the energy industry (petroleum, oil). Furthermore, the strategic locality of Jamaica and the Bahamas affords the benefits of being global hub ports, while Trinidad and Tobago functions as the Caribbean’s regional hub port.
Achieving full regional integration via the Caribbean Single Market and Economy (CSME) has become a milestone for the region since the 1990’s and become fully established in 2015. The organization consists of twelve member states with nine countries from CARICOM (see Table 2.1). CSME and its objectives will be elaborated on in section 2.3.2.
Given the countries’ distinctive characteristics and similar setbacks, regional integration is expected to improve the development of the region by enlarging markets, diversifying production and trade which will bring the region economies of scale since independent small markets limit opportunities for this (UNECLAC 2014). The current challenges include the effects of brain- drain and lack of technological advancements resulting in lower factor inputs and productivity, substandard competitiveness, poor institutional quality, weak private sector, macroeconomic instability, and heavy reliance on donor nations.
In light of globalization and trade liberalization, these concerns present a major problem for the improvement of the region’s economic activities, in particular those relating to international trade due to its heavy contribution to economic output. In light of this, CARICOMs seaport industry, which is predominantly the lifeblood through which goods and services flow, must be at the competitive edge where superior value is offered over its near neighbours, or be forced out of the market.
This chapter will present an overview of the Caribbean community. This gives much insight into the region macro and micro economies. Particularly, it’s substantial dependence upon international trade, various trading arrangements, and so port operations/ traffic. Moreover, several hindrances to port performance. These all present further insight into the Caribbean port industry, which will aid in adequate policy recommendations later on.
Figure 2.1 Geographical Location of the Caribbean Region
Table 2.1 Island Caribbean Economies
COUNTRY STATUS ADMINISTERING
AUTHORITY CARICOM MDC LDC OECS CSME
ANGUILLA United Kingdom √
ANTIGUA &
BARBUDA Independent √ √ √ √
ARUBA The Netherlands
BAHAMAS Independent √ √
BARBADOS Independent √ √ √
BERMUDA United Kingdom
BONAIRE The Netherlands
BRITISH VIRGIN ISLANDS
United Kingdom √
CAYMAN
ISLANDS United Kingdom
CUBA Independent
CURACAO The Netherlands
DOMINICA Independent √ √ √ √ DOMINICAN REPUBLIC Independent GRENADA Independent √ √ √ √ GUADELOUPE France HAITI Independent √ √ JAMAICA Independent √ √ √ MARTINIQUE France
MONTSERRAT United Kingdom √ √ √
PUERTO RICO United States
SABA The Netherlands
SAINT
BARTHELEMY France
SAINT KITTS
AND NEVIS Independent √ √ √ √
SAINT LUCIA Independent √ √ √ √
SAINT MARTIN France
SAINT VINCENT & THE GRENADINES
Independent √ √ √ √
SINT
EUSTATIUS The Netherlands
SINT MAARTEN The Netherlands
TRINIDAD & TOBAGO Independent √ √ √ TURKS & CAICOS ISLANDS United Kingdom UNITED STATES VIRGIN ISLANDS United States
2.2
THE CARIBBEAN ECONOMY
2.2.1Macro EconomyIn a comparative investigation of the Caribbean, the countries’ geographic and population sizes and natural resources, primarily account for their levels of economic development. Though they have similar characteristics which are likened to the “plantation economy” (Fay 1936), the subtle differences have grave impacts upon their economies.
Over the past decade, the annual rates of growth of Gross Domestic Product (GDP), for both MDCs and LDCs, have shown an overall downward trend ending 2013, as illustrated in Figure 2.2. The slightly steeper slope of the trend line for MDCs shows a greater change than LDCs. Overall, the region has grown as high as 7% in 2006 prior to the economic crisis in 2008 which the resultant economic recession resulted in a fall of 11% to -4% in 2009.
In the most recent years (2009- 2013), the region has managed to regain its momentum, given the world’s sluggish growth, growing by almost 1.5% for MDCs and less than 1% for LDCs. Furthermore, a comparison of the Caribbean’s growth to the world’s richest Organization for Economic Cooperation and Development (OECD) countries show a high susceptibility with respect to its trade openness and dependence toward the world’s power giants (Briguglio 1995; Easterly & Kraay 2000; Read 2004; Streeten 1993).
Despite fluctuations, over the period 2000 to 2012 both groups show similar trends, reflecting an overall downward trend in economic growth with a very close growth average of 2.28% and 2.19% for the Caribbean and OECD respectively (see Figure 2.3) (World Bank, 2014b).
Figure 2.2 CARICOM Rate of Growth of GDP: MDC & LDC
Source: (World Bank, 2014b)
Figure 2.3 OECD/CARICOM Rate of Growth of GDP
Source: (World Bank, 2014b)
Over the ten-year period (2001-2011), the region’s annual rate of inflation depicted an upward trend. Its largest rise to 9% occurred in 2008 amidst the economic and financial crisis. Thereafter, the contraction and soon recovery of the world economy, resulted in a drop to 2% in 2013 (see Figure 2.4). The majority of countries did not incur double digit inflation rates with the exception of Jamaica in 2008 which recorded its highest rate of 22% as result of the high cost
commodities market and high unemployment rate (Dacosta and Greenidge 2008; The World Bank 2014c). This is bad to a country, as continual rising inflation rates, is likened to a tax on money holders, being consumers and firms, which means a diminishing of purchasing power. This also leads to unemployment as firms’ cost of production increases.
On the other hand, the richer countries (MDC) are reported to have higher inflation rates than their poorer counterparts (LDC). In the earlier year of 2003 and more recently 2013, all LDCs have still managed an average inflation rate of approximately 2%. They have managed to maintain lower rates of inflation due to the establishment of its single currency board arrangement, as members of the Organisation for Eastern Caribbean States (OECS) group (Mccarthy & Zanalda 1995). With the exception of Barbados which recorded low rates similar to the LDCs, Jamaica and Trinidad and Tobago rates have been above 4% and as high as 10% for the Jamaican economy (see Figure 2.5).
Generally, the primary factors known to impact the region’s rate of inflation have been a combination of demand-pull, cost-push and imported inflation. These have continued to manifest itself as compounded with expansionary fiscal and monetary policies, unstable exchange rates (particularly Jamaica’s floating exchange rate regime), high unemployment, money supply and interest rate fluctuations and imported inflation (Nicholis et al.., 1995; Rajapatirana and Seerattan 2000; Dacosta and Greenidge 2008).
Figure 2.4 CARICOM Av. Rate of Inflation (%) p.a.
Source: (World Bank, 2014c)
Figure 2.5 Rate of Inflation (%) p.a. per country
Source: (World Bank, 2014c)
The Caribbean is distinguished for its “openness” synonymous to its large dependence upon international trade. The countries’ small geographical size and limited range of natural resources endowments which are primarily agricultural, results in relatively high import content, in relation to its GDP (Briguglio 1995).
For instance in 2012, the majority of countries which include MDCs among others, recorded trade deficits and have been so over the past years, with exception of periods prior to the financial economic crisis (see Appendix 1).
The region’s trade sector continues to contribute a vast percentage to its GDP; according to the World Bank, its Trade-to-GDP-ratio in 2012 was approximately 91% (World Bank, 2014d). Compared to the United Kingdom for instance with a trade- to- GDP ratio of around 60%, this shows CARICOM’s vast openness to trade. Domestic producers remain heavily reliant on foreign demand while domestic consumers are geared towards the foreign supply for goods and services (see Figure 2.6).
Figure 2.6 CARICOM Trade Sector Contribution to Gross Domestic Product (2012)
Source: (World Bank, 2014d)
Calculated at current prices, a high degree of trade openness is attributable to the individual countries in which all have shown ratios which are above three quarters of their Gross Domestic Product. According to the World Bank national accounts data, trade openness is calculated as Trade (% of GDP) being the sum of exports and imports of goods and services measured as a share of gross domestic product i.e. (value of import + value of exports/ GDP) (World Bank, 2018).
In the year 2012, Antigua and Barbuda (102%), the Bahamas (106%), Barbados (96.8%), St. Lucia (104%) and Trinidad and Tobago (95%) had ratios of approximately 100%, with The Bahamas having the largest Trade-to-GDP-ratio (see Figure 2.7).
Figure 2.7 Trade Contribution to Gross Domestic Product per country (2012)
Source: (World Bank, 2014d)
This has shown the region’s large openness and dependence on international markets and trade. Though the region imports goods and services to satisfy home demand and for use as intermediate inputs for production, the added value created from the various sectors as will be further investigated in section 2.2.2 are usually greater than total economic output (Hilaire & Dhoray-Baig 2013).
Furthermore, introducing the volume index measures the region’s level of imports versus its exports. Prior to the crisis both imports and exports showed upward trends in growth reaching a high of index 116 for imports and 103 for exports, given a base year of 100 in 2000. After 2008, the volume of both imports and exports declined averaging around index 80 in 2011 (see Figure 2.8). More recently, as world demand has been recovering, signs of growth are evident but at a very slow pace averaging around 90. The majority of countries which also include MDCs show larger import volume indices in relation to its corresponding
exports in 2013 (see Figure 2.9, and Appendix 2).
Figure 2.8 CARICOM Export and Import Volume Index
Source: (World Bank, 2014e)
Figure 2.9 Export and Import Volume Index per country (2013)
2.2.2 Micro Economy
The Caribbean’s micro economic environment, with respect to its production and export structures, has long been influenced by its colonial past. Given its export market which comprised of primarily agricultural goods, under the authority of a colonial government, the Caribbean was labelled a “plantation economy.” Fay’s article on the Plantation Economy relates the plantation system to:
“The acquisition of a limited but fairly extensive area for the cultivation of a particular crops ...” (Fay 1936)
The region provided a settlement for labourers to exploit the agricultural sector given its natural resources. Because of the land being cultivated and fertile, the economies gained long-term preferential trade access, in particular with their mother colony such as the European market and the United States. The main agricultural export commodities included bananas, sugar, rice, tobacco, rum, spices and other vegetables were exported on a large scale from the Organization of Eastern Caribbean States (OECS), Dominican Republic, Trinidad and Tobago and Jamaica.
While these main commodities remained the major source of production and therefore export revenue but drastically began declining over the years. The effects of trade liberalization resulted in increased agriculture import substitutes, while competition from Latin American and African suppliers due to lower labour costs, led to a fall in its exports (Griffith 2010).
Today, many of the countries have shifted their dependence away from agricultural based exports; in most cases, the sector contributes less than 10% toward Gross Domestic Product. Factor endowments are now allocated toward more profitable sectors such as manufacturing and services. The manufacturing sector, according to the World Bank, comprises areas of commerce such as construction, electricity, water, gas and agro-processing. Its value added is the sum of net output after adding up all outputs and subtracting intermediate inputs (inputs used in the production of other goods).
On the other hand, services largely include tourism related business and added value in the areas of hotels, restaurants and transport, but also includes
education, health care, communications and financial services, particularly offshore banking services.
The energy industry of Trinidad and Tobago continues to contribute the most to national income in relation of other countries. Its main source of income is derived from this sector and together with the agro-processing, industry (such as fertilizers, flour milling, rice, fish canning etc.) accounted for 57% of Gross Domestic Product (GDP) in 2013. Of significance also, St. Kitts and Nevis’ electronics (producer of transmission apparatus for radios, telephones and televisions) and sugar processing industries accounted for 26% while Jamaica’s bauxite and aluminium industry contributed 21% to national income which the most of these are exported (see Table 2.2).
With respect to the region’s services sector which accounts for the majority of national income, its top seven travel and tourism economies in 2013 were Aruba (84.1%), the United Kingdom Virgin Islands (76.9%), Antigua and Barbuda (62.8%), Anguilla (57.1%), the Bahamas (46%), St. Lucia (38.7%) and Barbados (36.2%). These islands have also remained the top seven during the period 2009- 2013 (see Appendix 3).
With the exception of Trinidad and Tobago (43%), the services sector has contributed almost three quarters to GDP in all countries, with Barbados (83%), St. Lucia (83%), Antigua and Barbuda (80%) and the Bahamas (80%) accounting for the most (see Table 2.2). In addition to the tourism related area of commerce, offshore banking services for instance in the Bahamas resulted in its contribution to national income.
Having investigated the overall structure of the Caribbean economy, and where most of its economic activities are established for domestic and international consumption, the following section will investigate the structures and patterns of international trade within which these economies engage.
Table 2.2 Structure of CARICOM Economies
Country Year Agriculture
Value Added (% of GDP) Industry Value Added (% of GDP) Manufacturing Value Added (% of GDP) Services (% of GDP)
Antigua and Barbuda 2013 2 18 3 80
Bahamas 2013 2 18 4 80
Barbados 2012 1 16 7 83
Dominica 2013 17 14 3 69
Grenada 2013 6 15 4 79
Jamaica 2012 7 21 9 72
Saint Kitts and Nevis 2013 2 26 11 73
Saint Lucia 2013 3 14 3 83
Saint Vincent and the
Grenadines 2013 7 18 5 75
Trinidad and Tobago 2013 1 57 6 43
Source: (World Bank, 2014f)
2.3
INTERNATIONAL AND REGIONAL TRADE REGIME
2.3.1Patterns and Partners of Trade
The Caribbean’s attributes that render the states “small and open,” limits their productive capacities while being highly dependent upon its trade partners for factors of production and finished goods. The region’s pattern of trade as discussed in section 2.2.2 includes top imports such as automobiles, telecommunications and industrialized machinery and equipment while exports comprise primarily industrialized commodities such as iron ore, aluminium, petroleum, natural gas and agro- processing.
Over the past twelve years ending in the year 2012, CARICOMs total imports and exports for goods and services have shown an overall upward trend in growth despite the global economic crisis in 2007/2008 which thereafter resulted in a decline. The region’s imports increased by 105 % to US$27,068Mn in 2012 while exports by 138 % to US$25,031Mn for the duration of the period (see Figure 2.10)2.
2 Refer to Appendix 1 for CARICOMs Total Imports and Exports for the period 2000 to
Figure 2.10 CARICOM Total Imports and Exports
Source: (World Bank, 2014e)
The More Developed Countries (MDCs) in the region contributed to the bulk of CARICOMs trade, collectively accounting for just over two thirds of the total CARICOM trade for exports and imports. For this group, Trinidad and Tobago held the bulk of this share as its exports and imports were approximately half of the CARICOM region’s total international trade. On the other hand, Lesser Developed Countries (LDCs) reflected only 24% of the region’s exports and 30% imports with the Bahamas representing the majority of the share with 16% exports and 18% imports (see Appendix 1).
A closer analysis of the region’s trading patterns, show that CARICOMs extra- regional trade has continued to dominate its intra- regional market for goods and services. For instance in 2012, extra regional imports represented 73% of total imports with intra-regional imports accounting for 8%; on the other hand, in the aforementioned year extra regional exports marked 51% of total exports with 8% belonging to intra-regional exports (see Appendix 4).
Intra- regional trade is the economic exchange of goods and services primarily between countries of the same trading bloc based on agreed trading
arrangements. This trade flow is mainly engaged by MDCs. In the year 2012, Trinidad and Tobago was the region’s leading exporter (82%), while Jamaica (38%) and Barbados (28%) were the major importers; OECS countries followed shortly behind with 25% of the region’s total imports (see Appendix 5).
Prior to the world’s economic crisis, exports grew higher than imports. Exports increased by 195% while imports by 162% during the period 2000 to 2008. Exports and imports were recorded at their highest in 2008 with US$3640Mn and US$2768Mn respectively; this was partly attributed to the region’s growing demand fuelled by a growing population and consumption for imports while reliance on inelastic demand energy associated commodities from Trinidad and Tobago and tourism related industries in the other islands contributed to export revenues.
On the other hand, the post economic crisis period showed an overall decline in intra-regional trade. Owing to the region’s high susceptibility to the international market, its imports fell by 39% while exports fell by almost 50% during the period 2008/2009 alone. This however was shortly changed as demand gradually recovered; subsequent to the great drop in 2009, imports grew by 33% from 2009 to 2012 to US$2,240Mn in 2012 while exports slowly recouped growing by only 10% to US$2,032 in 2012 (see Figure 2.11, Appendix 5).
Figure 2.11 CARICOM Intra-regional Trade (US$ Mn)
Source: (CARICOM, 2014)
Extra- regional trade as examined previously accounts for the bulk of CARICOM’S international trade. Extra- regional trade is the economic exchange of goods and services primarily between a country/ countries of the same trading bloc and the rest of the world. The top international partners with which this trade takes place includes the United States of America (they accounted for approximately 30% of all imports in 2012), Latin America (15%) and Asia (8%) while export markets for 2012 include the United States (30%), Europe (4.5%), the Caribbean (3.6%) and Latin America (3.4%) (CARICOM 2014). These countries engage in trade with chiefly the MDCs of which Trinidad and Tobago remains the dominant importer and exporter accounting for 48% and 81% respectively in CARICOM (see Appendix 5).
Prior to the financial economic crisis, just as intra- regional trade, imports and exports grew by 54% and 91% respectively during the period 2005 to 2008 to US$19096Mn and US$18228Mn. The collapse of the world economy became evident throughout the region as both imports and exports decreased in 2009, exports falling (47%) at the faster rate than its imports (27%). Thereafter, the region has slowly been regaining its momentum as world demand increased, imports rising by 42% and exports by 32% for the period 2009-2012 to
US$19775Mn and US$12663Mn in 2012 (see Figure 2.12, Appendix 6, get from other doc.).
Figure 2.12 CARICOM Extra- regional Trade (US$ Mn)
Source: (CARICOM TradSys Online, 2014)
2.3.2 Trading Arrangements
The Caribbean community (CARICOM) engages in organized trading arrangements at the multilateral, bilateral and regional platforms. Trading arrangements are negotiated among member countries, which afford the region access to international markets, deepen its regional integration ties and foster agreements between individual nations. Among other objectives, CARICOM is geared toward improving standards of living and work, enhancing levels of international competitiveness, and achieving a sustainable level of economic development within the Caribbean region.
Multilateral Level
At the multilateral level, all CARICOM members (with an exception of the Bahamas and Montserrat, which yet lie within the accession process to becoming members) hold membership with the World Trade Organisation (WTO). Governed by legal trade rules with an aim of relaxing trade barriers among
member countries, CARICOM can access increased exports opportunities, protect its home markets and satisfy its growing home demand.
The region has committed to agreements in relation to its trade in goods, services and intellectual property rights. These are set out within the General Agreement on Tariff and Trade (GATT), the General Agreement on Trade in Services (GATS) and the Trade- Related Aspects of Intellectual Property Rights (TRIPS). Furthermore, the latest round of trade negotiations as established in “The Doha Round,” launched in 2001 has been fully supported by the region over the years as all members anticipate increased trading benefits. Other organizations CARICOM continue to be a part of include the CARICOM WTO Small Vulnerable Economies (SVE) and the Africa, Caribbean and Pacific Group (ACP) created in 1975 aimed towards eradicating poverty and promoting sustainable development.
Bilateral Level
The majority of bilateral trade arrangements are made with first world trading economies such as the United States of America, the European Union and Canada. Maintaining good trade relations with the United States is crucial to CARICOM, since the nation holds a large percentage of CARICOMs extra- regional imports and exports. Relations with the United States were first established under the Caribbean Basin Economic Recovery Act (CBERA) also referred to as the Caribbean Basin Initiative was enacted in 1983.
The program aimed to provide a non-reciprocal (one- way) duty free access for a range of CARICOM goods to the United States’ market. It was later amended into the Caribbean Basin Trade Partnership Act (CBTPA) effective over a twenty-year period, which began in 2000, and has since then afforded the region a broader range of traded goods. Three hundred and eighty seven additional goods, with eight digit level standard industry traded characters where given duty free treatment.
Furthermore, both parties continue to maintain collaborations as the most recent Trade and Investment Framework Agreement of 2013 was implemented, this is