University of Tennessee, Knoxville
Trace: Tennessee Research and Creative
Exchange
Masters Theses Graduate School
8-2018
Design and Validation of Manufacturing
Performance Measurement System Using a Case
Study
Vijayakrishnan Poondi Srinivasan
University of Tennessee
Recommended Citation
Poondi Srinivasan, Vijayakrishnan, "Design and Validation of Manufacturing Performance Measurement System Using a Case Study. " Master's Thesis, University of Tennessee, 2018.
To the Graduate Council:
I am submitting herewith a thesis written by Vijayakrishnan Poondi Srinivasan entitled "Design and Validation of Manufacturing Performance Measurement System Using a Case Study." I have examined the final electronic copy of this thesis for form and content and recommend that it be accepted in partial fulfillment of the requirements for the degree of Master of Science, with a major in Industrial
Engineering.
Rapinder S. Sawhney, Major Professor We have read this thesis and recommend its acceptance:
Harry Lee Martin, Russell L. Zaretzki
Accepted for the Council: Dixie L. Thompson Vice Provost and Dean of the Graduate School (Original signatures are on file with official student records.)
Design and Validation of
Manufacturing Performance
Measurement System Using a Case
Study
A Thesis Presented for the
Master of Science
Degree
The University of Tennessee, Knoxville
Vijayakrishnan Poondi Srinivasan
August 2018
c
by Vijayakrishnan Poondi Srinivasan, 2018 All Rights Reserved.
I dedicate this thesis to my father Srinivasan Poondi Krishnaswamy And My mother Radha Poondi Chinnappa Who are responsible, for what I am today. To my grandparents Badrinarayanan P C, Shantha P B, Krishnaswamy P A and Vijayalakshmi
Acknowledgments
I express my indebtedness to my professor Dr. Rapinder Sawhney for guiding me throughout my master’s coursework and thesis with his support and knowledge. He is a true inspiration for all the international students. He has motivated and supported me in all possible ways to complete my master’s degree. Importantly, he has been my source of encouragement, positivity, confidence and icon of hard work. I am thankful to Carla Arbogast, Director of Center for Advanced System Research and Education for being very supportive and teaching me how to handle difficult situations in life, special thanks for introducing me to the world of essential oils. Most importantly, I want to thank my thesis committee members Dr. Lee Martin and Dr. Russell Zaretzki for their faith and encouragement in completion of my thesis. I would like to thank my dear bestie and the very sweetest Arun Vijayabalan who is my pillar of strength and support during all times. Without his encouragement I cannot imagine completing my Master’s degree. I want to thank my dear friends Sithara, Vasanth, Siddarthan, Athul, and Prashanth for cheering me all the time and supporting me in all possible ways. Special mention to Nooshin Hamidian and Ninad Pradhan for constantly helping me out in each phase of my thesis. I would like thank all my lab mates Gajanan, Anju, Jafar, Abhishek, Ali, Roshanak, Shravanthi, Lavanya, Tomcy, Vahid, Ryan, Girish, Tina, Dhanush, Mustafa, Enrique, Aravind and Kaveri for creating an excellent working culture in the lab. Last but not the least, I want to thank my parents, grandparents, relatives, teachers, friends and god for their love and blessings, and providing me with everything that I wanted, words are not enough to
describe my thanks to them. Without their guidance and support I would not have made this far in life. I might have not listed everyone, so I want to thank all my well-wishers for their continuous encouragement, love, and support.
Abstract
Many manufacturing organizations have used different measures and measurement systems to determine their performance. Yet, one can improve only what one can measure. Performance measurement is indispensable and is a requirement to identify the issue, troubleshoot, and improve the production system. There are various types of performance measurement systems (PMS) presented in the literature and some of them are commonly used, for example, the balanced scorecard. However, there is little experience of performance measurement in research organizations and only 0.5% of publications are related to performance measurement systems. More specifically, the type of research organization referred in this study is established to provide affordable and convenient access to R&D expertise, facilities, and tools to facilitate rapid adoption of advanced manufacturing technologies to enhance the competitiveness of the U.S. workforce. In this research, a review of the existing literature (between 1995 and 2017) is undertaken to determine the building blocks of a PMS to build a conceptual model for designing PMSs. Based on the findings, the following four components were identified as the building blocks of conceptual model for designing PMS: 1) vertical integration, 2) horizontal integration, 3) cause-and-effect relationship, and 4) daily management system reporting framework. Based on the conceptual model a PMS was designed for assessing the throughput of a manufacturing case study identified in a research organization. A simulation model of the manufacturing case study was developed to validate and test the effectiveness and
shortcomings of PMS. The conceptual model developed in this research is not limited to research organizations, it can be applied and tested in industries.
Table of Contents
1 Introduction 1
1.1 Introduction . . . 1
1.2 Gaps Identified in Existing PMS Models . . . 4
1.2.1 Balanced Scorecard (BSC) . . . 4
1.2.2 Performance Pyramid System . . . 5
1.2.3 Integrated Performance Measurement System . . . 6
1.2.4 Process Performance Measurement System (PPMS) . . . 7
1.2.5 Performance Prism . . . 7 1.2.6 Leinonen’s Model . . . 8 1.2.7 Cambridge Approach . . . 9 1.3 Problem Statement . . . 10 1.4 Approach . . . 12 1.5 Scope . . . 14 1.6 Limitations . . . 16 1.7 Structure of Thesis . . . 16 2 Literature Review 17 2.1 Introduction . . . 17
2.2 Building Blocks of Performance Measurement System . . . 18
3 Methodology 29
3.1 Introduction . . . 29
3.2 Building Blocks of Conceptual Model . . . 30
3.2.1 Vertical Integration . . . 31
3.2.2 Horizontal Integration . . . 33
3.2.3 Cause-and-Effect Relationship . . . 36
3.3 Daily Management System Reporting Framework . . . 38
3.3.1 Types of Performance Measures Based on Reporting Frequency . . 40
3.3.2 KPI Alignment Chart . . . 40
3.3.3 KPI Trend Analysis Chart . . . 42
3.3.4 Cause-and-Effect Analysis Chart . . . 44
3.4 Conceptual model & Design of Throughput Based PMS Framework . . . . 45
3.4.1 Conceptual Model . . . 45
3.4.2 Design of Throughput Based PMS Framework . . . 46
3.5 Assessing the Throughput Based PMS Using Maturity Model . . . 52
3.6 Summary . . . 53 4 Case Study 57 4.1 Introduction . . . 57 4.2 Pilot Study . . . 57 4.2.1 Data Validation . . . 58 4.3 Sensitivity Analysis . . . 63
4.3.1 Best Case Scenario . . . 64
4.3.2 Scenario 1 : Impact of Flow Model . . . 67
4.3.3 Scenario 2 : Impact of Variation Model . . . 70
4.3.4 Scenario 3 : Impact of Disruption Model . . . 73
5 Conclusion 78
5.1 Introduction . . . 78
5.2 Methodological Contribution . . . 78
5.3 Practical Usage . . . 79
5.4 Direction for Future Work . . . 80
Bibliography 81
List of Figures
1.1 Comparison with existing models . . . 10
1.2 Problem Statement & Proposed Hypothesis . . . 13
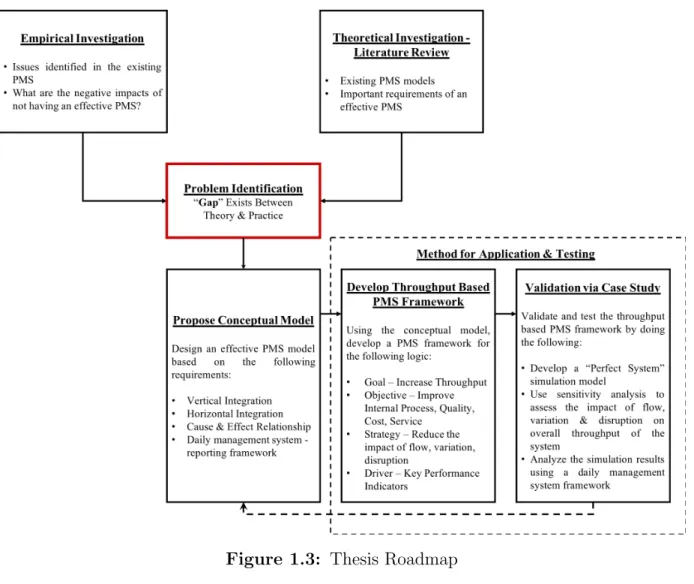
1.3 Thesis Roadmap . . . 15
2.1 Literature Review Process . . . 18
2.2 Comparing the existing literature against Validation, Testing, Implementa-tion & Sustainability Plan . . . 23
2.3 Horizontal integration . . . 24
2.4 Cause and Effect relationship . . . 25
2.5 Maturity Model . . . 26
2.6 Validation and Testing . . . 27
3.1 Vertical Integration . . . 33
3.2 Horizontal Integration . . . 36
3.3 Cause-and-Effect Relationship . . . 39
3.4 Types of Performance Measures . . . 41
3.5 KPI Alignment Chart . . . 42
3.6 KPI Trend Analysis Chart . . . 43
3.7 Cause-and-Effect Analysis Chart . . . 44
3.8 General Overview of Conceptual Model . . . 45
3.10 Strategic Level Throughput Based PMS Framework . . . 49
3.13 Performance Measurement System -Maturity Model . . . 53
3.11 Assessment of Throughput Based PMS Using Maturity Model . . . 54
3.12 Performance Measurement System -Maturity Model . . . 55
4.1 Case Study - Overview . . . 58
4.2 Case Study - Value Stream Map . . . 59
4.3 Case Study - Simulation Model . . . 61
4.4 Performance Measures Identified in the Case Study . . . 62
4.5 Case Study -Best Case Scenario Data . . . 63
4.6 Process Parameters for Best Case Scenario . . . 64
4.7 Best Case Scenario -KPI Alignment Chart . . . 65
4.8 Best Case Scenario -KPI Trend Analysis Chart. . . 66
4.9 Best Case Scenario -Cause-and-Effect Analysis . . . 66
4.10 Process Parameters Modified for Scenario 1 . . . 67
4.11 KPI Alignment Chart Image -Flow Model . . . 68
4.12 KPI Trend Analysis Chart -Flow Model. . . 69
4.13 Cause-and-Effect Analysis Chart -Flow Model . . . 69
4.14 Process Parameters Modified for Scenario 2 . . . 70
4.15 KPI Alignment Chart Image -Variation Model . . . 71
4.16 KPI Trend Analysis Chart -Variation Model . . . 72
4.17 Cause-and-Effect Analysis Chart -Variation Model . . . 72
4.18 Process Parameters Modified for Scenario 3 . . . 74
4.19 KPI Alignment Chart Image -Disruption Model . . . 75
4.20 KPI Trend Analysis Chart -Disruption Model . . . 76
4.21 Cause-and-Effect Analysis Chart -Disruption Model . . . 76
Chapter 1
Introduction
1.1
Introduction
The world is changing rapidly, and it is important to note that the industrial sector is growing drastically, and every industry is striving to improve its position to become world class [21]. To survive in such a competitive environment, the industrial organizations must assess their existing position, strengths and weakness [5, 18, 23, 29, 19, 25]. This significantly provides opportunities to recognize problems in their system, take corrective actions before it escalates, and operate more effectively [2, 5]. Although many industries discuss process improvement, and other similar terminologies, most of them do not have an integrated approach for assessing their performance on a daily basis. To facilitate this improvement plan, performance measurement systems (PMSs) play a significant role and assist organizations in achieving their goals and objectives.
According to literature [4, 2, 16], an effective PMS enables an organization to assess whether goals are being achieved and facilitate the improvement of the organization by identifying their position, clarifying goals, highlighting areas requiring improvement, and facilitating reliable forecasts. Therefore, to put in a nutshell, effective PMS enables an organization to align its process level performance with management level goals [4, 16].
Having stated todays dynamic industrial environment and defining the expectations of an effective PMS, it is essential to learn the limitations of existing PMS models and adverse impacts of not having a proper PMS model.
The literature presents numerous limitations of existing PMS models and impacts an industrial organizations experience when they do not have a proper PMS [6,17,16,18,23, 28,31]. Some limitations are, even though there are a few approaches to design PMSs that use a huge set of measures placed in hierarchical fashion, a majority of the measures are outdated and inconsistent with the company’s goals [11,13,17,16,29]. Also, using a large set of measures often creates difficulty in understanding the overall picture. Therefore, what is missing in the existing approach is integration between the measures. To support this statement, literature [11, 13, 17, 16, 29, 28] highlight the fact that the firms do not have effective PMS that has the ability to integrate and align the necessary performance measures and most of the time fail to identify the correct measures. In conclusion, this is a serious problem and a comprehensive list of adverse impacts for not having a proper PMS is given below:
(A) Poor current state assessment [11, 13, 17, 16, 29] - Assessing the current state performance is the fundamental requirement for any industry that is planning a move towards continuous improvement. Performance measurement is the language of progress from current state and provides a sense of where we are and more importantly where we are going. Hence, if the PMS is not properly designed, the current state assessment becomes even more challenging and often hinders the path to improvement.
(B) Difficulty in defining the goals & objectives [11, 13, 17, 16, 29]- If challenges exist in understanding the cause and effect relationships of a PMS, the target outcomes become unclear. Goals and objectives have to be developed based on defined target outcomes. Therefore, the organization will experience lack of strategic focus. Alignment and strategy deployment becomes a challenge and PMSs have
demonstrated to be a good tool for communicating a companys plan of action throughout the organization by aligning the goals and objectives throughout the organization. It is an essential operational element in order to persuade the organization towards improvement, manage progress and direct the effect towards defined goals and objectives.
(C) Lack of understanding of cause and effect relationships [11, 13, 17, 16, 29] - If one cannot assess the current state performance, it is even more challenging to learn the relationship between different performance measures that exists in the PMS. The PMS includes both cost related, and non-cost related measures and it is indispensable to establish relationship between those metrics. Linking together and integrating all the individual measures (determinants and results) becomes an increasingly complex problem for any organization.
(D) Proactive decision-making is not possible [11, 13, 17, 16, 29] - One of the most important strengths of an organization is to make proactive decisions compared to reactive decision-making. Following the sequence of impacts mentioned above, if the strategy is not deployed properly, there will be no control over the process. In such a chaotic environment, there will be no clarity of who is responsible for specific results and it is impossible identify the issues in the system. As a consequence, proactive decision-making to prevent the system from failure and directing towards achieving the target becomes a difficult task. Innovation & Process improvement will not occur. Finally, if a PMS is not designed properly, there will be no scope for innovation and learning. According to literature, innovation and learning serves as the foundation for process improvement initiatives in an organization. The growth of an organization completely depends on its ability to continuously improve and sustain. Therefore, PMS acts as a trigger and feedback control loop for process improvement if they are designed appropriately [11, 13, 17,16, 29].
Therefore, in conclusion, PMS plays a critical role in the growth and development of an organization. Having a well-defined PMS leads the organization towards continuous improvement . In contrast, a poor PMS will definitely have an adverse effect on the system, as well as the organization. So, the focus of this research will be to develop a conceptual model for designing PMS framework and evaluate it using a manufacturing case study. In the next section, various concepts that has been developed for designing PMS and most important things to consider while developing a PMS conceptual model will be discussed in detail.
1.2
Gaps Identified in Existing PMS Models
There is little experience of PMSs in research organizations, only 0.5% of publications are related performance measurement systems [23]. To date there is no common perception for an ideal performance measurement system framework in literature, though many approaches have been developed [1]. With this context and considering this as a starting point, this research focuses on reviewing the existing PMS models developed for manufacturing industries.
Even though there exists a scant work on PMSs, there are few models that should be studied to understand the basic concept and logic used for designing PMSs. Through literature review seven predominant models for designing PMSs have been identified. Each of these models have a unique approach, and it is to be noted that the design of PMS models has evolved over the years. The following sections present a brief overview of those seven models:
1.2.1
Balanced Scorecard (BSC)
This is the most popular models both in literature and practice and serves as a base for major performance measurement systems that are in practice today [11,9,17,2,22,1,15,
5,30,4,16,29,10]. The aim of this approach is to provide a balanced view of performance to the management using the measures related to four perspectives and they are as follows:
• Financial Perspective -Organizations ability to make profits (e.g. return on capital)
• Customer Perspective -Survey customers to gather their opinion on products/service
• Internal Process Perspective -Define key processes that are critical for organizations success (e.g. product development process)
• Innovation and Learning Perspective -Organizations ability to develop and adopt continuous learning techniques
Performance measures in each of these perspectives are linked to different goals of the organization. It is to be noted that 60% of the fortune 1000 companies in the United States of America have used the Balanced Scorecard approach to assess the performance of their organization. However, the Management Tools and Trends Survey showed that in 2008 53% of the organizations used this approach for tracking performance, and the prediction for adopting this approach by the end of 2009 was expected to be 69%, but it was found that 51% of the organizations were not satisfied with the BSC approach. Supporting this information, another survey revealed that BSC approach provided moderate satisfaction with 37.2% of respondents rating BSC as this approach did not meet the expectations. Major limitations of the BSC approach include; it emphasized more on financial measures in comparison with non- financial measures, the performance measures are not multidimensional, and the performance measurement system is not proactive in nature.
1.2.2
Performance Pyramid System
This model has a pyramid structure consisting of four levels [11, 29] . Those levels show the links between organizational objectives, strategy and operations. The objectives at the
top level are a translation of a companys vision statement. This system uses a top-down approach. The limitation of this measurement system is that it aims to measure only the customer satisfaction and operational measures. To a certain extent, it also supports the relationship between the different performance measures of a process. Therefore, this system does not provide a comprehensive performance report for the organization and because of its very limited focus, identifying the critical areas in the system becomes a huge challenge.
1.2.3
Integrated Performance Measurement System
This system serves as a resource of information which enables efficient and effective functioning of the process [11]. This PMS model is designed based on two major requirements:
1. Integrity 2. Deployment
The model consistes of four levels: 1. Corporate Level
2. Business Units Level 3. Business Processes Level 4. Activities Level
The PMS focuses on five main factors, and they are stakeholders, control criteria, external measures, improvement objectives and internal measures. This type of classifica-tion facilitates definiclassifica-tion of the most appropriate type of performance measures, which are classified into internal, external, capability and learning measures. The internal dimensions are used to monitor the production process, and the external dimensions are used to
monitor the companys position in the market. The limitations of this model are, there exists very limited focus on the employee perspective and learning & growth perspective. Moreover, the relationship between the level and various performance measures are not established properly.
1.2.4
Process Performance Measurement System (PPMS)
The main idea of PPMS is that evaluating process performance helps to identify the problems and provide scope for improvement before the problem escalates [18]. Additionally, this model is developed to satisfy two major requirements and they are as follows,
1. The measurement system should focus only on the process and not on every aspect of the organization, and
2. The measurement system should evaluate both qualitative and quantitative aspects of the process [18].
This system provides detailed information on performance of a process [11]. The expected benefits of this system include information on current performance of process, highlighting areas of weak performance, and assessing the impact of corrective actions taken to improve the process. Similar to the integrated performance measurement system, this PMS model has limitations related to employee perspective and learning and growth perspective. Also, focusing only on the process does not provide a comprehensive report regarding the performance of an organization.
1.2.5
Performance Prism
This is a three-dimensional model which aims to measure the performance of the entire organization [11, 15]. Generally, a three-dimensional prism represents the architecture of the model, and each face of the prism relates to a specific area of analysis:
1. Stakeholder satisfaction - refers to the key stakeholders and their respective needs 2. Strategies - refers to the strategies required to satisfy needs of stakeholders
3. Process - refers to the identification of critical processes needed to execute the strategies
4. Capabilities - refers to the determination of capabilities needed to run a process efficiently
5. Stakeholder contribution - refers to the inputs required from stakeholders to enhance capabilities
The limitations of this model includes the following, even though this model considers many important items that a PMS should consider, the people based focus and measures related to the same are less, and does not establish any relationship between the performance measures. Similar to the previous models, there is limited focus on the learning & growth aspect of the organization.
1.2.6
Leinonen’s Model
The journal paper cited as reference for this model does not provide the details of the actual Leinonen’s model which can be used for designing a performance measurement system [28]. However, the journal paper presents a case study which aims to design a PMS for research organizations and most importantly, the Leinonen’s model is used for designing the PMS. Accordingly, this model comprises of seven phases and they are as follows;
1. Defining strategy 2. Describing the process
3. Identifying the success factors
5. Propose reporting system
The fourth and the fifth phase have two sub phases and hence it is comprised of seven phases. This model is focused on identifying the critical success factors that determine the success of an organization. Additionally, this model is divided into hierarchical levels and follows a top-down approach. Even though this model lists the various phases for designing and developing PMSs, it does not explicitly state how the performance measures in each level are aligned to the overall goal of the organization. Also, this approach does not consider the importance of establishing cause-and-effect relationship between performance measures.
1.2.7
Cambridge Approach
This model is quite different when compared to the other models and its main aim is to systematically integrate operations strategy [8, 24]. It is a completely process-based approach. This model presents a systematic procedure to generate performance measures consistent with process or operations objectives and produces a strategy for implementing the system into practice. The underlying concept of this model is to develop a framework for organizing a set of features and function that an operations strategic management system should develop is proposed. The main features of this model are as follows:
1. Establish organizational learning capability as an important outcome of system, 2. Understand company’s operations process dynamics and develop a strategy based on
dynamic capabilities, and
3. Reinforce continuous learning and improvement.
In conclusion, from the overview seven PMS models discussed above, it is evident that there is no comprehensive approach for designing a PMS. One common feature identified in all the seven PMS models is that, every system is vertically integrated based on hierarchical
levels. But, identification of critical factors, establishing cause-and-effect relationship, and implementing a daily management system for sustainment are either partially present or not present in the existing PMS models. The Figure 1.1 summarizes the design requirements of an effective PMS and compares them against the existing PMS models.
Figure 1.1: Comparison with existing models
1.3
Problem Statement
According to literature [20,17,14,15,18], no single PMS can serve the needs or purpose for any organization for all time. The PMS should be dynamic in order to assess the current
status of an organization, reflect the requirements/needs, quickly adapt improvement plans and predict outcomes. Also Bititci [3] states that, the priorities and criticalities of measures in a PMS will keep changing as the companies are operating in a dynamic environment, and the existing PMS models fail to recognize these changes early in order to alarm abnormalities, shift priorities and exhibit a proactive behavior. Supporting this statement De Lima [8] states that, a PMS can be proactive in nature only when it is able to control the cause (leading indicators) and results of operations (lagging indicators). Then it is possible to assess the relationship between the indicators and develop a predictive approach for the entire PMS. In [27] it is mentioned that, there is no PMS model that explicitly suggests a mechanism to project upstream the existing relationship between goals & objectives (higher level) and operational level (lower level) performance measures. In [4], the author explicitly says that, the existing PMS models are focused more on what to measure, with less emphasis placed on why to measure and how to measure. Therefore, the managers have reached a decision about what has to be measured but need clarity on establishing relationships and implementation of the PMS. If the strategy and measures are aligned, it becomes easy for the processes to review their performance measures (actual) against strategic goals (targets) which has proved to be very useful for management to track and sustain improvement. In conclusion [6], the following points from the literature have been identified as important and the PMS model should address them clearly in order to build an effective PMS (currently these requirements are not addressed properly, and it is a problem):
1. Clearly translate what the customer and stakeholder goals and objectives are to management level (higher level) [8],
2. Define critical factors and strategies for achieving those higher level goals and objectives [27],
3. Non-cost measures should be included in the PMS and they should be able to provide fast feedback [3],
4. Consistently align the goals and objectives with operational level process, implement the strategy, track changes and facilitate strategic decision-making [4],
5. Finally, the existing PMS should have the ability to kindle continuous improvement and not just be used to oversee certain performance results[6].
Therefore, it is important to state the hypothesis based on whether this research has been carried out. The Figure 1.2, lists the problems related to current PMS design and proposes a hypothesis to overcome the issue that will be validated and tested in this research.
1.4
Approach
Having identified the problem in the previous section, this section explains the approach undertaken for tackling the same. The major parts of approach are as follows:
1. Empirical Investigation : In this section, rigorous understanding of existing PMSs and the negative impact of not having a proper PMS was gained through practical project experience and lean training programs.
2. Theoretical Investigation : After gaining the practical issues, the existing literature related to designing, implementing, and validating PMSs was collected and reviewed. This literature review was helpful to understand, what has been already done and what the scope for future PMS models is.
3. Problem Identification : In this section, the information/findings obtained from empirical investigation and theoretical investigation were compared to understand the gaps in the system.
4. Propose Conceptual Model : Based on the gaps identified, a conceptual PMS model was proposed that aims to bridge the existing gaps in the system. The conceptual
model was developed based on four main requirements. They will be discussed in detail in Chapter 3.
5. Method for Application & Testing
• Develop Throughput Based PMS Framework : After the conceptual PMS model is designed, it has to be validated. Based on the conceptual model, a PMS framework was developed to assess the throughput of a manufacturing case study.
• Validate via Case Study : A simulation model of the manufacturing system case study was developed using ProModel simulation software. Sensitivity analysis was incorporated to create and test various scenarios. The scenarios were designed to analyze the impact of flow, variation, and disruption on overall throughput of the system.
1.5
Scope
• Applies to a research based manufacturing organization established to provide afford-able and convenient access to R&D expertise, facilities, and tools to facilitate rapid adoption of advanced manufacturing technologies to enhance the competitiveness of the U.S. workforce.
• Data is collected in three different ways (observation, interviews, and historical records) and it is simulated for 2 years to collect reliable synthetic data used for analysis.
• The system defined takes different set of entities, equipment and surroundings into consideration.
• The methodology is proactive and transferable and could be applied to any manufacturing industry.
1.6
Limitations
• Measures related to cost and learning and innovation will not be analyzed in detail. Instead general suggestions related to them will be provided based on the overall performance of the system.
• The case study will not be assessed in terms of PMS maturity model because the details regarding IT services / Database capabilities are not available, and the maturity model requires that information. But a PMS maturity model is proposed in Chapter 3 for reference.
1.7
Structure of Thesis
In the following four chapters, the methodology to design a manufacturing PMS based on the three main dimensions is described and following that a case study is presented to test the application of this research. Chapter 2 follows a specific literature review process and provides a detailed literature review in the field of PMSs, different PMS models, main dimensions of PMSs and challenges involved in designing PMS for a manufacturing process. Chapter 3 explains the methodology followed to develop conceptual PMS model. Following that, Chapter 4 discusses the application conceptual PMS model to a manufacturing industry. Based on the model a PMS framework for manufacturing process is developed and validated through a case study (simulation model). Chapter 5 summarizes the research findings, benefits, shortcomings and scope for further research.
Chapter 2
Literature Review
2.1
Introduction
In this section, the results obtained through literature review about design of PMS for SMEs are discussed. An organized literature review approach has been described in Figure 2.1. The keywords used for the literature study are shown below:
• Important Design Requirements for Performance Measurement System
• Characteristics of Performance Measurement System in Small and Medium sized Enterprises (SMEs)
• Existing Performance Measurement System Models/ Frameworks in Manufacturing Sector
• Factors Influencing the Design of Performance Measurement System The literature study was done with the following online literature databases:
• Business Source Complete
• IEEE Xplore
• Science Direct
• Scopus
• Web of Science
Figure 2.1: Literature Review Process
Within the literature review, 36 scientific sources, directly related to the area of research, were identified, which were written between 1995 and 2017.
2.2
Building Blocks of Performance Measurement
System
Simultaneously, information on required major dimensions for designing an ideal PMS were gathered through literature and finally, three main dimensions 1) vertical integration [22, 2, 16, 11] 2) horizontal integration [2, 22, 11, 10] and 3) cause-and-effect relationship [6, 20,27, 16] were identified. Then the seven PMS models were compared with the three main dimensions required for designing an ideal PMS. This process provided in-depth information on the existing need to design PMS based on the three main dimensions. The ideal methodology proposed to design PMS is a combination of Balanced Scorecard [11, 9,
17,2,22,1,15,5,30,4,27,10,16,29], Leinonens Model [28], Cambridge Approach [8,24], Performance Pyramid System [14], and System Decomposition Approach [10] respectively. The second part of the research was to illustrate the application and validation of the proposed methodology to design PMS using a case study. Simulation is a widely used effective tool for detailed process analysis because it has the ability to evaluate the impact of process changes and new processes in a computer model environment through the creation of what-if scenarios. Simulation is also promoted to enable the examination and testing of decisions prior to implementing them in the real environment [14]. Therefore, a simulation model of the manufacturing process (case study) was developed using ProModel Simulation software. Then the proposed methodology was used to build a PMS for the manufacturing process case study. Sensitivity analysis was performed in the simulation model to showcase the effect of each element in the manufacturing process. The inputs and outcomes of the manufacturing process were tracked and evaluated using the PMS at each level and provides a final report of whether the strategic goal of the system was met or not. The performance of each metric, process bottleneck, resource utilization, areas of weak performance, the cause and effect of variation were represented using the KPI alignment chart, KPI trend analysis chart, and cause-and-effect analysis chart. In Chapter 3 and Chapter 4 these charts will be discussed in detail. This method of representation not only provided performance of each metric in detail, but also listed the root causes of failure and possible directions for improving the process design [2]. However, there is no PMS framework that explicatively incorporates any mechanism for identifying, quantifying and projecting upstream the existing relationship between performance indicators [27]. To be specific, the recent models are designed particularly for evaluating a certain aspect of an organization whereas, the previous models considered assessing the whole organization through a single PMS. Modern frameworks have addressed the underlying conceptual issues but have rarely addressed the practicalities of measurement in ways that add value to practitioners [23]. Further work is needed to explore the scope for improvement in existing conceptual frameworks, which can be translated and tailored to fulfill the unique needs of a
manufacturing company, especially at the operational level. The proposed framework aims to address the improvement opportunities identified in the above-mentioned PMS models. The major concerns that can be inferred through literature review that have to be taken into account while designing PMS are the following:
• PMS framework should allow the enterprise to identify casual relations between outcome and factors in a consistent manner, and help in making proactive decisions [12].
• Measures should be derived from strategy [4].
• An effective PMS should consist of strategic-level, tactical-level and operational-level performance criteria used to evaluate the capabilities and operations performance. It should provide feedback and reflect the need for improvement in the areas with unsatisfactory performance [9].
• Manufacturing executives and managers find it dicult to design PMS to monitor and track the performance of their organizations because the literature tends to offer them only broad guidelines. To facilitate the practical operationalization of these broad guidelines, the gap between the practices, the theoretical approaches and frameworks found in the literature must be reduced [13].
• With the help of PMS, organizations should have strong sensitivity to the changes, could forecast and manage the opportunities and factors which may influence organizations strategic target [17].
• Manufacturing PMS should exhibit a direct cause-and-effect relationship, not a correlation relationship [20].
• The current PMS system does not give information about the causes. The information is not available to the managers [27].
• The measures should link between strategy, execution, and value creation [23].
• A good PMS should be related to manufacturing strategy, include non-financial measures, vary between locations, change over time, be simple and easy, give feedback, and aim to teach rather than monitor. It should be comprehensive, casually oriented, vertically integrated, horizontally integrated, internally comparable and useful [22].
• A modern PMS should support a process-oriented view. PMS does not provide a solution to improve a process. A PMS guides a process in a proper way, identifies its weakness, and helps to evaluate its impact on the process.
• It is necessary to interconnect the characterization of the relationship between performance measurement and strategy in a PMS [16].
Therefore, the above points, collected from the literature, serve as a base in developing a methodology for designing PMS. Information discussed above can be classified into three main requirements and they are as follows:
• Vertical Integration - Hierarchy levels (strategic-level, tactical-level and operational-level)
• Horizontal Integration - System Decomposition (value added time, non-value-added time, co-efficient of variation, reliability of people, reliability of material, reliability of equipment, reliability of schedule)
• Cause-and-effect relationship - Leading & Lagging Indicators
• Daily Management System Reporting Framework
The eight models discussed in this section are compared with the three main dimensions to identify the gap that exists in the designing PMS for manufacturing organization. Moreover, the PMS design proposed is limited to a specific manufacturing process and
focus is more on the operational level. The three main dimensions identified through literature review will be explained in detail in Chapter 3 along with the steps to design the PMS that bridges the gap between theoretical frameworks and practical challenges.
Although, a specific approach was defined in Chapter 1 and major requirements were identified in the previous section, it is very important to compare the findings with existing literature. According to this research, unique aspects of the approach are the building blocks listed for designing a conceptual model and method defined for validation and testing. They are as follows;
1. Conceptual Model - Major Requirements
• Vertical Integration
• Horizontal Integration
• Cause-and-Effect Relationship
• Daily Management System Reporting Framework
• Method for Application & Testing
2. Develop a throughput-based PMS framework using the conceptual model
• Apply it to a manufacturing case study simulation model
• Test the impact of flow, variation, and disruption using sensitivity analysis
• Track and report the performance of the system using daily management system (reporting framework)
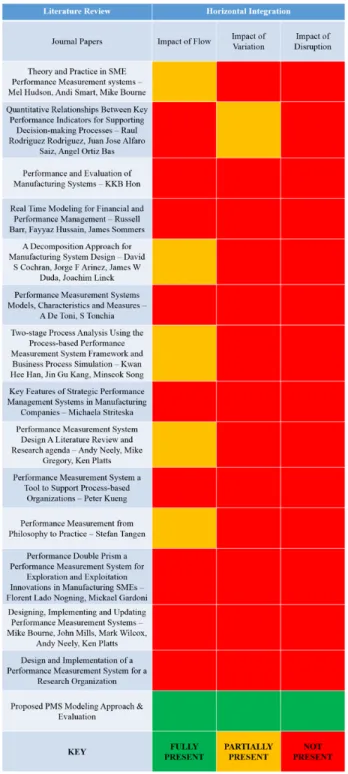
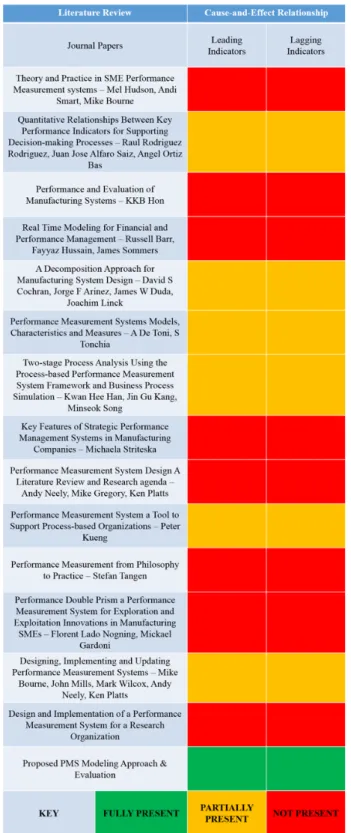
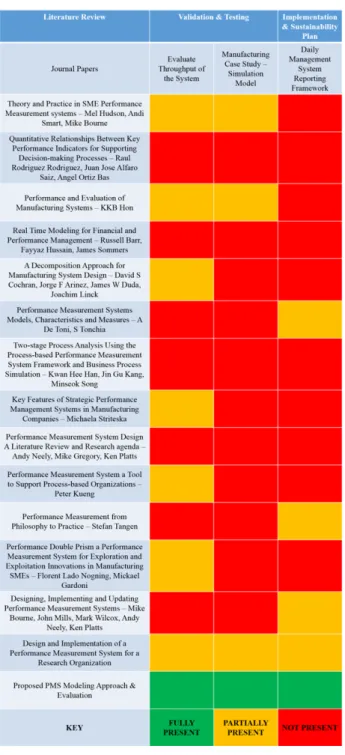
The Figure 2.1, Figure 2.2, Figure 2.3 and Figure 2.4 below compares the existing literature against vertical integration, horizontal integration, cause-and-effect relationship of the conceptual model developed in this research. The Figure 2.5 compares the method for validating and testing the proposed model with existing literature. From the comparison, it is evident that, the approach followed in this research is unique. Most importantly, the
PMS developed to evaluate the throughput of the manufacturing case study and validating the same using a simulation model makes this work stand out from other contributions that are related to this area of research.
Figure 2.2: Comparing the existing literature against Validation, Testing, Implementa-tion & Sustainability Plan
2.3
Summary
In summary, this chapter provided in-depth information regarding the existing work related to designing PMSs in manufacturing organizations identified through various journal articles. Based on the findings, there have been various frameworks proposed for PMS design, out of which seven of them serve as a base for other PMS models. Also, through this literature review, four requirements have been identified as major requirements for designing PMSs. Based on the main requirements, a conceptual PMS design methodology is proposed in the next chapter.
Chapter 3
Methodology
3.1
Introduction
In todays dynamic environment, designing a sound performance measurement system is a challenging and evolving task as mentioned in Chapter 1 and Chapter 2. More specifically, PMSs designed for the purpose of manufacturing systems are much less [20, 1] and manufacturing executives and managers struggle to design and implement performance measurement systems to monitor and track the performance of their organizations. The literature tends to offer them, mostly, broad guidelines but provides very limited practical examples / case studies [13]. To facilitate the practical operationalization of these broad guidelines, the gap between the practice, and the theoretical approaches and frameworks found in the literature, must be reduced [13]. Therefore, based on the findings from Chapter 2, the main objective of this chapter is to explain the main requirements of performance measurement system (PMS) identified through literature review and propose a conceptual model that bridges the exiting gaps. Therefore, the key deliverables of this chapter are as follows:
1. Main Requirements of PMS
3. Conceptual Model & Design of Throughput Based PMS Framework 4. Performance Measurement System Maturity Model
Whereas, the next chapter (Chapter 4) presents a PMS framework developed based on the conceptual model, apply it to a case study (simulation model) in order to validate and test the effectiveness of proposed PMS model.
3.2
Building Blocks of Conceptual Model
Through literature review it is evident that very few PMS models exists. But there is abundant work available regarding the requirements of designing an effective PMS. Also, one more significant observation from the literature review was that, the majority of the PMS models considers only the financial measures and there are very few models that consider the non-financial measures while designing PMSs. Only recent models suggest that financial measures alone cannot assess the overall performance, non-financial measures must be included when evaluating the performance of an organization. The requirements of an effective PMS are as follows:
• Vertical Integration
• Horizontal Integration
• Cause-and-Effect Relationship
• Daily Management System Reporting Framework
These requirements will be explained in detail in the following sections along with the conceptual framework proposed for developing throughput based PMS framework based on the conceptual model.
3.2.1
Vertical Integration
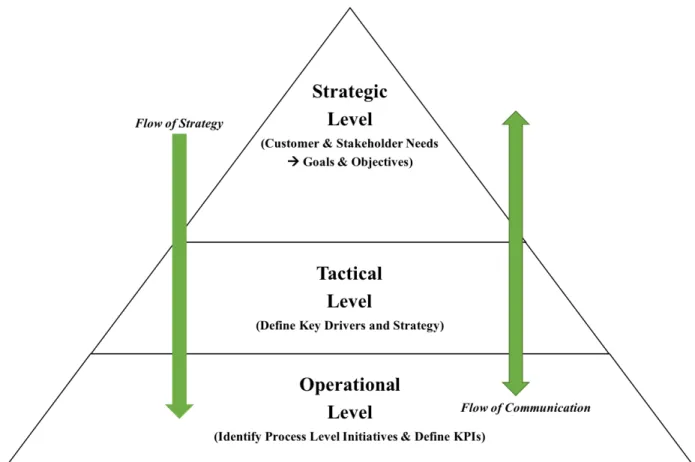
Definition: The vertical integration of a performance measurement system is defined as the alignment of overall goals and objectives with different levels in the organization. According to this model, the organization is divided into three hierarchical levels (strategic, tactical, and operational) that link the activities at every level to the overall goals and objectives of the organization. In a nutshell, vertical integration aligns the goals, objectives, their respective initiatives, and accountability at each level.
Purpose: The purpose of vertical integration in a performance measurement system is to translate the needs of the customer and stakeholder into goals and objectives. Clearly define the objective(s) for each level, establish linkage between the levels and align them with the overall goal(s) of the organization.
In Chapter 1, the problem statement emphatically specifies that PMS should have the ability to translate the customer and stakeholder needs into definite goals and objectives. In other words, goals and objectives should be obtained from the needs of the organization. Therefore, by vertically integrating the PMS based on hierarchical levels, it helps to link the firms strategy to operating decisions [9,8, 4]. Most importantly, this helps to support the alignment with strategy for each level. Also, the vertically integrated (hierarchical) models are characterized by cost and non-cost performance measures present at different levels [26, 7]. Therefore, a comprehensive process-based performance measurement conceptual framework with three hierarchical levels is constructed. The first level is the strategic level, second level is the tactical level, and third level is the operational level [23,13, 7]. Each of these levels are described below in detail.
Strategic Level
This is the top level and represents corporation vision and strategy [30]. They are designed with the entire organization in mind and begin with an organizations mission. The main objective of this level is to translate the needs of the customer and stakeholder into defined
goals and objectives. The next step is to prioritize the activities and identify the critical components. These critical components can certainly have a negative impact on the overall performance of the organization if they are not properly identified and addressed.
Tactical Level
This is the second level which represents the key drivers that are required to transform the goals and objectives into strategies [30]. The strategic level specifies the needs, but tactics involve the actual steps needed to achieve them. Tactics are drivers for implementing strategy. This level supports the strategic goals and objectives developed in the top level and defines the drivers for achieving the top level goals. This level is significant in bridging the gap between the management level and shop floor level. Because, this level aligns the goal of the organization with the shop floor level metrics based on the critical components identified in the system.
Operational Level
From the literature review, the design of PMS should have a strong focus on operational aspects since they are critical for the success of a manufacturing organization [11]. At the operational level, real-time performance measurement information presented in a meaningful and actionable way, is critical to stimulate performance improvement on the production layer [2]. Therefore, the system has to be further decomposed into a set of interrelated processes. Process mapping techniques play an important role in identifying a system and map the different processes present in it. This level regulates the day-to-day output relative to schedules, specifications, and other aspects. The main scope of this level is to streamline the process to work as quickly and eciently as possible. Perfect systems do not exist, and every system generates some form of waste. However, to improve the overall system performance, one should focus on identifying, prioritizing and fixing the
Figure 3.1: Vertical Integration
bottleneck of the system. Moreover, operational level metrics should monitor and control the operational eciency [23].
3.2.2
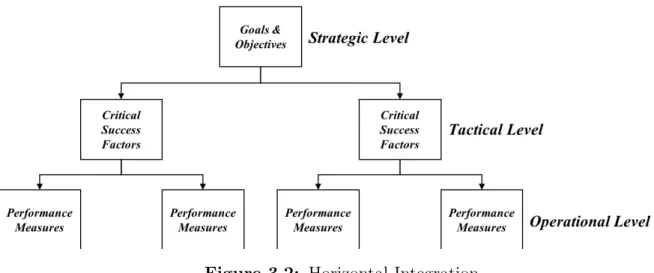
Horizontal Integration
Definition: The horizontal integration of a performance measurement system is defined as the decomposition of each level with respect to its critical components. For a Strategic level, the critical components are internal process, quality, cost, service; for a tactical level the critical components are assessing the impact of flow, variation, and disruption; for an operational level the critical components are obtained from the operational level processes, and their respective measures related to value added time, non-value added time, variation in the process outcomes, people, material, equipment, and schedule are defined.
Purpose: The purpose of horizontal integration in a performance measurement system is to understand the process in terms of its critical factors and resources accountable for the same; this helps to develop measures specific to those defined critical factors in order to track the performance of each critical component in the system and at each hierarchical level.
The performance of the overall system depends on its processes and, subsequently, the operations involved in each process. A highly detailed and decomposed system is an asset as it gives very specific information on critical components of the system [18]. One main function of PMS is to collect, process and deliver information on performance of various resources of a system [16]. According to literature, each process is represented by four critical resources [10]. Therefore, performance of the system is based on its ability to deal with those four critical resources in addition to other major critical components of the PMS. If one can address the four critical resources (listed below) within an organization, the probability of achieving the expectations of the stakeholders will be enhanced to a greater degree.
People
This refers to the workforce required to make any system function [10]. It is the most important link of the entire system. If we take a manufacturing system as an example, the designs of the workstations are improved according to ergonomic standards, employee morale is increased by a variety of measures, and employees are involved in decision-making. Also, literature shows that, organizations are focused more on the process related outcomes in comparison with the employee related outcomes [30]. It is to be noted that, PMSs have mainly been used as a managerial tool to assist the organization in motivating performance, implementing the organizational strategy, and achieving customer-oriented outcomes. If organizations can address the concerns of their employees and improve the quality of life of employees [4], they are more willing to assist in the achievement of
organizational goals and hence, it is very important to place greater emphasis on the measurement of employee-related outcomes.
Material
Materials include raw materials, works-in-process (WIP), and finished goods. The availability of supplies at workstations assures effective use of the resources available to process the materials [10]. Bottleneck in a process is a sign of poor planning, and results in lower performance. High availability of supplies is required to avoid the unfavorable events (e.g. downtime) and thus overcomes bottleneck in the process. Removal of these bottlenecks usually follows a PDCA (Plan-Do-Check-Act) cycle. An efficient manufacturing system should have less work-in-process. It reduces disruptions in the process and enhances reliability of the system. The PMS will be prone to failure if these requirements are not properly followed.
Equipment
Equipment includes all types of machines (predominant or back up) used to process mate-rials in the manufacturing systems. Middle-management usually focuses on maintenance of the equipment because it is directly related to the equipments reliability [10]. It is important to note that, the capacity of equipment plays a significant role in achieving the target production. Also, over utilization of the equipment leads to equipment failure. Therefore, any interruption due to equipment failure, will directly affect the effectiveness of the system, and ultimately impacts the customer satisfaction.
Schedule
Scheduling refers to the ability to predict the requirement, strategize the plan of action and schedule the activities accordingly [10]. An important aspect of scheduling is assigning the required resources. The process begins to function only when the scheduling is complete.
Figure 3.2: Horizontal Integration
If the scheduling is not done properly, it affects the productivity of the system and leads to unwanted disruptions in the process. The system performs effectively, if the scheduling is correct, assuming the worst case there are chances of system failure if scheduling goes wrong. If the system fails, it reflects a strong negative impact on the PMS. Therefore, the four components discussed above are very critical to any system. If any one of these critical components fail, it has a significant negative impact on the PMS. Therefore, it is important to horizontally integrate the PMS and develop performance measures related to these four critical components with respect to the nature of process.
3.2.3
Cause-and-Effect Relationship
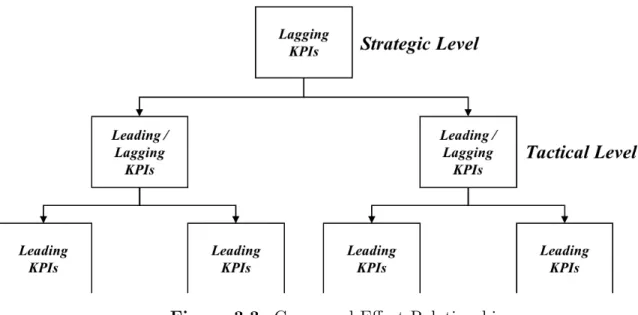
Definition: The cause-and-effect relationship of a performance measurement system is defined as the ability of the performance measurement system to track the (leading/lagging) indicators that lead to the (positive/negative) outcomes at any stage of the process.
Purpose: The purpose of establishing a cause-and-effect relationship in a performance measurement system is to track the behavior of metrics in the system, understand the impact of one metric on the other within the same level and between the hierarchical levels.
The cause-and-effect relationships between objectives could be explicated and managers would have additional decision-making information. There is not any performance measurement system framework that explicatively incorporates any mechanism for identi-fying, quantifying and projecting upstream the existing relationship between performance indicators. This research can objectively find and establish a cause-and-effect relationship between performance indicators defined within a performance measurement system and then project them upstream towards the strategic level of the performance measurement system, then becoming a management support tool providing additional information to decision makers [12, 27]. It is apparent that in a given performance measurement system there are various case-and effect relationships in place which are driven by the system and which ensure that the measures employed become self-fulfilling, which means that you get what you measure [7]. The general approach for designing performance measurement systems is based on measuring input and output and yet there is another main dimension to consider [20]. Also, a performance measurement system is characterized by the mixture of two types of performance measures. They are leading (cause) and lagging (effect) indicators respectively [15]. The leading indicators are performance drivers in the operational level. Also, leading indicators can be referred to as the operational inputs to the process.
Whereas, the lagging indicators can be referred to as core outcomes or measurable effects in tactical and have a serious impact on the strategic level of the performance measurement system. A balanced performance measurement system should have a mix of outcome measures (lagging indicators) and performance drivers (leading indicators) which yield a cause-and-effect relationship [10]. Lagging indicators are derived from the business objectives in order to represent the company performance according to their business goals. The lagging indicators report on how well an organizations strategy worked within a specific time period. In a process-based performance measurement system, it is significant to provide a balanced view of the manufacturing performance by capturing both the leading and lagging performance measures.
Leading Indicators
In the conceptual framework, the leading indicators are referred to as the performance indicators and are present in the process level. Performance indicators (PIs) are the fundamental set of indicators defined for a process. These indicators include the input provided for each process. The strategies formulated in the management level are applied on these indicators because these indicators serve as input to the manufacturing system. The PIs are referred to as leading indicators.
Lagging Indicators
In this conceptual framework, the lagging indicators are referred to as key performance indicators and are present in the system level. Key performance indicators (KPIs) are derived from the fundamental performance measures of a process. They are very useful to collect information on day-to-day activities and progress of a process. These indicators are very helpful to set strategies for achieving the objective of an organization. The frequency of measurement differs based on the nature of the indicator, but they are mostly collected on a daily basis. Establishing a cause-and-effect relationship by linking the performance measures (Leading Indicators: Performance Indicators (PIs) & Lagging Indicators: Key Performance Indicators (KPIs)) within and between different levels of the performance measurement system.
3.3
Daily Management System
Reporting
Frame-work
Industry reports and research indicate that while the organizations get a reasonable understanding on how to design an effective PMS, they struggle to realize its usage. Most importantly, the illustrations showcased in this section are developed based on Maine Medical Centers Operational Excellence Department Daily Management System
Figure 3.3: Cause-and-Effect Relationship
Framework, and the all credit goes to their department and team. Therefore, managers in such organizations, find it difficult to onboard all the employees, implement and use the PMS. For serving this purpose, daily management system reporting framework will be regarded as,
1. A disciplined, daily process of gathering data and assessing performance of KPIs in real-time.
2. The assessment is done with the intent to take immediate actions that correct the performance issues not just an information sharing session.
3. This creates a culture of seeing and solving daily issues in a quality and timely manner Continuous Improvement.
A daily management system reporting framework has to have three major components, and they are listed below:
1. KPI Alignment Chart To align the goals and objectives
3. Cause-and-Effect Analysis Chart To explain the cause-and-effect relationship In the next sections, the major components of the daily management system reporting framework will be discussed in detail. Also, the template for each of the components will be illustrated in this chapter.
3.3.1
Types of Performance Measures
Based on Reporting
Frequency
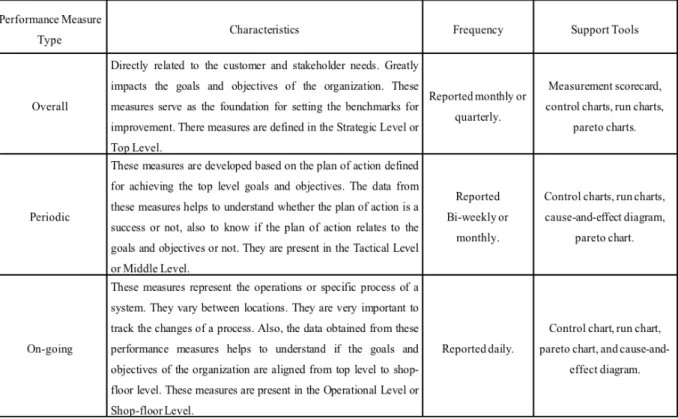
Before discussing the major components, it is important to understand how the perfor-mance measures have to be classified based on how frequently they are reported. All the performance measures do not have to be reported to every employee in the organization. It is more appropriate to report a defined set of performance measures that applies to each level of the organization. The Figure 3.4 given below classifies the performance measures depending on how frequently they are measured and reported to the employees in various levels of the organization, it also provides the characteristic of each measure and lists the support tools for analyzing each measure.
3.3.2
KPI Alignment Chart
The main purpose of a KPI alignment chart is to align the higher-level goals and objectives with the operational level KPIs. The KPI alignment chart consists of the following important information,
1. What is the goal of the system?
2. What is the strategy followed to achieve that goal? 3. What is the critical element that drives the system?
Figure 3.5: KPI Alignment Chart
5. What is the target of the system?
6. What is actually achieved by the system?
3.3.3
KPI Trend Analysis Chart
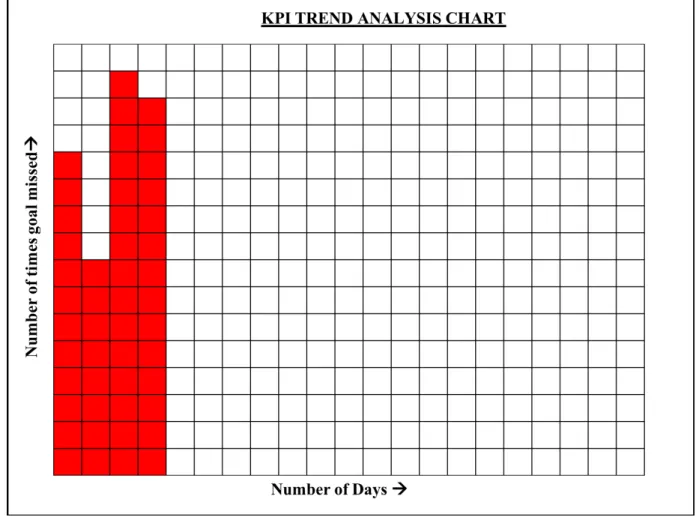
The main purpose of this KPI Trend Analysis chart is to visually display the impact of critical factors on key performance indicators. These charts can be color coded in order to easily understand what is going on in the system and create warning signals if there are
Figure 3.6: KPI Trend Analysis Chart
any abnormalities in the system. Following are the main characteristics / significance of using KPI trend analysis charts as part of daily management system reporting framework:
1. Highlight the trend of KPIs over time
2. Provide information of whether the goal was achieved or not on a daily basis
3. Helps to understand what the total contribution of that particular KPI is and how much is through to the next level and how much is wasted in the system
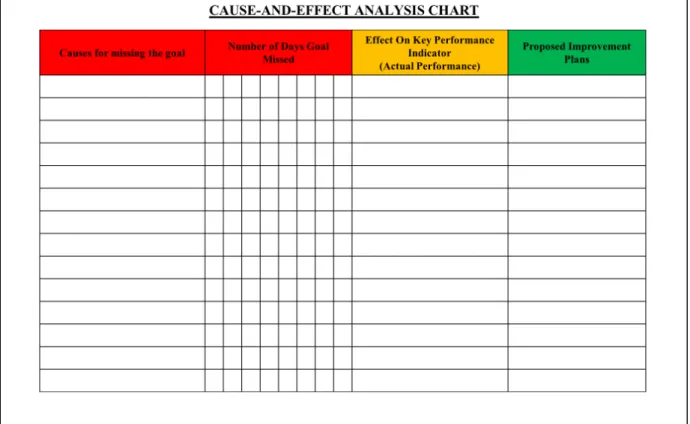
Figure 3.7: Cause-and-Effect Analysis Chart
3.3.4
Cause-and-Effect Analysis Chart
The main purpose of using a Cause-and-Effect Analysis chart is to list down all the cause that is related to not achieving the goal of the system. Following are the main characteristics / significance of using a cause-and-effect analysis chart as part of the daily management system reporting framework:
1. List all the causes for missing the goal
2. Track the number of days the goal was missed with respect to each cause 3. Identify the main causes for missing the goal
Figure 3.8: General Overview of Conceptual Model
3.4
Conceptual model & Design of Throughput Based
PMS Framework
3.4.1
Conceptual Model
The previous sections have discussed in detail about the major components of a PMS. Based on that, this section illustrates the conceptual model of a PMS. The major deliverable of this section is to layout a model that puts together all the information / components discussed earlier. Then, using that conceptual model, develop a throughput based PMS or evaluate the performance of a manufacturing system.
3.4.2
Design of Throughput Based PMS Framework
Based on the conceptual model discussed above, a PMS to evaluate the throughput of a manufacturing system had been developed and illustrated below. This throughput based PMS will be evaluated using a manufacturing case study (simulation model) in the next chapter. It is important to note that, the concepts discussed in this throughput based PMS framework has been derived from existing literature. The daily management system reporting framework will be illustrated later in the next chapter (Chapter 4), but the PMS framework is given below.
The PMS illustrated above is vertically integrated based on the hierarchical levels and they are as follows: Strategic Level This level identifies the needs of customers and stakeholders. Based on the needs identified, they are translated into goals and objectives. The goals and objectives focus on the following areas:
1. Internal Process
• Throughput measures the average output of a production process per unit time
• Work-in-process measures the total inventory between start and end points of a routing
• Cycle time measures the average time from when a job is released into a station or line when it exits
2. Quality
• Percentage of products with correct quality measures the total percentage of output that meets the required quality
• Percentage of reject measures the total percentage of output that does not meet the required quality
• Total maintenance cost measures the sum of planned (preventive) and un-planned (corrective) maintenance cost
• Cost of assets replaced measures the total cost of replacing the assets due to planned and/or unplanned maintenance
4. Service
• Percentage of orders delivered on-time measures the total percentage of orders completed and delivered on time
• Percentage of orders pending measures the total percentage of orders that has been delayed and not completed on time
5. Learning & Innovation
• Major improvement plans measures the total number of improvement plans or improvement projects implemented annually
• Employee training/education measures the number of hours employee spends on training/education related activities
In the throughput based PMS, the goal of the manufacturing system is to produce certain units of final product on a yearly basis. Therefore, the areas that should be focused is internal process. The other areas will have a greater impact on the overall performance of the manufacturing system if the internal process is not performing well. Each of the above areas are measured using a set of performance measures. Since, they are all outcome measures, they are defined as lagging KPIs. Often, higher-level management is focused on the performance of lagging KPIs because they summarize the overall performance of the organization. These higher level KPIs are impacted heavily by the strategy defined in the tactical level and performance of processes in the operational level. The outcome measures defined in the strategic level can be compared against the benchmarks or targets to understand the gaps in the system and identify the scope for improvement.
Figure 3.10: Strategic Level Throughput Based PMS Framework
In the next level, which is the tactical level, plan of action has to be developed for achieving those goals and objectives defined in the strategic level. Also, it is important to identify the critical factors / drivers that drive the system and has the ability to have a negative impact on the performance of the system if they are not properly addressed in this level. The managers are usually responsible for identifying these critical factors and develop a plan of action to measure and reduce its impact. The critical factors identified in the manufacturing system are as follows:
1. Impact of Flow
• Value added time
• Non-value added time 2. Impact of Variation
• Co-efficient of variation in process time 3. Impact of Disruption • Reliability of people • Reliability of material • Reliability of equipment • Reliability of schedule
The impact of flow, is characterized by the percentage of value added time and non-value-added time. The main purpose of considering the impact of flow, is to reduce any unnecessary flow in the manufacturing system. Also, improvement plans should focus on converting the non-value added time into value added time. Next is the impact of variation, it is characterized by the co-efficient of variation in arrival and process time. The variation in arrival of material to any workstation of the manufacturing system can largely impact the outcome of the process. Equally important is the variation in process times, if there is a significant variation in process time, the subsequent process will have a greater negative impact, and the overall performance of the system will not meet the expectations. Following the impact of variation, it is important to consider the impact of disruption. Disruption is characterized as any unplanned event in the system and it is often related to four major components in the system and they are people, material, equipment, and schedule respectively. If any one of these components have any disruption issue, then the system will more likely stop functioning. Therefore, it is essential to list down the performance measures that can track the reliability of the four critical components. Therefore, in conclusion, if these three critical factors flow, variation, and disruption are not under control, the overall performance of the manufacturing PMS will not achieve its target. Also, if the relationship between the leading and lagging KPIs are not established, it is hard to track the area of lower performance, and as a result there will be no trigger for continuous improvement.
1. Value added time
• Raw process time
• Time for internal setup 2. Non-value added time
• Material move time
• Material waiting time
• Time for external setup 3. Co-efficient of variation in arrival
• Arrival rate of material
• Batch size
4. Co-efficient of variation in process time
• Raw process time
• Time for internal setup
• Time for external setup 5. Reliability of people
• Number of workers available
• Man hours available
• Man hours absent 6. Reliability of material
• Percentage of material arriving with correct quantity