ESG INVESTING AND MUTUAL FUND MANAGER
BEHAVIOR
A Dissertation
Presented to the Faculty of the Graduate School
of Cornell University
in Partial Fulfillment of the Requirements for the Degree of
Doctor of Philosophy
by
Manuela Moura Dantas
c
2019 Manuela Moura Dantas
ESG INVESTING AND MUTUAL FUND MANAGER BEHAVIOR
Manuela Moura Dantas, Ph.D.
Cornell University 2019
I explore whether managers of Environmental, Social, and Governance (ESG) funds
differ in their disclosure behavior as compared with conventional fund managers. Prior studies suggest that investors of ESG funds have long-term investment horizons, thereby
encouraging fund managers to be less concerned about their quarterly portfolio
disclo-sure. Using a database of third-party sustainability score of mutual funds, I find that
funds that rank high on the score carry out less portfolio window dressing. Further, I
provide evidence that ESG fund managers use long-term performance metrics in their
investment decisions, aligned with their clients’ long-term investment horizons.
More-over, I find that the heterogeneity in disclosure behavior is not due to the endogenous
BIOGRAPHICAL SKETCH
Manuela Moura Dantas was born in Rio de Janeiro, Brazil, on October 24, 1985. She
received her undergraduate degree in Accounting from Universidade Federal do Rio de
Janeiro (UFRJ), Brazil, in 2011. She had a brief career in the financial services industry,
serving as a financial analyst at Banco Modal. Prior to her doctoral studies at Cornell,
she also pursued an M.S. in Finance from Fundac¸˜ao Getulio Vargas (FGV). She will
join the David Nazarian College of Business and Economics of the California State
ACKNOWLEDGEMENTS
I am enormously thankful to my adviser, Sanjeev Bhojraj, for his insightful feedback
and support throughout the program. I am also grateful to Rob Bloomfield, George
Gao, Kenneth Merkley, and Mani Sethuraman, Felipe Silva, and John Tobin for their
professional guidance and personal advice.
I am thankful to my friends and fellow PhD students who shared with me the agony
and the enthusiasm characteristic of the academic career. I am grateful to Annie
Table of Contents
Biographical Sketch . . . iii
Dedication . . . iv
Acknowledgements . . . v
Table of Contents . . . vi
List of Tables . . . vii
List of Figures . . . viii
1 ESG Investing and Mutual Fund Manager Behavior 1 1.1 Introduction . . . 1
1.1.1 Related Literature and Empirical Predictions. . . 6
1.1.2 ESG funds versus conventional funds . . . 7
1.1.3 Fund manager short-termism . . . 9
1.2 Data . . . 11
1.2.1 Measurement of Window Dressing . . . 14
1.3 Empirical Results . . . 15 1.4 Additional Analysis . . . 17 1.4.1 Fund Flow. . . 18 1.4.2 Investment Horizon . . . 21 1.4.3 Managers’ Characteristics . . . 24 1.5 Conclusion . . . 26 A Variable Descriptions 28
List of Tables
1.1 Descriptive Statistics and Correlation Coefficients . . . 13
1.2 ESG Funds and Window Dressing . . . 18
1.3 Fund Flow Sensitivity to Winners and Losers . . . 21
1.4 Fund Manager Investment Horizon . . . 23
List of Figures
1.1 ESG Funds Flows and Assets Under Management (AUM). . . 3 1.2 Histograms of Rank Gap Score for Conventional and ESG funds . . . . 16 1.3 Quarterly Fund Flows . . . 20
CHAPTER 1
ESG INVESTING AND MUTUAL FUND MANAGER BEHAVIOR
1.1
Introduction
The advent of Environmental, Social, and Governance (ESG) investing1is arguably one
of the most significant innovations in the asset management industry in recent years. In
2017, funds employing variants of ESG criteria comprised approximately $95 billion
of assets under management – representing an astonishing increase of nearly 60% from
the previous year (see Figure1.1). BlackRock, the world’s largest investment
manage-ment company, recently announced that the company will from now on require its fund
managers to consider ESG criteria in their investment decision-making process2. The
surge in popularity of ESG Investing – once considered a niche investment philosophy
– is increasingly drawing the attention of practitioners and scholars, fostering an
im-portant debate on whether socially responsible investment vehicles can competitively
yield financial returns to their investors in the face of additional constraints in
portfo-lio holdings and investment strategies vis-`a-vis conventional (non-ESG) funds (e.g., see
El Ghoul and Karoui,2017,Fabozzi et al.,2008,Hong and Kacperczyk,2009).
Despite the increasing relevance of ESG3 in the mutual fund industry, our
under-standing of the specific mechanisms that separate ESG fund managers from their
con-1What constitutes an acceptable set of ESG criteria is subjective and each fund applies its own set
of ESG criteria. Environmental criteria examine how firms deal with their negative environmental exter-nalities, such as energy use, waste, pollution, and natural resource conservation. Social criteria examine the firms’ relationship with their stakeholders, such as employees, suppliers, customers, and local com-munities. The governance criteria examine the firms’ internal controls, executive pay, shareholder rights, etc.
2For more details, see http://lipperalpha.financial.thomsonreuters.com/2018/08/
monday-morning-memo-has-esg-gone-mainstream/
3The termsESG funds,Socially Responsible funds, andSustainable fundsare often used
ventional counterparts is limited. For instance, although we know about the impact
that the behavior of mutual fund managers has on the performance of funds (Agarwal
et al.,2014,Chevalier and Ellison,1997,1999a,Cremers and Pareek,2016), we do not
know if the investment decisions of managers of ESG funds differ from the decisions of managers of conventional funds regarding portfolio disclosure, investment choices,
and investment horizon. Theoretical work in the area shows that investors may be
will-ing to pay a premium to have socially responsible investments and should invest with a
long-term perspective (Gollier and Pouget,2014,Heinkel et al.,2001). Consistent with
the hypothesis of longer investment horizons, empirical studies demonstrate that capital
flows of socially responsible funds are less sensitive to past negative returns (Bollen,
2007, Renneboog et al., 2011). However, can the investment philosophy of investors’
clientele determine the behavior of fund managers? Even assuming that the
tempo-ral preferences of investors would create implicit incentives for managers to have longer
investment horizons, incentive alignment cannot be assumed, as managers of ESG funds
have a compensation structure based on their quarterly or annual financial performance
similar to that of conventional fund managers.
In this paper, I explore how the investment horizon of investors of ESG funds
trans-lates to the behavior of the managers of such funds. Specifically, I analyze the disclosure
activities of portfolio managers of ESG mutual funds. Open-end mutual funds are
re-quired, under SEC regulation, to report a complete list of their holdings on a quarterly
basis. I am interested in investigating the opportunistic practices that derive from the
excessive focus on short-term developments (short-termism). My focus on managers’
behavior is motivated by prior work that suggests that implicit incentives generated by
career concerns affect managers’ behavior and, as a consequence, funds’ performance
(Chevalier and Ellison, 1999a) and by studies that suggest that the short-termism of
Figure 1.1 ESG Funds Flows and Assets Under Management (AUM) 2015 2016 2017 0 2 4 6 8 Estimated Net Flo w
Estimated Net Flow ($ Billion) Assets Under Management ($ Billion) 0 25 50 75 100 Assets Under Management
Source: Morningstar Direct
managers of investee firms to place excessive focus on short-term projects (Agarwal
et al., 2017, Bushee,1998). The underlying premise is that investors of ESG funds, by
focusing on long-term results, alleviate the pressures and incentives that induce fund
managers to consistently report superior returns in the short run. Consequently, fund
managers become less reluctant to produce quarterly reports that demonstrate that
hold-ings of stocks have experienced sharp performance declines in the short-term.
To specifically examine whether ESG funds managers have different disclosure be-havior from their peers, I focus on portfolio window dressing, which is the fund
the quarter, therefore misleading their fund investors. I useAgarwal et al.(2014)’srank
gap measure of window dressing, which captures the spread between the rank of the
fund’s actual performance and the composite ranks of winner/loser holdings. Agarwal
et al.(2014) argue that portfolio window dressing has the potential to adversely affect
fund value through unnecessary portfolio churning. Consistent with the proposition that
ESG fund managers are less concerned that a poor quarter could lead to an outflow of
investors, I find that they engage in less portfolio window dressing than conventional
fund managers.
Motivated by the differences in disclosure behavior, I perform additional analyses to better understand what underlying factors and mechanisms drive my results. To test
whether investor behavior is one of the forces driving managers’ disclosure behavior,
I examine investors’ sensitivity to information on portfolio holdings. On average,
in-vestors of ESG funds are slightly less sensitive to the presence of loser stocks in the
portfolio. These results corroborate the investors’ clientele hypothesis – that is, ESG
funds attract a distinct set of investors with longer investment horizons than those who
invest in conventional mutual funds.
While prior studies support the hypothesis that investors of ESG funds and
conven-tional funds differ in their inter-temporal preferences (Bollen, 2007, Renneboog et al.,
2011), the assumption that capital market intermediaries (i.e., mutual funds) should be
treated as a “veil” reflecting the preferences of investors is overly simplistic (He and
Kr-ishnamurthy, 2013). I then turn to investigate whether ESG fund managers’ investment
horizon differ from that of conventional managers. For this purpose, I use two prox-ies for fund trading frequency – turnover rate and holding duration. Studprox-ies show that,
on average, funds that trade more frequently underperform (Chakrabarty et al., 2017,
could harm fund performance, managers have incentives to adopt a short-term
perspec-tive. This occurs because chasing long-term mispricing could be more expensive and
lead investors to misattribute inferior short-term stock returns to the manager’s low
abil-ity (Shleifer and Vishny,1990,1997). Concern over the manager’s trading ability could
generate an outflow of investors and, consequently, increase the risk that the manager is
terminated. I find that ESG fund managers indeed have longer investment horizons and
trade less.
Given the well-documented differences in investors’ clientele of ESG funds and tra-ditional funds, a corporate governance mechanism that could plausibly explain the
dif-ferences in window-dressing and trading frequency could be simply the endogenous
choice of fund managers by investment management firms. In other words, investment
management firms could screen fund managers based on different dimensions of their education and cultural background, placing more (or less) emphasis on some
character-istics contingent on whether the job applicant would manage an ESG or conventional
fund. To explore this possibility, I examine several characteristics, such as education,
dominant style, professional busyness, gender, and tenure. I find only two distinct
char-acteristics between ESG fund managers and conventional fund managers: ESG fund
managers, on average, have more experience managing active funds than passive funds;
and, on average, hold an additional position inside the investment management company
(e.g., analyst, trader, broker liaison). Overall, these findings further support the
interpre-tation that the difference in disclosure behavior of ESG fund managers is a manifestation of differences in investors’ pressure and focus on short-term performance.
Taken together, my contributions speak to different strands of literature. First, my empirical results further our understanding of ESG investing. Whereas prior research
in-stitutional money managers is relatively limited. To the best of my knowledge, this study
is the first to examine the relationship between the myopic behavior of fund managers
and ESG investing.
I present several pieces of evidence consistent with the hypothesis that investors
of ESG funds, through their long-term orientation, lessen capital market pressures that
induce fund managers to constantly report superior short-term investment decisions. In
addition, this paper also contributes to the literature analyzing the impact of managers’
skills on their decisions. My study fails to find any evidence that differences in skill sets are the drivers of ESG fund managers’ less myopic behavior. My results emphasize
the role of additional incentives, besides financial compensation, on managers’ myopic
decisions.
Finally, this paper complements the extensive literature on mutual funds by
identify-ing how a fund-specific characteristic (ESG) that pertains to a broad class of investment
strategies and style relates to the investment behavior of fund managers.
The remainder of the paper proceeds as follows. Section 2 describes the related
literature and the empirical predictions. Section 3 provides the data description and
summary statistics, while Section 4 discusses the empirical results. Section 5 presents
additional analysis, and Section 6 concludes.
1.1.1
Related Literature and Empirical Predictions
Following the increasing relevance of ESG and corporate social responsibility (CSR),
there is a growing body of literature in accounting and finance on the real and reporting
that firms with high CSR activities have less opaque financial reports and are less likely
to manage earnings (Dhaliwal et al.,2011, Kim et al., 2012). Moreover, CSR activities
of firms are also related to less informed trading (Gao et al.,2014), and firms with high
scores on material ESG issues tend to outperform those with low scores (Khan et al.,
2016).
From the standpoint of institutional investors, various empirical studies emphasize
the relationship between different investors’ decisions and the ESG performance of their investee firms. For instance, when a mutual fund actively engages with an investee
firm to address ESG concerns, the latter generates positive abnormal returns over the
year following the engagement (Dimson et al., 2015). Recent studies show that after
recognizing the financial value of ESG, institutional investors persuade investee firms to
improve their ESG performance (Dyck et al.,2018) and that institutional investors with
longer horizons tend to prefer higher ESG firms (Starks et al.,2017).
1.1.2
ESG funds versus conventional funds
Previous studies indicate that ESG investors differ from ordinary investors in many di-mensions. For example, Bollen (2007) analyzes investor cash flows of mutual funds
and finds that socially responsible mutual funds have lower volatility in their monthly
fund flows. In addition, he establishes that capital flows to socially responsible funds
are more sensitive to past positive returns and weakly less sensitive to negative past
re-turns. Using an international setting,Renneboog et al.(2011) corroborate the findings
of Bollen(2007) and document that the investors’ flows of socially responsible funds
are less sensitive to the average return of the previous 12 months. More recently, a study
provider with a survey and an experiment examines why investors hold socially
respon-sible mutual funds. They conclude that intrinsic social preference and social signaling
are major determinants of holding ESG equity funds. They also find financial
motiva-tions for investors’ decisions, since they are less likely to invest in ESG funds if they
expect these funds to underperform relative to conventional funds – albeit investors with
strong social motivations are willing to forgo financial returns to align their investments
with their social preferences.
However, it is not clear whether the behavior of fund investors is a sufficiently strong incentive for managers to pursue long-term investment strategies desired by their
vestors’ clientele. First, seminal theories argue that managers’ behavior might be
in-fluenced by career concerns (Fama,1980,Holmstr¨om,1999,Lazear and Rosen,1981).
Moreover, another body of literature documents different agency conflicts between fund managers and their investors. They emphasize that managers’ investment decisions can
be affected both by the explicit compensation schemes and by implicit incentives result-ing from their aspiration to attract new investors (Chevalier and Ellison, 1997,1999a,b,
Khorana,1996, Modigliani and Pogue, 1975). For instance,Brown et al.(1996) claim
that the competitive nature of the mutual fund environment alone can affect managers’ portfolio decisions. According to the authors, the mutual fund industry resembles a
tournament in which managers compete for new investors. Their evidence highlights
this behavior, as they establish that managers who are likely to end up as losers
(win-ners) shift their investments so as to increase (decrease) the risk levels of their portfolios.
Chevalier and Ellison(1999a) examine how the fear of getting fired can affect mutual
fund managers’ behavior. Their findings indicate that managers are punished for widely
deviating from the unsystematic risk level in their corresponding objective group.
Con-sequently, young managers, who have higher career concerns than senior managers, end
getting penalized.
1.1.3
Fund manager short-termism
The voluminous literature on corporate myopia suggests that the excessive focus on
short-term performance is positively associated with earnings management and less
ef-ficient real investment decisions (Bhojraj et al., 2009, Roychowdhury, 2006). In his
seminal work, Roychowdhury (2006) shows evidence of managers manipulating real
activities to avoid reporting losses. Bhojraj et al. (2009) find that firms are willing to
cut discretionary expenses and manage accruals in order to exceed analyst forecasts and
that firms that beat forecasts by managing earnings enjoy a short-term stock price benefit
that is typically reversed over a three-year period.
The short-termism of fund managers can be harmful to both fund investors and
in-vestee companies. Bushee(1998), for example, concludes that institutional ownership,
on average, works as an efficient corporate governance mechanism by mitigating the adverse incentives for corporate managers to reduce their R&D investments. However,
his findings also indicate when considering the ownership by institutional investors with
high portfolio turnover, the overall effect is reversed – i.e., a large proportion of short-termist institutional owners increases the likelihood of managers cutting R&D to reverse
earnings declines. Agarwal et al.(2017) discover evidence of the direct effect of fund manager short-termism on corporate short-termism. Exploiting the increase in the
fre-quency of mandatory disclosures of portfolio holdings by mutual fund managers, they
find that more frequent disclosures are associated with the increasing myopia of fund
managers, which leads to subsequent declines in the innovation activities of firms with
A possible channel by which fund managers’ short-termism can harm their
corre-sponding investors is through portfolio window dressing, which is the strategy of adding
winners and/or eliminating losers to the portfolio in order to mislead investors regard-ing their true ability (Agarwal et al., 2014, Lakonishok et al., 1991). To engage in
window dressing, managers have to buy (sell) stocks that have recently outperformed
(underperformed), hence, buying (selling) potentially overpriced (underpriced)
securi-ties. This unnecessary portfolio churning incurs high trading costs and is shown to be a
value-destroying activity, eventually worsening future fund performance (Agarwal et al.,
2014).
Motivated by prior literature, I posit that the long-term orientation of ESG investors
decreases capital market pressures that induce fund managers to regularly report
supe-rior short-term investment decisions, consequently decreasing their incentives to engage
in opportunistic disclosure behavior. This prediction can be formalized as the main
hypothesis of the paper, stated in a directional form:
Hypothesis: Managers of ESG mutual funds are less likely to engage in portfolio window dressing than managers of conventional (non-ESG) mutual funds.
This hypothesis is not without tension. ESG mutual funds are subject to
compen-sation structures strictly based on financial performance akin to those of conventional
funds. That is, there are also reasons supported by the theoretical and empirical
litera-ture that would predict no differences in portfolio window dressing between ESG and conventional funds.
1.2
Data
A key empirical challenge when investigating differences between ESG and conven-tional mutual funds is the fact that fund-specific actions (namely, investment
philoso-phies and trading strategies) are not directly observable. Whereas some mutual funds
are explicitly self-proclaimed as ESG funds, there is no specific market or regulatory
mechanism that prevents these funds from endogenously choosing to be ESG in name
only – i.e., to attract new investors. One way to assess whether funds follow ESG
poli-cies is through a sustainability rating assessed by a plausibly independent third party
provider. Since 2016, Morningstar gives mutual funds a rating based on how well the
holdings in their portfolio are managing ESG risks and opportunities relative to their
peers.
To calculate the ratings, Morningstar uses firm-level ESG scores provided by
Sus-tainalytics4, a research firm that provides ESG scores along with assessments of
com-panies’ involvement in ESG-related controversies for more than 4,500 firms globally, in
addition to tracking and categorizing ESG-related controversial incidents for more than
10,000 firms. The portfolio score is an asset-weighted average of the ESG scores of the
portfolio holdings, with deductions made for securities of firms involved in
controver-sial incidents. Then, based on their portfolio sustainability scores, funds are assigned
one of the following five descriptive ranks relative to their peers: Highfor the top 10%
of the funds; Above Average for the next 22.5%; Average for the next 35%; Bellow
Average for the next 22.5%; and Low for the bottom 10% of the funds. Morningstar
does not provide historical data on its sustainability ratings. To minimize this issue,
I collect information on the last four issued ratings and label funds “ESG” only when
they have a High ratings in each of the four periods. Thereby, I aim to capture funds
4Morningstar claims to use Sustainalytics due to its reputation for transparent, insightful research, and
that have consistently high ESG ratings through time5. I merge the lists of ESG funds
to the CRSP Survivor-Bias-Free US Mutual Fund Database. CRSP Mutual Fund
pro-vides various fund-specific characteristics along with portfolio holdings information. I
use CRSP Monthly Stock and Compustat to gather market and fundamental data on the
funds’ equity holdings. Funds that do not have the requisite information from all three
databases in any given quarter are dropped from the sample. I restrict the analysis to
actively managed U.S. equity mutual funds, excluding index, bond, and international
funds from my sample6. Since CRSP’s fund portfolio holdings data starts in 2001, I use
a quarterly sample from 2001 to 2017 for the analysis, comprising a total of 68 quarters.
Following early studies that claim that small mutual funds behave differently from other funds (Bhojraj et al.,2012,Chen et al.,2004,Elton et al.,2001), I restrict the sample to
mutual funds with total net assets (TNA) exceeding $15 million. For funds with
mul-tiple share classes in CRSP, I compute the sum of TNA in each share class to arrive at
the TNA in the fund. The final sample is comprised of 4,696 unique conventional
mu-tual funds and 127 unique ESG mumu-tual funds. To correct for the naturally unbalanced
properties of the samples of ESG and conventional funds, in all the empirical tests I use
entropy balancing with fund size, age, and strategy as parameters7. Table1.1 provides
the summary statistics for the key variables used in the study. In panel B, I report the
means and standard deviations of the variables for ESG mutual funds and conventional
mutual funds. In panel C, I report time-series averages of the cross-sectional correlations
between various fund characteristics. Consistent with previous studies,LogFamilyS ize,
LogFundS ize, andLoadare positively correlated with each other.
5I run the same tests presented in this paper using a continuous sustainability score and an indicator
variable that takes a value of one if the fund is in the highest decile of the average sustainability score and obtain similar, although weaker, results.
6To do this, I select mutual funds whose CRSP Objective Code (crsp obj cd) is “ED,” “EDCM,”
“EDCS,” “EDSC,” “EDSI,” “EDSN,” “EDST,” “EDSU,” “EDYB,” “EDYG,” “EDYH,” or “EDYI.”
7Entropy balancing is a re-weighting technique that represents a generalization of propensity score
matching to achieve significantly improved covariate balance across treatment and control samples (
Table 1.1 Descriptive Statistics and Correlation Coefficients
Panel A: Sample Selection
# of ESG ESG Conventional
Funds Funds Funds
US Equity Funds (actively managed) 244 Number of unique funds 127 4,696 Missing CRSP items (74) Number of unique families 78 770 Funds with TNA<$15 million (43) Average funds per quarter 39 1,331
Total 127
Panel B: Descriptive Statistics
Mean SD Min Max
ESG Funds
Fund size ($ million) 856.06 1,135.51 15.60 4,617.60
Log fund size 6.21 1.80 2.83 8.97
Family size ($ million) 137,650.40 282,766.70 25.50 1,500,285.00 Log family size 9.78 2.52 3.24 14.22
Turnover 0.48 0.38 0.05 2.83
Holding duration (years) 1.88 0.93 0.17 3.89 Manager tenure (years) 8.32 5.21 0.42 20.25
Fund age 16.86 14.34 1.33 80.67 Expense ratio 0.012 0.003 0.006 0.024 % Fund flows 0.01 0.11 -0.32 0.91 Market-adj returns 0.004 0.028 -0.106 0.082 Beta-adj returns -2.97 0.64 -6.40 -1.29 3 factor-adj returns -3.23 1.52 -7.51 2.08 4 factor-adj returns -2.97 1.68 -7.58 2.33 Conventional Funds
Fund size ($ million) 614.25 1415.06 15.70 9124.50
Log fund size 5.06 1.58 2.75 9.12
Family size ($ million) 161,417.20 337,064.40 25.50 1,874,617.00 Log family size 10.06 2.54 3.24 14.44
Turnover 0.83 0.78 0.03 4.82
Holding duration (years) 1.50 0.90 0.00 4.69 Manager tenure (years) 8.22 5.13 0.42 24.58
Fund age 14.94 13.55 0.50 93.42 Expense ratio 0.012 0.004 0.001 0.025 % Fund flows 0.01 0.17 -0.32 1.04 Market-adj returns -0.002 0.036 -0.338 0.412 Beta-adj returns -3.05 0.95 -12.32 3.88 3 factor-adj returns -3.44 1.98 -26.48 6.73 4 factor-adj returns -3.32 2.21 -24.65 20.43
Panel C: Time-series averages of correlations between fund characteristics
Log Log Expense
Turnover Fund size fund size Fund flows family size ratio Fund age Load
ESG Funds
Turnover 1
Fund size -0.20 1
Log fund size -0.13 0.73 1
Fund flows -0.04 -0.18 -0.15 1
Log family size 0.14 0.30 0.63 -0.11 1
Expense ratio 0.17 -0.38 -0.42 0.09 -0.17 1 Fund age 0.00 0.54 0.49 -0.24 0.32 -0.34 1 Load -0.12 0.17 0.22 -0.18 0.26 -0.01 0.33 1 Conventional Funds Turnover 1 Fund size -0.17 1
Log fund size -0.19 0.72 1
Fund flows 0.04 -0.24 -0.20 1
Log family size -0.06 0.27 0.37 -0.10 1
Expense ratio 0.18 -0.32 -0.42 0.07 -0.21 1
Fund age -0.11 0.40 0.46 -0.19 0.18 -0.26 1
Load -0.04 0.08 0.10 -0.07 0.15 0.05 0.32 1
This table presents descriptive statistics of the main variables used for estimating Equations (1.3) and (1.4). For variable descriptions, see the appendix A.
1.2.1
Measurement of Window Dressing
I followAgarwal et al.(2014) to construct the window dressing measures. Their
ratio-nale is that, on average, poorly performing funds should have a greater percentage of
loser stocks and a smaller percentage of winner stocks in their portfolio when compared
to well-performing funds. Conversely, poorly performing funds with a high percentage
of winners and a low percentage of losers suggests a higher likelihood of window
dress-ing behavior. I use theAgarwal et al.(2014) measure of window dressing calledRank
Gap, which is a relative measure that captures the discrepancy between a
performance-based ranking of a fund and a ranking performance-based on the proportions of winner and loser
stocks disclosed by the fund at quarter-end. The intuition is to capture situations where
the overall performance of the fund is inconsistent with the corresponding performance
of its portfolio holdings.
For each fiscal quartert, I create quintiles of all domestic stocks in the CRSP stock
database by sorting stocks according to their returns over the past three months. The
first (fifth) quintile consists of stocks that achieve the highest (lowest) returns. Next,
using funds’ reported holdings, I calculate the proportion of each fund’s assets invested
in the first and fifth quintiles, referring to these two extreme quintiles as winner and
loserproportions, respectively. I then rank the funds between 1 and 100 in three ways:
(1) for the performance rank I sort funds indescendingorder by their quarterly returns;
(2) for the winner rank I sort funds indescendingorder according to their proportion of
winner stock holdings; (3) for the loser rank I sort funds inascendingorder according to
their proportion of loser stock holdings. That way, a well-performing fund should have
high ranks (i.e., closer to the 1st percentile) and a poorly performing fund should have
low ranks (i.e., closer to the 100th percentile) in all three ranks. However, a fund with
should have a greater likelihood of window dressing. The Rank Gap is computed as
follows:
RankGap =
Per f ormanceRank− WinnerRank+LoserRank
2
200 (1.1)
The measure is scaled by 200 to lie between –0.5 and 0.5. The higher the Rank
Gapis, the larger the discrepancy between the fund’s actual performance and the fund’s
disclosure of winners and losers stocks – therefore, the greater the likelihood of window
dressing. For the empirical analysis, I useRank Gapin its continuous form and also as
an indicator variable based on the top 10% and 20% values of thisRank Gapcontinuous
measure. Figure1.2plots the histogram of the frequency distribution of theRank Gap
score for conventional funds (Panel A) and ESG funds (Panel B).
1.3
Empirical Results
In order to empirically test my main hypothesis that ESG fund managers differ from their conventional counterparts in their opportunistic disclosure behavior, I estimate the
following reduced-form specification:
W Di,t = αi+γt+β1ES G f undi+
X
βiZi,t +i,t, (1.2)
whereiindexes different mutual funds andtquarters. The variableW Di,tdenotes the
dif-ferent proxies for window dressing – i.e.,Rank Gap, as the continuous variable defined
in Section 3.1 and indicator variables based on the top 10% and 20% of the distribution
.
Figure 1.2 Histograms of Rank Gap Score for Conventional and ESG funds
0 1 2 3 4 D e n si ty -.4 -.2 0 .2 .4 Rank Gap
Panel A: Conventional Funds
0 1 2 3 4 D e n si ty -.4 -.2 0 .2 .4 Rank Gap
andγt time fixed effects. ES G f undi is an indicator variable that equals one if the fund
has high ESG ratings according to Morningstar. The vectorZi,t denotes a set of control
variables with previously documented effects on funds’ performance and disclosure be-havior, such as load, fund flows, fund size, family size, expense ratio, fund age, and fund
return.8 In all empirical specifications throughout this paper, I cluster standard errors at
the fund level to account for correlation between repeated observations associated with
the same mutual fund (Petersen,2009).
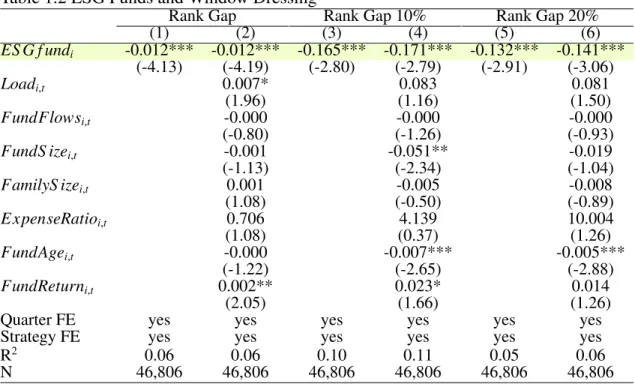
Table 1.2 depicts the OLS and probit estimates for all three measures of window
dressing. My main coefficient of interest is β1, whose estimates are all negative and
statistically significant (p-values<0.01). These results, while far from conclusive, are consistent with previous studies that show that investors of ESG funds are less sensitive
to negative financial performance, therefore reducing managers’ incentives to engage in
opportunistic disclosure behavior. In other words, they have less incentive to mislead
investors when they have a poor quarter performance.
1.4
Additional Analysis
Motivated by the differences in disclosure behavior documented in Table1.2, I perform additional analyses to better understand what underlying factors and mechanisms are
driving my results.
Table 1.2 ESG Funds and Window Dressing
Rank Gap Rank Gap 10% Rank Gap 20%
(1) (2) (3) (4) (5) (6) ES G f undi -0.012*** -0.012*** -0.165*** -0.171*** -0.132*** -0.141*** (-4.13) (-4.19) (-2.80) (-2.79) (-2.91) (-3.06) Loadi,t 0.007* 0.083 0.081 (1.96) (1.16) (1.50) FundFlowsi,t -0.000 -0.000 -0.000 (-0.80) (-1.26) (-0.93) FundS izei,t -0.001 -0.051** -0.019 (-1.13) (-2.34) (-1.04) FamilyS izei,t 0.001 -0.005 -0.008 (1.08) (-0.50) (-0.89) E xpenseRatioi,t 0.706 4.139 10.004 (1.08) (0.37) (1.26) FundAgei,t -0.000 -0.007*** -0.005*** (-1.22) (-2.65) (-2.88) FundReturni,t 0.002** 0.023* 0.014 (2.05) (1.66) (1.26)
Quarter FE yes yes yes yes yes yes
Strategy FE yes yes yes yes yes yes
R2 0.06 0.06 0.10 0.11 0.05 0.06
N 46,806 46,806 46,806 46,806 46,806 46,806
This table presents ordinary least-squares estimates of Equation (1.2) in column (1) and (2) and probit estimates in columns (3) to (6) relating window dressing to social responsibility. Rank Gapis a measure of window dressing developed by Agarwal et al.(2014). Rank Gap 10%(20%)is an indicator variable defined as 1 ifRank Gapis in the top 10th (20th) percentile for a given quarter, and zero otherwise .ESG fundsis an indicator variable that equals one if the fund have high ESG ratings. For other variable descriptions, see appendix A. Standard errors are clustered at the fund level.t-statistics are reported in parentheses. Statistical significant at the 10%, 5%, and 1% level is denoted by *, **, and ***, respectively.
1.4.1
Fund Flow
Theoretical and empirical studies indicate that investors of socially responsible funds
should be less sensitive to past negative results, not only because they are willing to pay
a premium to indirectly hold socially responsible investments but also due to their
long-term investment perspective (Bollen, 2007, Gollier and Pouget, 2014, Heinkel et al.,
2001, Renneboog et al., 2011). To empirically test whether the behavior of investors
is what drives managers’ willingness to engage in opportunistic behavior, I examine
investors’ flow sensitivity to the presence of loser and winner stocks in the funds’
fund flows with the following specification:
Flowi,t+1 =αi+γt +β1%Losersi,t+β2%Winnersi,t
+X
βiZi,t+i,t
(1.3)
whereFlowis the quarterly capital flows for a fund, measured as the percentage change
in a fund’s assets after adjusting for fund returns;αidenotes fund strategy fixed effects;
andγi time fixed effects. %Losersi,t (%Winnersi,t) is the percentage of assets of a fund
invested in stocks that had an inferior (superior) performance in quarter t. I follow
Lakonishok et al.(1991)’s andAgarwal et al.(2017)’s approach to build the %Losersi,t
(%Winnersi,t) variables. Losing (winning) stocks are those that fall in the bottom (top)
quintile of return performance within the group of firms with a similar size and
book-to-market ratios during the reporting periodt. I first separate stocks into quintiles based on
size. Then, within each size quintile, I create book-to-market quintiles, resulting in 25
conditional portfolio sorts. Losing (winning) stocks are the ones in the bottom (top) 20%
based on return performance in each of the 25 groups. In addition, I use quintiles of the
%Losersi,t (%Winnersi,t) variables. High%Loseri,ts(High%Winnersi,t) is an indicator
variable that takes the value of one if the fund is in the highest quintile. To test the
fund flows sensitivity to fund performance, I utilizeReturnBottomi,t (ReturnT opi,t) that
equals one if the fund is on the bottom (top) quintile of returns. Similar to my main
results of portfolio window dressing, vectorZi,tdenotes the set of control variables which
plausibly affect fund performance and, in turn, capital flows of fund investors.
Figure1.3plots the average capital flows of ESG funds and conventional funds.
Ta-ble1.3presents the coefficient estimates of Equation (1.3). Columns (1) and (4) report the estimates using the continuous variables %Losersi,t (%Winnersi,t); columns (2) and
Figure 1.3 Quarterly Fund Flows 2005 2008 2010 2013 2015 −20 0 20 40 Quarterly fund flo ws ($ Million) ESG funds Conventional funds
This figure presents the average fund flows, defined as the percentage change in the assets under management of a fund after adjusting for fund returns during the quarter.
(5) use the indicator variablesHigh%Losersi,t (High%Winnersi,t); and columns (3) and
(6) report the indicator variablesReturnBottomi,t (ReturnT opi,t). First, by considering a
sample comprised of conventional funds only, we can conclude that the coefficients on %Losersi,t and High%Losersare negative and statistically significant (p-value<0.01),
suggesting that investors of conventional funds respond negatively to the presence of
losing stocks in the fund portfolio. However, when restricting the sample to ESG funds
only, I find that the coefficients of %Losersi,tandHigh%Losersare not significant,
fail-ing to provide evidence that investors of ESG Funds are as sensitive to the presence of
losing stocks as their conventional peers. A similar pattern is observed regarding the
co-efficient estimates of %Winnersi,t andHigh%Winners. Investors of conventional funds
respond positively to the presence of winning stocks, whereas ESG funds’ investors
show no sensitivity. The aforementioned results corroborate previous studies that argue
Table 1.3 Fund Flow Sensitivity to Winners and Losers ES G f undi ConventionalFundi (1) (2) (3) (4) (5) (6) %Losersi,t -0.046 -0.533*** (-0.19) (-5.93) %Winnersi,t 0.468* 0.295*** (1.85) (4.40) High%Losersi,t -4.930 -10.688*** (-0.57) (-4.96) High%Winnersi,t 6.887 7.252*** (0.65) (3.24) ReturnBottomi,t -5.921 -8.905** (-0.43) (-1.97) ReturnT opi,t 13.995 0.422 (0.96) (0.12) Loadi,t -20.916* -19.946* -20.408* -10.726*** -10.700*** -10.704*** (-1.93) (-1.84) (-1.94) (-2.84) (-2.83) (-2.82) FundS izei,t -0.007 -0.007 -0.007 -0.004** -0.004** -0.004** (-0.88) (-0.87) (-0.89) (-2.25) (-2.23) (-2.21) FamilyS izei,t -2.563 -2.297 -2.514 0.117 0.108 0.035 (-1.13) (-1.03) (-1.19) (0.20) (0.19) (0.06) Fund age -1,118.002 -974.476 -922.836 375.917 366.378 361.998 (-0.70) (-0.62) (-0.61) (0.95) (0.93) (0.92) E xpenseRatioi,t -0.692 -0.602 -0.580 -0.567*** -0.575*** -0.585*** (-1.16) (-1.03) (-1.00) (-3.63) (-3.68) (-3.76) FundAgei,t -0.965 -0.264 0.023 -5.540*** -5.403** -5.278** (-0.16) (-0.05) (0.00) (-2.65) (-2.57) (-2.49) FundReturni,t 2.216 2.046 2.183 -1.121* -1.287** -1.419** (1.52) (1.42) (1.52) (-1.87) (-2.13) (-2.35)
Quarter FE yes yes yes yes yes yes
Strategy FE yes yes yes yes yes yes
R2 0.14 0.14 0.14 0.05 0.05 0.05
N 1,849 1,849 1,849 26,943 26,943 26,943
This table reports the results of regressions using quarterly percentage net fund flows during the lead quarter as the dependent variable. FundFlowsi,tis the percentage change in the assets under management of a fund after adjusting for fund returns
during the quarter.%Losers(%Winners) is the percentage of assets of a mutual fund invested at the end of quartertin losing (winning) stocks as defined in section (5.1). For other variable descriptions, see appendix A. Standard errors are clustered at the fund level.t-statistics are reported in parentheses. Statistical significant at the 10%, 5%, and 1% level is denoted by *, **, and ***, respectively.
sensitive to investment holdings labeled as “winners” or “losers” purely based on past
financial performance.
1.4.2
Investment Horizon
As previously discussed, although studies show that investors of ESG funds have longer
cap-ital market intermediaries’ actions fully reflect the preferences of their client-investors
is overly simplistic (He and Krishnamurthy, 2013). Therefore, I turn to investigating
whether ESG fund managers’ investment horizons differ from those of conventional managers. I use two measures of manager’s investment horizon, Fund Turnover and
Holding Duration. A fund turnover rate is the percentage of the fund’s holdings that
have been replaced in a given period, and holding duration is the average length of time
securities are normally held in the portfolio. The turnover rate inherently captures the
inverse of holding duration – i.e., the shorter the investment horizon, the higher the
turnover. I obtain the quarterly turnover measure from the CRSP Mutual Fund database,
which accounts for the minimum of the total purchases and sales by a fund in a quarter
divided by the beginning-of-the-quarter assets under management. For holding
dura-tion, I useCremers and Pareek(2016) measure, which is the average of the duration of
ownership of each stock held by fundi in quarter t. The duration for each stock j is
computed as follows: Durationi,j,t−1= t−1 X τ=t−W (t−τ−1)αi,j,τ Hj,t−1+Bi,j,t−1 + (W −1)Hi,j,t−1 Hi,j,t−1+Bi,j,t−1 , (1.4)
where Bi,j,t−1 is the total percentage of shares of stock jbought by fund ibetweenτ =
t−W andt−1. Hi,j,t−1 is the percentage of total shares outstanding of stock jheld by
fundiat timet−1. αi,j,t is the percentage of total shares outstanding of stock jbought
or sold by fundi betweent−1 and t, whereαi,j,t > 0 for buys andαi,j,t < 0 for sells.
FollowingCremers and Pareek(2016), I setW =20 quarters.
To estimate the relationship between funds’ ESG engagement and their managers’
investment horizon, I use the following equation:
log(Horizon)i,t =αi+γt+β1ES G f undi+
X
where the variableHorizoni,t denotes either the fund turnover measure provided by the
CRSP Mutual Fund database or duration, as defined in equation (1.4). The coefficient of interest is β1 – i.e., the estimate of the association between a fund pursuing ESG
strategies and the longevity of its stock holding period. The vectorZi,t denotes the same
set of fund-level covariates that are known to affect investment horizon.
Table1.4reports the estimates of equation (1.5). The estimated coefficient for ESG funds, β1, is statistically significant for both Turnover (negative) and Duration
(posi-tive), demonstrating that managers of ESG funds do indeed use long-term performance
metrics for their investment decisions.
Table 1.4 Fund Manager Investment Horizon
ln(T urnover)i,t ln(Duration)i,t (1) (2) (3) (4) (5) (6) ES G f undi -0.433*** -0.361*** -0.365*** 0.239*** 0.184*** 0.193*** (-5.23) (-4.69) (-4.88) (3.28) (2.69) (3.06) Loadi,t -0.074 -0.070 0.047 -0.007 (-0.87) (-0.84) (0.69) (-0.10) FundFlowsi,t -0.000 -0.000 -0.000 -0.000 (-0.34) (-0.57) (-0.96) (-1.11) FundS izei,t -0.096*** -0.099*** 0.076*** 0.078*** (-3.14) (-3.51) (3.37) (3.68) FamilyS izei,t 0.060*** 0.049*** -0.035** -0.033** (3.03) (2.59) (-2.27) (-2.34) E xpenseRatioi,t 20.785** 13.166 -16.953** -12.388* (1.99) (1.48) (-2.21) (-1.69) FundAgei,t 0.001 0.003 0.003* 0.003 (0.38) (1.25) (1.80) (1.60) FundReturni,t -0.017 -0.031** 0.041*** 0.039** (-1.22) (-2.22) (2.76) (2.53)
Time FE yes yes yes yes yes yes
Strategy FE no no yes no no yes
R2 0.09 0.14 0.18 0.16 0.24 0.29
N 46,583 46,583 46,583 7,986 7,986 7,986
This table presents ordinary least-squares estimates of Equation (1.3) relating investment horizon to social responsibility.Ln(Turnover)is the natural log of the turnover ratio as provided by the CRSP Mutual Fund Database, defined as the minimum of the total purchases and sales by a fund in a quarter divided by the beginning-of-the-quarter assets.Ln(Duration)is a measure of investor duration developed byCremers and Pareek(2016).ESG fundsis an indicator variable that equals one if the fund have high ESG ratings. For other variable descriptions, see appendix A. Standard errors are clustered at the fund level.t-statistics are reported in parentheses. Statistical significant at the 10%, 5%, and 1% level is denoted by *, **, and ***, respectively.
1.4.3
Managers’ Characteristics
Taken together, my results highlighting differences in window dressing and fund flows of ESG funds (vis-`a-vis conventional funds) are empirically consistent with the
hypoth-esis that managers of ESG funds translate the preferences of their ESG investors to
their portfolio and disclosure decisions. However, such results still leave questions to
be answered, such as the specific mechanisms through which investors’ preferences
are implemented. For example, one possible (governance) mechanism is that
invest-ment manageinvest-ment companies, in knowing the objectives of their investors’ clientele,
simply screen fund managers based on different dimensions of their education and cul-tural background, placing more (or less) emphasis on some characteristics contingent
on whether the job applicant would manage an ESG or conventional fund.
To investigate this possible channel, I examine several fund managers
characteris-tics by using information provided by IPREO’s BD Advanced, a proprietary database
that contains data of over 40,000 fund managers, analysts, and senior corporate
man-agers. I collect information about managers’ education, investment approach, tenure,
professional busyness, and gender. I then use fuzzy matching using managers’ names to
find correspondences between the sample extracted from CRSP and the sample obtained
from IPREO’s BD Advanced. The final sample is comprised of 479 unique mutual fund
managers, of which 19 manage at least one ESG fund. To correct for the naturally
unbal-anced properties of the samples of ESG fund managers and conventional fund managers,
in all the empirical tests I use entropy matching, with fund family size and fund age as
balancing parameters. I run manager-level regressions defined as follows:
ES Gmanagerm,t =αm+β1Femalem+β2Gradm,t +β3ActiveInvestorm
+β4T enurem,t +β5GrowthInvestorm+β6Busynessm+m,t+
X
βiZi,t,
whereES Gmanagerm,t is an indicator variable that equals one if the professional
man-ages the portfolio of at least one ESG mutual fund and zero otherwise. Femalem is an
indicator variable that equals one if the mutual fund manager is female.Gradm,tis an
in-dicator variable that equals one if the fund managers have a graduate degree (e.g., MBA
or Ph.D.). ActiveInvestorm takes the value of one if most of the funds that the
man-agermmanages currently or in the past are actively managed. T enurem,t is the number
of months scaled by 12 since the manager has been at the helm of the mutual fund.
GrowthInvestorm is an indicator variable that equals one if the fund manager’s
dom-inant investment style is “growth” or “aggressive growth.” Busynessm takes the value
of one if the fund manager holds one or more concurrent job positions inside the
in-vestment management company (e.g., analyst, trader, broker liaison). The vectorZm,t
denotes a set of fund characteristics variables average at fund manager level, such as the
average size of the funds, family size, the average expense ratio, the average age of the
funds, and the average return of the funds managed by managerm.
Table 1.5 presents the results of relating the ESG nature of the fund and the fund
manager specific characteristics. I run probit models to capture the probability of
man-agers being assigned to manage ESG funds conditional on their specific
characteris-tics, clustering standard errors at the manager level to allow for correlation between
repeated observations from the same individual. The estimated coefficient for active in-vestor, ActiveInvestorm, is positive and statistically significant, showing that managers
of ESG funds are more likely to manage active funds. Since ESG fund managers have
more experience managing active funds than passive funds, we would expect that ESG
fund managers would trade more frequently in order to yield alpha to their investors,
which runs contrary to the results of this study. The coefficient for professional busy-ness,Busynessm, is also positive and significant, indicating that ESG fund managers are
Table 1.5 Fund Managers Characteristics
Dependent variable:ES Gmanagerm
(1) (2) (3) (4) (5) (6) (7) (8) Femalem -0.669 -0.476 -0.325 (-1.11) (-0.72) (-0.50) Gradm -0.356 -0.464 -0.526* (-1.08) (-1.50) (-1.76) ActiveInvestorm 1.210*** 1.257*** 1.301*** (2.92) (3.02) (3.13) T enurem,t 0.016 -0.013 -0.008 (0.63) (-0.58) (-0.35) GrowthInvestorm -0.284 -0.307 -0.309 (-0.93) (-1.00) (-1.09) Busynessm 0.582* 0.587* 0.683** (1.85) (1.85) (2.55) FundReturni,t 0.038 0.046 0.050 0.043 0.040 0.043 0.050* (1.15) (1.44) (1.52) (1.27) (1.15) (1.39) (1.73) E xpenseRatioi,t -14.072 -17.350 -33.883 -20.036 -19.214 -9.466 -23.783 (-0.43) (-0.51) (-1.00) (-0.62) (-0.57) (-0.29) (-0.77) FundAgei,t -0.002 0.001 -0.002 -0.002 -0.004 0.000 0.001 (-0.12) (0.04) (-0.14) (-0.16) (-0.32) (0.02) (0.09)
FundS izei,t -0.016 -0.002 -0.016 -0.022 -0.011 0.015 0.012
(-0.14) (-0.02) (-0.15) (-0.22) (-0.10) (0.15) (0.12)
FamilyS izei,t 0.002 -0.011 -0.032 0.006 0.013 0.031 0.021
(0.04) (-0.19) (-0.49) (0.12) (0.23) (0.56) (0.39)
Quarter FE yes yes yes yes yes yes yes yes
Pseudo-R2 0.05 0.05 0.07 0.04 0.05 0.07 0.12 0.14
N 6,973 6,973 6,973 6,914 6,973 6,973 6,974 6,914
This table presents probit estimates of Equation (1.6) relating managing an ESG fund to fund manager characteristics.
ES Gmanagerm,tis an indicator variable that equals one if the professional manages the portfolio of at least one ESG mutual
fund and zero otherwise. For other variable descriptions, see appendix A. Standard errors are clustered at the manager level.
t-statistics are reported in parentheses. Statistical significant at the 10%, 5%, and 1% level is denoted by *, **, and ***, respec-tively.
I fail to find evidence of any other statistically significant difference between fund man-agers characteristics that could affect their assignment to ESG funds, such as investment style and tenure.
1.5
Conclusion
This paper provides empirical evidence consistent with the hypothesis that the
long-term orientation of ESG fund investors changes the reporting incentives of ESG fund
managers, leading to less reporting short-termism, reflected by less window dressing.
By using the ESG ratings of mutual funds provided by a third party entity, I show
that ESG fund managers engage in less portfolio window dressing than conventional
of ESG fund investors for long-term investment objectives are translated to the actions
of ESG fund managers. Specifically, I demonstrate that ESG fund managers have a
longer investment horizon (less turnover and longer holding duration) than conventional
managers, and investor flows of ESG funds are less sensitive to the presence of winners
and losers stocks in the funds’ portfolios vis-`a-vis conventional fund flows. Attempting
to shed light on a potential governance-related mechanism that ESG fund managers are
screening to manage these vehicles for different characteristics than their counterparts, I fail to find evidence that individual managers’ characteristics are systematically different for the two groups.
Overall, this paper contributes to the fast-growing literature on ESG investments by
demonstrating that, in addition to potential differences in financial returns, such invest-ment vehicles differ from their conventional counterparts in their opportunistic reporting decisions, an effect previously undocumented.
APPENDIX A
VARIABLE DESCRIPTIONS
Name Description
A. Fund-level measures
ES G f undi Funds that have rating High on the last four issued Morningstar Sustainability Rating.
RankGapi,t Spread between the rank of the fund’s actual performance and the composite ranks of winner/loser holdings, computed as follows: RankGap=Per f ormanceRank
−WinnerRank+LoserRank
2 200
T urnoveri,t Minimum of the total purchases and sales by a fund in a quarter divided by the beginning-of-the-quarter assets, as provided by
the CRSP Mutual Fund Database.
Durationi,t Fund duration is computed by averaging the duration of stockiin fundjin quartert, using the market value of the stock holdings
in each fund?s portfolio as weights. The duration for each stockiin fundjis computed as:
Durationi,j,t−1= t−1 X τ=t−W (t−τ−1)αi,j,τ Hj,t−1+Bi,j,t−1 + (W−1)Hi,j,t−1 Hi,j,t−1+Bi,j,t−1 ,
whereBi,j,t−1is the total percentage of shares of stockjbought by fundibetweenτ=t−Wandt−1.Hi,j,t−1is the percentage of
total shares outstanding of stockjheld by fundiat timet−1.αi,j,tis the percentage of total shares outstanding of stockjbought
or sold by fundibetweent−1 andt, whereαi,j,t>0 for buys andαi,j,t<0 for sells. FollowingCremers and Pareek(2016), I set W=20 quarters.
%Losersi,t(%Winnersi,t) Percentage of assets of a mutual fund invested in losing (winning) stocks, that is, stocks that fall in the bottom (top) quintile
of return performance within the group of firms with similar size and book-to-market ratios during the reporting period t. We first divide stocks into quintiles based on size, and then further each size quintile into five groups based on book-to-market ratio. We then identify losing (winning) stocks as the bottom (top) 20% based on return performance in each size and book-to-market group.
ReturnBottomi,t(ReturnT opi,t) Indicator variable that equals one if fundiis on the bottom (top) quintile of returns in quartert. FundS izei,t Total net assets (TNA) under management in millions of dollars.
Loadi,t Indicator variable defined as 1 if fund has any front-end or back-end load, and 0 otherwise.
E xpenseRatioi,t Fund’s annual expense ratio reported at fund?s fiscal year end, as provided by the CRSP Mutual Fund Database. FundFlowsi,t Percentage change in the assets under management of a fund after adjusting for fund returns during the quarter. FundAgei,t Number of months divided by 12 since the establishment of the fund.
FamilyS izei,t Sum of total net assets under management of the funds in the fund family that the fund belongs to. FundReturni,t Fund return adjusted using the four-factor model in Carhart (1997).
B. Fund manager characteristics
ES Gmanagerm Indicator variable that equals one if the professional manages the portfolio of at least one ESG mutual fund and zero otherwise. Femalem Indicator variable that equals one if the given name of the mutual fund managermis a female name. Fund managers with unisex
given names were manually checked to determine the gender.
Gradm Indicator variable that equals one if the mutual fund manager holds any kind of graduate degree, such as MBA, MPS, JD, or
Ph.D.
ActiveInvestorm Indicator variable that equals one if most of the funds that the managermmanages currently or in the past are actively managed,
as provided by IPREO’s BD Advanced Database.
T enurem,t Number of months scaled by 12 since the manager has been at the helm of the mutual fund.
GrowthInvestorm Indicator variable that equals one if the fund manager dominant investment style is “growth” or “aggressive growth”, as provided
by IPREO’s BD Advanced Database.
Busynessm Indicator variable that equals one if the fund manager holds one or more concurrent job positions inside the investment
BIBLIOGRAPHY
Vikas Agarwal, Gerald D Gay, and Leng Ling. Window dressing in mutual funds. The Review
of Financial Studies, 27(11):3133–3170, 2014.
Vikas Agarwal, Rahul Vashishtha, and Mohan Venkatachalam. Mutual fund transparency and corporate myopia. The Review of Financial Studies, 31(5):1966–2003, 2017.
Sanjeev Bhojraj, Paul Hribar, Marc Picconi, and John McInnis. Making sense of cents: An examination of firms that marginally miss or beat analyst forecasts. The Journal of Finance, 64(5):2361–2388, 2009.
Sanjeev Bhojraj, Young Jun Cho, and Nir Yehuda. Mutual fund family size and mutual fund performance: The role of regulatory changes. Journal of Accounting Research, 50(3):647– 684, 2012.
Nicolas PB Bollen. Mutual fund attributes and investor behavior. Journal of Financial and
Quantitative Analysis, 42(3):683–708, 2007.
Keith C Brown, W Van Harlow, and Laura T Starks. Of tournaments and temptations: An analysis of managerial incentives in the mutual fund industry. The Journal of Finance, 51(1): 85–110, 1996.
Brian J Bushee. The influence of institutional investors on myopic r&d investment behavior.The
Accounting Review, pages 305–333, 1998.
Bidisha Chakrabarty, Pamela C Moulton, and Charles Trzcinka. The performance of short-term institutional trades. Journal of Financial and Quantitative Analysis, 52(4):1403–1428, 2017. Claudia Champagne, Aymen Karoui, and Saurin Patel. Portfolio turnover activity and mutual
fund performance. Managerial Finance, 44(3):326–356, 2018.
Joseph Chen, Harrison Hong, Ming Huang, and Jeffrey D Kubik. Does fund size erode mutual fund performance? the role of liquidity and organization. American Economic Review, 94(5): 1276–1302, 2004.
Judith Chevalier and Glenn Ellison. Risk taking by mutual funds as a response to incentives.
Journal of Political Economy, 105(6):1167–1200, 1997.
Judith Chevalier and Glenn Ellison. Career concerns of mutual fund managers. The Quarterly
Journal of Economics, 114(2):389–432, 1999a.
Judith Chevalier and Glenn Ellison. Are some mutual fund managers better than others? cross-sectional patterns in behavior and performance. The Journal of Finance, 54(3):875–899, 1999b.
Martijn Cremers and Ankur Pareek. Patient capital outperformance: The investment skill of high active share managers who trade infrequently. Journal of Financial Economics, 122(2): 288–306, 2016.
Dan S Dhaliwal, Oliver Zhen Li, Albert Tsang, and Yong George Yang. Voluntary nonfinan-cial disclosure and the cost of equity capital: The initiation of corporate sononfinan-cial responsibility reporting. The Accounting Review, 86(1):59–100, 2011.
Elroy Dimson, O˘guzhan Karakas¸, and Xi Li. Active ownership.The Review of Financial Studies, 28(12):3225–3268, 2015.
Alexander Dyck, Karl V Lins, Lukas Roth, and Hannes F Wagner. Do institutional investors drive corporate social responsibility? international evidence.Journal of Financial Economics, 2018.
Sadok El Ghoul and Aymen Karoui. Does corporate social responsibility affect mutual fund performance and flows? Journal of Banking&Finance, 77:53–63, 2017.
Edwin J Elton, Martin J Gruber, and Christopher R Blake. A first look at the accuracy of the crsp mutual fund database and a comparison of the crsp and morningstar mutual fund databases.
The Journal of Finance, 56(6):2415–2430, 2001.
Frank J Fabozzi, KC Ma, and Becky J Oliphant. Sin stock returns. Journal of Portfolio
Man-agement, 35(1):82, 2008.
Eugene F Fama. Agency problems and the theory of the firm. Journal of Political Economy, 88 (2):288–307, 1980.
Feng Gao, Ling Lei Lisic, and Ivy Xiying Zhang. Commitment to social good and insider trading. Journal of Accounting and Economics, 57(2-3):149–175, 2014.
Christian Gollier and S´ebastien Pouget. The “washing machine”: Investment strategies and corporate behavior with socially responsible investors. Working Paper, 2014.
Jens Hainmueller. Entropy balancing for causal effects: A multivariate reweighting method to produce balanced samples in observational studies. Political Analysis, 20(1):25–46, 2012. Zhiguo He and Arvind Krishnamurthy. Intermediary asset pricing. American Economic Review,
103(2):732–70, 2013.
Robert Heinkel, Alan Kraus, and Josef Zechner. The effect of green investment on corporate behavior. Journal of Financial and Quantitative Analysis, 36(4):431–449, 2001.
Bengt Holmstr¨om. Managerial incentive problems: A dynamic perspective. The Review of
Economic Studies, 66(1):169–182, 1999.
Harrison Hong and Marcin Kacperczyk. The price of sin: The effects of social norms on markets.
Journal of Financial Economics, 93(1):15–36, 2009.
Mozaffar Khan, George Serafeim, and Aaron Yoon. Corporate sustainability: First evidence on materiality. The Accounting Review, 91(6):1697–1724, 2016.
Ajay Khorana. Top management turnover an empirical investigation of mutual fund managers.
Journal of Financial Economics, 40(3):403–427, 1996.
Yongtae Kim, Myung Seok Park, and Benson Wier. Is earnings quality associated with corporate social responsibility? The Accounting Review, 87(3):761–796, 2012.
Josef Lakonishok, Andrei Shleifer, Richard Thaler, and Robert Vishny. Window dressing by pension fund managers. The American Economic Review, 81(2):227–231, 1991.
Edward P Lazear and Sherwin Rosen. Rank-order tournaments as optimum labor contracts.
Journal of Political Economy, 89(5):841–864, 1981.
Franco Modigliani and Gerald A Pogue. Alternative investment performance fee arrangements and implications for sec regulatory policy. The Bell Journal of Economics, pages 127–160, 1975.
Mitchell A Petersen. Estimating standard errors in finance panel data sets: Comparing ap-proaches. The Review of Financial Studies, 22(1):435–480, 2009.
Luc Renneboog, Jenke Ter Horst, and Chendi Zhang. Is ethical money financially smart? non-financial attributes and money flows of socially responsible investment funds. Journal of
Financial Intermediation, 20(4):562–588, 2011.
Arno Riedl and Paul Smeets. Why do investors hold socially responsible mutual funds? The
Journal of Finance, 2017.
Sugata Roychowdhury. Earnings management through real activities manipulation. Journal of
Accounting and Economics, 42(3):335–370, 2006.
Andrei Shleifer and Robert W Vishny. Equilibrium short horizons of investors and firms. The
American Economic Review, 80(2):148–153, 1990.
Andrei Shleifer and Robert W Vishny. The limits of arbitrage. The Journal of Finance, 52(1): 35–55, 1997.
Laura T Starks, Parth Venkat, and Qifei Zhu. Corporate esg profiles and investor horizons.