ORIGINAL ARTICLE
Suite of decision tree-based classification algorithms
on cancer gene expression data
Mohmad Badr Al Snousy
a, Hesham Mohamed El-Deeb
b,*
, Khaled Badran
c,
Ibrahim Ali Al Khlil
ca
Department of Computer Science, Sadat Academy for Management Science (SAMS), Egypt
bDepartment of Computer Science, Modern University for Technology and Information (M.T.I.), Egypt c
Department of Computer Science, Military Technical College (M.T.C.), Egypt Received 28 December 2010; accepted 5 April 2011
Available online 23 July 2011
KEYWORDS
DNA microarray; Cancer;
Classification; Decision trees; Ensample decision tree; Attribute selection
Abstract One of the major challenges in microarray analysis, especially in cancer gene expression
profiles, is to determine genes or groups of genes that are highly expressed in cancer cells but not in normal cells. Supervised machine learning techniques are used with microarray datasets to build classification models that improve the diagnostic of different diseases. In this study, we compare the classification accuracy among nine decision tree methods; which are divided into two main cat-egories; the first is single decision tree C4.5, CART, Decision Stump, Random Tree and REPTree. The second category is ensample decision tree such Bagging (C4.5 and REPTree), AdaBoost (C4.5 and REPTree), ADTree, and Random Forests. In addition to the previous comparative analyses, we evaluate the behaviors of these methods with/without applying attribute selection (A.S.) tech-niques such as Chi-square attribute selection and Gain Ratio attribute selection. Usually, the ensembles learning methods: bagging, boosting, and Random Forest; enhanced classification accu-racy of single decision tree due to the natures of its mechanism which generate several classifiers from one dataset and vote for their classification decision. The values of enhancement fluctuate
* Corresponding author.
E-mail addresses:[email protected](M.B.A. Snousy),
[email protected] (H.M. El-Deeb), khaledBadran@hotmail.
com(K. Badran),[email protected](I.A.A. Khlil). 1110-8665 Ó 2011 Faculty of Computers and Information, Cairo University. Production and hosting by Elsevier B.V. All rights reserved.
Peer review under responsibility of Faculty of Computers and Information, Cairo University.
doi:10.1016/j.eij.2011.04.003
Production and hosting by Elsevier
Cairo University
Egyptian Informatics Journal
www.elsevier.com/locate/eij
between (4.99–6.19%). In majority of datasets and classification methods, Gain ratio attribute selection slightly enhanced the classification accuracy (1.05%) due to the concentration on the most promising genes having the effective information gain that discriminate the dataset. Also, Chi-square attributes evaluation for ensemble classifiers slightly decreased the classification accu-racy due to the elimination of some informative genes.
Ó2011 Faculty of Computers and Information, Cairo University. Production and hosting by Elsevier B.V. All rights reserved.
1. Introduction
The genome ribonucleic acid (RNA) expression studies allow systematic approaches to understand the relationship between gene expression profiles and disease states or different develop-mental stages of a cell. Microarray analysis provides quantita-tive information about the whole transcription profile of cells that make possible drug and therapeutics improvement, dis-ease diagnosis, and comprehensible basic cell biology.
A DNA microarray technique allows to simultaneously observing the expression levels of thousands of genes during significant biological processes and across collections of re-lated samples[1].
The datasets from microarray analysis, that enables the measurement of molecular signatures of diverse cells, becomes an important application of data mining, artificial intelligence and machine learning techniques to provide bioinformatics knowledge. In practical, supervised machine learning tech-niques used with microarray datasets to build classification models that improve the diagnostic of different diseases which easy to interpreted[2,3].
1.1. Biological background
Cells are the fundamental working units of every living system. All the instructions needed to direct their actions are contained within the chemical deoxyribonucleic acid or shortly DNA. A DNA molecule is a double-stranded polymer composed of four basic molecular units namely nucleotides. The nitrogen bases include adenine (A), guanine (G), cytosine (C) and thy-mine (T). The genome provides a template for the synthesis of a variety of RNA molecules. The process of transcribing a gene’s DNA sequence into RNA is called gene expression. A gene’s expression level indicates the approximate number of copies that gene’s RNA produced in a cell and it is correlated with the amount of the corresponding proteins made. This mechanism controls which genes are expressed in a cell and acts as a ‘‘volume control’’ that increases or decreases the level of expression of particular genes as necessary[4].
1.2. Microarray data format
A gene expression data set from a microarray experiment can be represented by a real-valued.
Expression matrix¼ fGði;jÞj16i6n;16j6mg
where the columns G¼ fg~1; ~g2;. . .; ~gmg form the expression patterns of genes, the rowsS¼ fS~1; ~S2;. . .Sn~g.
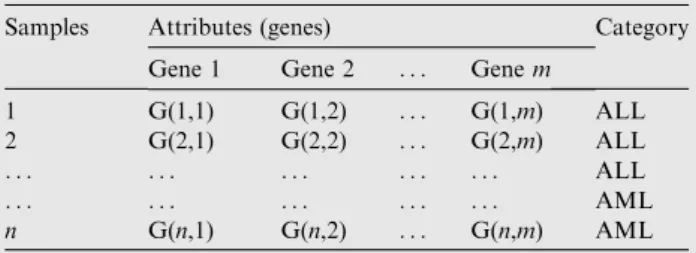
An example of a gene expression microarray dataset for Leukemia is shown inTable 1. the table organizes data into mcolumns (genes) andnrows (samples) wheremmostly varies from thousand to hundred thousand according to the accuracy
of microarray image processing technique, while n is always less than 200 samples according to the previously collected datasets[5]. Category column presents the actual class of the sample. For the shown example AML stands for acute myeloid leukemia disease and ALL represents acute lymphoblastic.
Our study provides a performance comparison of nine deci-sion tree methods. The rest of this paper is organized as the fol-lows. In Section 2, we present brief challenges that faced in cancer classification area. In Section 3, we provide problem definitions. In Section 4, we exploit decision tree and micro-array classification. In Section 5, we discuss related works in this domain. In Section 6, we explore the methodologies used in this work. In Section 7, we describe experimental setup. In Section 8, we present results and analysis. In Section 9, we con-clude the paper.
2. Cancer classification challenges
Gene classification as domain of research poses a new challenges due to its unique problem nature. First, challenge comes from the unique nature of the available gene expression dataset; where most of these datasets has sample size below 200, vs. thousands to hundred thousands of genes presented in each tuples. Second, only a few numbers of these (genes) presents relevant attributes to the investigated disease. Third, comes from the presence of noise (biological and technical) inherent in the dataset. Fourth challenge arises from the application area, for instance accuracy is an important criterion in cancer classification task, but it is not the only goal, in cancer domain we want to achieve, biological relevancy as well as classification accuracy.
3. Problem definition
There is no single classifier superior over the rest, for instance the classification accuracy is depend on the classification meth-od, gene selection methmeth-od, and dataset[7,8].
In this study we will use the notation provided by Ying Lu et al.[9].
Let X1;X2;. . .;Xm be random variables for genes G1; G2;. . .;Gmrespectively, whereXihas domaindom(Xi) which is the range of expression values forgene Gi.
Table 1 Microarray data decision table.
Samples Attributes (genes) Category Gene 1 Gene 2 . . . Genem
1 G(1,1) G(1,2) . . . G(1,m) ALL 2 G(2,1) G(2,2) . . . G(2,m) ALL
. . . ALL
. . . AML
Let C be the random variable for the class labels, and domðCÞ ¼ f1;. . .;Kg, where K is denotes a total number of classes.
Let t¼ ft:X1;t:X2;. . .;t:Xmg denotes a size m tuple of expression values formgenes. LetT ={(t1, c1), (t2, c2)... (tn, cn)} Denoting a training set of n tuples, where i¼ f1;2;. . .;ng, ci2dom(C) is the class label of tupleti.
Let the test set beS¼ ft1;t2;. . .;tlgwherelis the size of the test set.
Find a classification function Class, which gave maximal classification accuracy onS, where the classification accuracy calculated by divide number of correct classified instances on total number of instances.
Accuracy¼ TPþTN
TPþFNþFPþTN ð1Þ
True positive (TP) = the number of predicted positive cases that are actually positive.
True negative (TN) = the number of predicted negative cases that are actually negative.
False positive (FP) = the number of predicted positive cases that are actually negative.
False negative (FN) = the number of predicted negative cases that are actually positive.Table 2illustrates the con-fusion matrix for positive and negative tuples.
4. Decision tree and microarray classification
One of the main advantages of decision trees is the ability to generate understandable knowledge structures, i.e., hierarchi-cal trees or sets of rules, a low computational cost when the model is being applied to predict or classify new cases, the abil-ity to handle symbolic and numeric input variables, provision of a clear indication of which attributes are most important for prediction or classification[10].
There are two disadvantages that also represented a major weakness in using decision tree for microarray analysis prob-lems in the past. The first one is their instability that is tightly connected with the second disadvantage – i.e., difficulties to branching the trees when the number of samples is too low. Instability of decision trees was successfully solved by ensem-bles methods where multiple trees built from different subsets of the initial dataset were built to improve the robustness of the final classifier. Unfortunately, ensembles of classifiers pos-ses very low level of their knowledge understand-ability and are not appropriate for interpretation of the acquired knowl-edge. There were some studies that approached the problem of knowledge extraction from ensembles of classifiers [11], but all of them are too limited to be helpful for practical use. Quality of branching in decision tree is of fundamental importance to the final success of classifier.
Due to high cost per experiment in microarray studies it is nowadays still acceptable for studies with 100 or yet less
sam-ples to represent benchmarking datasets for evaluation of the most complex classifiers[12]. Most of the microarray data to-day is collected in centralized repositories containing large numbers of samples like Gene Expression Omnibus (GEO) by National Center for Biotechnology Information (NCBI) or ArrayExpress by European Bioinformatics Institute (EBI) [13]. Unfortunately such repositories are too large and contain data coming from various sources using different protocols to serve as a benchmarking collection of datasets. Our study takes advantage of one of the largest publicly available repos-itories of gene expression measurements that were collected by EBI. Which is currently one of the most appropriate collec-tions of gene expression samples for evaluation of classification methods[11].
5. Related works
There is a numerous algorithms produced to construct classifi-cation models from the old nearest neighbor analysis and deci-sion tree to the new SVM support vector machines[6]. For instance, Xiaosheng Wang et al.[5]compare the performance of NB (Naive Bayes), DT (Decision Tree), SVM Support Vec-tor Machine) and k-NN (k-nearest neighbor) algorithm with several attribute selection (chi-square, information gain, Re-lief-F and symmetric uncertainty) the average accuracy in their study was between 69.33% and 90.01%. Peter et al.[14]uses Partial Least-Squares (PLS) regression as a feature selection method, and compare performance of several ensemble models the predictive accuracy in their study was between 61.2 and 99.4. Hong Hu et al.[7]provide new ensample method and compare it with several famous ensample method, the accuracy was between 60% for Prostate dataset and 98.9% for Lung Cancer dataset. Aik Choon et al. [15]comparisons, between single decision tree algorithm and ensemble based decision tree (Bagging, AdaBoost) Algorithm. The accuracy was between 52.38% and 93.29%.Table 3shows the relevant works on can-cer classification.
6. Methodologies
6.1. Classification methods
In this experimental study we focus on nine public decision tree methods, some of these methods build single decision tree such as C4.5, CART, REPTree, RandomTree, and Decision-Stump. The other are ensample decision tree such as ADTree, Random Forests, Bagging, and AdaBoost. These methods are described briefly as the following:
C4.5 algorithm top-down decision tree base proposed by Quinlan[16]. The algorithm is a successor of ID3, which deter-mines at each step the most predictive attribute, and splits a node based on this attribute. Every node represents a decision point over the value of some attribute.
The split criterion calculated as the following:
– Calculate the expected information needed to classify a tuple inD
InfoðDÞ ¼X m
i¼1
pilog2ðpiÞ ð2Þ
where,piis the probability that an tuple inDbelong to classCi.
Table 2 Confusion matrix.
Predicted class
Actual class C1 C2
C1 TP FN
– Calculate the expected information required to classify a tuple fromDbased partitioning byA.
InfoAðDÞ ¼ Xm i¼1 jDjj jDjInfoðDjÞ ð3Þ The termjDjj
jDj acts as the weight of thejth partition. – Calculate information gain of attributeA.
GainðAÞ ¼InfoðDÞ InfoAðDÞ ð4Þ – Calculate split information of attributeA
SplitInfoAðDÞ ¼ Xm j¼1 jDjj jDjlog2 jDjj jDj ð5Þ
– Calculate gain ratio: GainRationðAÞ ¼ GainðAÞ
SplitInfoAðDÞ ð6Þ
The attribute with the maximum gain ratio is selected as best splitting attribute.
CART (Classification and Regression Tree), it is analysis which is based on the paper by Breiman et al.[17]. Is binary decision trees, which split a single variable at each node. CART approach can also produce classification trees, which depends on the type of the dependent variable (categorical or numerical) CART Similar to C4.5 but use Gini index as split criteria that calculated as the following
GiniðDÞ ¼1X m
i¼1 p2
i ð7Þ
The Gini index of attributeAfor a binary spilt is calculated as the following: GiniAðDÞ ¼ jD2j jDjGiniðD1Þ þ jD2j jDjGiniðD2Þ ð8Þ RandomTree: is constructing a tree that randomly selected attributes at each node. It performs no pruning.
Table 3 Relevant works on cancer classification. where AdaBoos (Ad), Bagging (Ba).
Authors Dataset Att. Sel. Classifier accuracy [%]
Xiaosheng Wang et al.[5] Colon NB C4.5 SVM k-nn Chi 88.71 90.32 87.1 87.1 Inf. 85.48 85.48 87.1 87.1 RF 87.1 85.48 87.1 87.1 SU 87.1 91.94 87.1 88.71
Highest accuracy Average accuracy
Colon 91.94 83.1074 Cns 90 72.3362 DLBCL 87.93 70.7054 Leukemia1 97.22 92.013 Lung 100 97.9547 Prostate 96.08 90.9766 Breast 88.46 69.3911 Leukemia2 98.25 87.593
Peter J. Tan et al.[14] Dataset single C4.5 RF Ad C5.0 MML Oblique Forest Leukemia PLS dimensionality 94.3 96.2 95.7 96.7 Breast 65.2 71.2 67.9 69.2 Central nervous 61.2 64.5 63.2 65.9 Colon 80.9 84.7 82.7 88.8 Lung 98 96.2 98.2 99.4 Prostate 83 90.6 88.1 91.3 Prostate 65 69.3 51.5 53.2 Hong Hu. et al.[7] Dataset C4.5 RF Ad C4.5 Ba C4.5
Breast 62.9 61.9 61.9 66 Lung 95 98.3 96.1 97.2 Lymphoma 78.7 80.9 85.1 85.1 Leukemia 79.2 86.1 87.5 86.1 Colon 82.3 75.8 77.4 82.3 Ovarian 95.7 94.1 95.7 97.6 Prostate 33.3 52.4 33.3 42.9 Aik Choon Tan et al.[15] Dataset C4.5 Ba C4.5 Ad C4.5
Leukemia 91.18 91.18 91.18 Breast 63.16 89.47 89.47 tumors outcome 85 88.33 88.33 Colon 95.16 93.55 90.32 Lung 92.62 93.29 92.62 Prostate 67.65 73.53 67.65 Prostate outcome 52.38 85.71 76.19
DecisionStump: is an algorithm builds simple binary deci-sion ‘stumps’ (1 level decideci-sion tress) for both nominal and nu-meric classification task. It deal with mission values by extending a third branch from the stump or treating ‘missing’ as a separate attribute value. It does regression (based on mean-squared error) or classification (based on entropy)[18]. REPTree: algorithm is a fast decision tree learner it is also based on C4.5 algorithm and can produce classification (dis-crete outcome) or regression trees (continuous outcome). It builds a regression/decision tree using information gain/vari-ance and prunes it using reduced-error pruning (with back-fitting).
ADTree: Applied Alternating decision trees, it is a general-ization of decision trees, voted decision trees and voted deci-sion stumps. The algorithm boosting procedures to decideci-sion tree algorithms to produce accurate classifiers. The classifiers are in the form of a majority vote over a number of decision trees but having a smaller and easier to understand classifica-tion rules[19].
Random forests: ensemble decision tree methods by resam-pling attributes, produced by Leo Breiman[19]. This early ran-dom decision trees method combines bagging and ranran-dom feature selection methods to generate multiple classifiers. Ran-dom Forests based on CART method.
Bagging: produced by Leo Breiman[20,21]it uses a boot-strap technique to resample the training data setsD. To form a resampled data setDi. Each sample inDhas a probability of 1/n of being drawn in any trial. The most often predicted class label will be the final classification result.
AdaBoost: The Boosting method was first developed by Freund[22]. The initial classifier is constructed from the origi-nal data set where every sample has an equal distribution ratio of 1. In the Boosting method training data setDi, the distribu-tion ratios are made different among samples depending on their prediction accuracy in the previous data set Di1. If a sample has a lower prediction accuracy rate in Di1, it will be given a higher weight inDiand therefore get a higher pos-sibility to be selected inDi.Fig. 1illustrates an overview of the ensemble classifier.
6.2. Data preprocessing
Among thousands of genes whose expression levels are mea-sured, not all are wanted for classification. We need to select a few numbers of genes highly related with classes for classifi-cation, which is called informative genes.
Chi-square (v2) attributes evaluate. The chi-square (v2) method evaluates features individually by measuring their chi-squared statistic with respect to the classes. Thev2value v2ðaÞ ¼X m¼V Xn i¼1 ½Aiða¼mÞ Eða¼mÞ2 Eiða¼mÞ ð9Þ
whereVis the set of possible values fora,nthe number of clas-ses, Ai(a = V) the number of samples in the ith class with a=v, andEi(a=v) the expected value ofAi(a = v);
Ei(a=v) =P(a=v)P(ci)N, whereP(a=v) is the proba-bility ofa=v,P(ci) the probability of one sample labeled with theith class, and N the total number of samples[23].
Figure 1 Overview of the ensemble classifier.
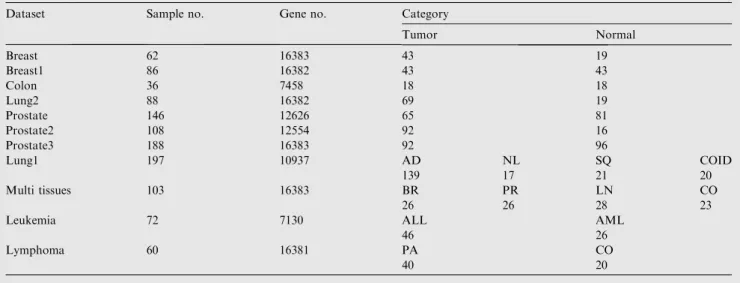
Table 4 Description of microarray dataset where AML: acute myeloid leukemia, ALL: acute lymphoblastic leukemia, AD:
adenocarcinomas, SQ: squamous cell carcinomas, COID carcinoids, and NL: normal lung. BR: Breast, PR: prostate, LN: lung, CO: colon, PA: patient, CO: control.
Dataset Sample no. Gene no. Category
Tumor Normal Breast 62 16383 43 19 Breast1 86 16382 43 43 Colon 36 7458 18 18 Lung2 88 16382 69 19 Prostate 146 12626 65 81 Prostate2 108 12554 92 16 Prostate3 188 16383 92 96 Lung1 197 10937 AD NL SQ COID 139 17 21 20 Multi tissues 103 16383 BR PR LN CO 26 26 28 23
Leukemia 72 7130 ALL AML
46 26
Lymphoma 60 16381 PA CO
Gain ratio features evaluation. Expected information (en-tropy) is used to sort the attribute inD, according to higher informative gene and eliminate the attribute with low gain ra-tio see Eqs.(7)and(8).
6.3. Datasets
In this study, we select eleven microarray datasets these dataset were breast cancer, breast1 cancer, lung2 cancer, prostate can-cer (normal prostate tissue adjacent to tumor vs. tumor tissue), prostate2 cancer, Prostate3 cancer, and lymphoma, these data-set were collected from EBI,
http://www.ebi.ac.uk/array-express and multi tissues [24], lung1 cancer[24], colon tumor[25], Leukemia[24], were col-lected from GEO repository. The latest four dataset had been extensively tested in many previous studies[25–27]. Table 4 provides briefly description of microarray dataset.
7. Experimental setup
Eleven dataset was collected from EBI and GEO, used to eval-uate classification performance. These datasets were described briefly inTable 3.
All experiments described in this paper were performed using libraries from Weka 3.7.1 machine learning environment [28]. A lot of studies used Weka in classification task, for examples[26,29]. Nine selected decision tree classifiers are used to build the classification models, these classifier was briefly de-scribed above (Section 6.1), as well as two type of attribute selection (Chi-square, Gain Ratio) were used to reduce the ini-tial set of available genes, and evaluate the performance of these methods, on elected subset of attribute.
Each classification method was used ‘‘as it is’’ in Weka environment which means that no additional parameter tuning
was performed before or during classification performance comparison. Each feature selection method was used in combi-nation with all nine classification models included in compar-ison. As well as we evaluate AUC of the classification method using, each test we used 10-fold cross-validation. For bagging and AdaBoost method we used (C4.5) and REPTree as a classifiers and applying 10 iterations each experiment.
We summarize our machine learning work for DNA micro-array in three main stages. First stage is attribute selection, sec-ond is choosing appropriate predictor, and third is produced model evaluation as shown inFig. 2.
8. Results and analysis
We report the results from nine methods that used to study the usefulness of the decision tree to predict disease status. For each method we evaluated classification accuracy on the origi-nal dataset (without attribute selection) and also by using Chi-square and Gain ratio as attribute selection.
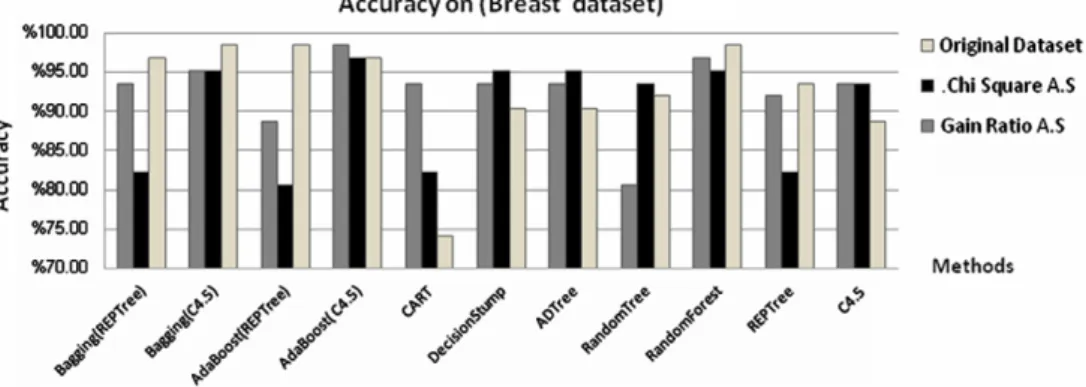
First, we applied the methods on breast cancerFig. 3shows the accuracy of the methods. We notes that Random Forest, AdaBoost (C4.5), and AdaBoost (REPTree) gave higher accu-racy on original dataset (98.39%), AdaBoost (C4.5) perform higher accuracy with Chi-square attribute selection (96.77) and Gain ratio attribute selection (98.39%).
Second, we applied the methods on colon cancer Fig. 4 shows accuracy of the methods. We notice that AdaBoost (C4.5) perform higher accuracy on original dataset (100%), and RandomForest, CART, AdaBoost(C4.5), Ada-Boost(REPTree) and Bagging(REPTree) gave the same and higher accuracy with Gain ratio attribute selection (97.22%), while DecisionStump gave higher accuracy with Chi-square attribute selection (97.22%).
Third, we applied the methods on leukemia dataset;Fig. 5 shows the accuracy of the method. We notice that Bag-ging(REPTree) perform higher accuracy on original dataset (93.06%), AdaBoost(REPTree) perform higher accuracy with Chi-square Attribute selection (95.83%) and gain ratio attri-butes selection (97.22%).
Fourth, we applied the method on lung1 dataset Fig. 6 shows the accuracy of the methods, we notice that Ada-Boost(REPTree) gave higher accuracy on the original dataset (95.43%) and with Chi-square Attribute selection (94.42%), while Bagging(C4.5) gave higher accuracy with Gain ratio attribute selection (93.91%).
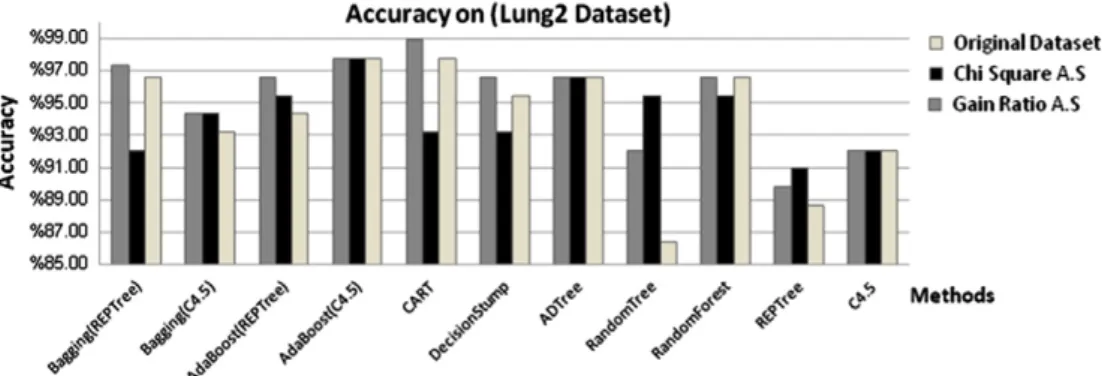
Fifth, we applied the methods on lung2 datasetFig. 7shows the accuracy of the methods, we notice that CART, Ada-Boost(C4.5) gave higher accuracy on the original dataset (97.73%), while CART gave higher accuracy with Gain ratio attribute selection (98.86%), and AdaBoost(C4.5) gave higher accuracy with Chi-square Attribute selection (97.73%).
Sixth, we applied the methods on lymphoma datasetFig. 8 shows the accuracy of the method, we notice that Random Forest, Bagging(REPTree) and AdaBoost(C4.5) gave high per-formance on original dataset(100%), while ADTree, Decision-Stump, CART AdaBoost(C4.5), Bagging(REPTree), and REPTree gave accuracy with Gain ratio attribute selection (100%) while Random Forest AdaBoost(C4.5) gave higher accuracy with Chi-square attribute selection (100%).
Seventh, we applied the methods on prostate dataset Fig. 9 shows the accuracy of the methods, we notice that
Figure 4 Accuracy of the methods on colon dataset.
Figure 3 Accuracy of the methods on breast dataset.
Figure 5 Accuracy of the methods on leukemia dataset.
Bagging(REPTree) gave higher accuracy on the original data-set (75.34%), with Chi-square Attribute selection (72.60%) and Gain ratio attribute selection (75.92%).
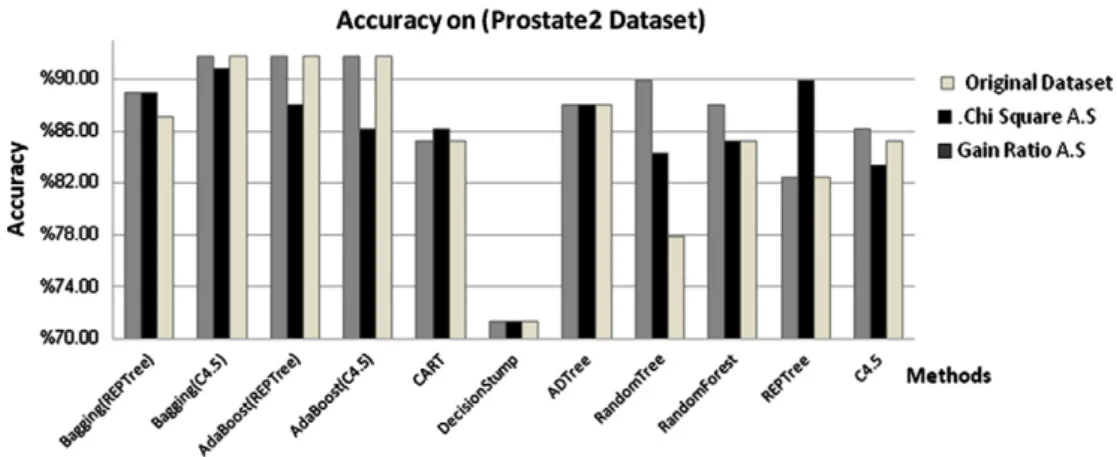
Eigth, we applied the methods on prostate2 datasetFig. 10 shows the accuracy of the methods, we notice that Ada-Boost(C4.5), AdaBoost(REPTree) and Bagging(C4.5) gave higher accuracy on the original dataset (91.67%), Bag-ging(C4.5) gave higher accuracy with Chi-square Attribute selection (90.74%) and Gain ratio attribute selection (91.67%), also we applied the method on the rest datasets. Table 5 summarized the minimum and maximum accuracy of these methods.
By calculating the average accuracy for all methods on each dataset, from Fig. 11we notice AdaBoost (C4.5) gave higher average accuracy on original dataset (91.23%) and with using Chi-square Attribute selection (90.83%) and Bagging (REP-Tree) gave higher average accuracy Gain ratio attribute selec-tion (92.64%).
Also, we notice the ensamples decision tree is significantly improving the accuracy of single decision tree classifier such as (C4.5 and REPTree).
In this study we intended to use several dataset from the same cancer types to focus on the following facts: it is important to classify the samples produced from the same
Figure 7 Accuracy of the methods on lung2 dataset.
Figure 8 Accuracy of the methods on lymphoma dataset.
laboratory, as well as the same preprocessing algorithm, and same microarray type.
9. Conclusions
This experimental study compares classification performance of different nine decision tree algorithms via using of eleven cancerous microarray datasets. These algorithms include five single decision tree (C4.5, REPTree, CART, DecisionStump, and RandomTree) as well as four ensample decision tree meth-ods AdaBoost (C4.5), AdaBoost (REPTree), Bagging (REP-Tree), Bagging (C4.5), ADTree. In addition, the effect of attribute selection on building decision tree based models is investigated.
From the obtained results we can highlights some interest-ing conclusions: The ensample method (AdaBoost, Bagginterest-ing and Random Forest) significantly improve the classification accuracy of single decision tree, Due to building several classi-fier and voting techniques. Accuracy of AdaBoost (C4.5) out-performs other ensample methods on original dataset without using of attribute selection. AdaBoost (REPTree), AdaBoost (C4.5) outperform other method with Chi-square attribute evaluation, Bagging (REPTree) outperform other method with Gain Ratio attribute.
Gain ratio attribute selection significantly improves classi-fier accuracy on majority of the dataset and classification method, but chi-square attribute selection didn’t significantly improve the classification accuracy, as well as it decreases
Figure 10 Accuracy of the methods on prostate2 dataset.
Table 5 Summarized the accuracy of the methods on these Breast1, Multi tissues and Prostate3 dataset.
Gain ratio A. S. Chi-square A. S. Original data
Method % Method % Method % Breast1 Max. Acc. Ad(C4.5) 98.39 Ad(C4.5) 86.05 Ba(REPTree) 81.40
Min. Acc. RT 67.44 ADTree 75.58 RT 77.91 Multi tissues Max. Acc. Ad(C4.5) 97.09 Ad(REPTree) 95.15 CART 94.17 Min. Acc. DS 44.66 DS 47.57 DS 46.60 Prostate3 Max. Acc. RF 98.94 RF 100 Ad(C4.5) 99.47 Min. Acc. ADTree 86.70 DS 86.7 DS 86.70
classifier accuracy such as C4.5, due to the elimination of some informative genes. By analyzing the results obtained with mul-ticlass microarray datasets (lung1. Multi-tissues dataset) we noticed that CART and AdaBoost (C4.5) outperform other methods on the original dataset. While AdaBoost (REPTree) outperforms with Chi-square attribute selection. Usually, Bag-ging (C4.5) and AdaBoost (C4.5) outperform with Gain ratio attribute selection.
Lastly, decision trees are particularly attractive for biolo-gists due to their interpretability, being able to highlight which genes are actually influencing the classification task as well as results show that decision tree classifiers might play an impor-tant role in microarray analysis in the future.
But small numbers of genes shared to constrict tree from microarray dataset is still critical criteria because missing such genes mean missing classification result.
References
[1] Arma R, Marcos IL, Taboada V, Ucar E, Irantzu B, Fullaondo A, Pedro L, Zubiaga A. Microarray analysis of autoimmune diseases by machine learning procedures. IEEE Trans Inform Biomed 2009;13(3):341–50.
[2] Myles A, Feudale R, Liu Y, Woody N, Brown S. An introduction to decision tree modeling. J Chemometr 2004;18:275–85. [3] Cho S, Won H. Machine learning in dna microarray analysis for
cancer classification. First Asia Pacific bioinformatics conference on Bioinformatics 2003:189–98.
[4] Mramor M, Leban G, Demsˇar J, Zupan B. Visualization-based cancer microarray data classification analysis. J Bioinform Adv Access 2007:1–7.
[5] Wang X, Gotoh O. A robust gene selection method for micro-array-based cancer classification. Cancer Inform 2010:15–30. [6] Sweilam NH, Tharwat AA, Abdel Moniem NK. Support vector
machine for diagnosis cancer diseases: a comparative study. Egyptian Inform J 2010;11(2):81–91.
[7] Hu H, Li J, Wang H, Daggard G, Shi M. A maximally diversified multiple decision tree algorithm for microarray data classification. In: Conferences in research and practice in information technol-ogy (CRPIT), vol. 73, 2006.
[8] Peterson L, Coleman M. Machine learning-based receiver oper-ating characteristic (ROC) curves for crisp and fuzzy classification of DNA microarrays in cancer research. Int J Approx Reason 2008;47:17–36.
[9] Saeys Y, Inza I, Larra P. A review of feature selection techniques in bioinformatics. Bioinformatics 2007;23(19):2507–17.
[10] He Y, Cheung Hui S. Exploring ant-based algorithms for gene expression data analysis. Art Intell Med 2009;47:235–41. [11] Stiglic G, Mertik M, Podgorelec V, Kokol P. Using visual
interpretation of small ensembles in microarray analysis. In: Conference of computer based medical systems CBMS, vol. 34, 2006. p. 691–5.
[12] Dupuy A, Simon R. Critical review of published microarray studies for cancer outcome and guidelines on statistical analysis and reporting. J Cancer Inst 2007;99:147–57.
[13] Barrett T, Troup D, Wilhite S, Ledoux P, Rudnev D, Evangelista C, et al. Mining tens of millions of expression profiles-database and tools update. In: Nucleic Acids Res, Conference of National Cancer of Biomedical Institute NCBI, vol. 5, 2007. p. 760–5.
[14] Peter J. Tan, David L. Dowe, Trevor I. Dix, Building classifica-tion models from microarray data with tree-based classificaclassifica-tion algorithms. In: 20th Australian joint conference on Advances in artificial intelligence, 2007.
[15] Choon TA, David G. Ensemble machine learning on gene expression data for cancer classification. Open Mind J Lim 2003:75–83.
[16] Quinlan JR. C4.5: programs for machine learning. Morgan Kaufmann; 1993.
[17] Andrej K. Item response theory modeling for microarray gene expression data. Met Zvezki 2009;6(1):51–67.
[18] Witten IH, Frank E. Data mining: practical machine learning tools and techniques. 2nd edition. San Francisco: Morgan Kaufmann; 2005.
[19] Breiman L. Random forests – random features, Technical Report 567, University of California, Berkley, 1999.
[20] Breiman L. Bagging predictors. Machine Learning 1996;24(2):23–140.
[21] Bauer E, Kohavi R. An empirical comparison of voting classifi-cation algorithms: Bagging, boosting, and variants. Machine Learning 1999;36(2):105–39.
[22] Freund Y, Schapire RE. Experiments with a new boosting algorithm. In International conference on machine learning, 1996. pp. 148–56.
[23] Elham C, Mohammd T, Seraj K, Zolghadri J. An improved fuzzy feature clustering and selection based on chi-squared-test. Int Multi Conf Eng Comput Scient 2009;8:978–88.
[24] Stefano M, Pablo T, Jill M, Todd G. A resampling-based method for class discovery and visualization of gene expression micro-array data. Printed in the Netherlands: Kluwer Academic Pub-lishers; 2003.
[25] Alon U, Barkai N, Notterman DA, Gish K, Ybarra S, Mack D, Levine AJ. Broad patterns of gene expression revealed by clustering analysis of tumor and normal colon tissues probed by oligonucleotide arrays. Proc Natl Acad Sci USA 1999;96(12):6575–6.
[26] Karegowda1 AG, Manjuna AS, Jayaram MA. Comparative study of attribute selection using gain ratio and correlation based Featuer selection. Int J Inform Technol Know Manage 2010;2(2):271–7.
[27] Golub TR, Slonim DK, Tamayo P, Huard C, Gaasenbeek M, Mesirov JP, Coller H, Loh ML, Downing JR, Caligiuri MA, Bloomfield CD, Lander ES. Molecular classification of cancer: class discovery and class prediction by gene expression monitor-ing. Science 1999;15:286–94.
[28] Bouckaert R, Frank E, Hall M, Kirkby R, Reutemann P, Seewald A, Scuse D. WEKA manual for version 3-7-1. Hamilton, New Zealand: University of Waikato; 2010.
[29] Leung Y, Hung Y. A multiple-filter-multiple-wrapper approach to gene selection and microarray data classification. IEEE/ACM Trans Comput Biol Bioinform 2010;7(1).