Deep Learning
by
Zander Christo Horn
Thesis presented in partial fulfilmentof the requirements for the Degree
of
MASTER OF ENGINEERING
(EXTRACTIVE METALLURGICAL ENGINEERING)
in the Faculty of Engineering
at Stellenbosch University
Supervisor
Dr Lidia Auret
Co-Supervisors
Prof Chris Aldrich
Prof Ben Herbst
Declaration of Originality
By submitting this thesis electronically, I declare that the entirety of the work contained therein is my own, original work, that I am the sole author thereof (save to the extent explicitly otherwise stated), that reproduction and publication thereof by Stellenbosch University will not infringe any third-party rights and that I have not previously in its entirety or in part submitted it for obtaining any qualification.
Date: March 2018
Copyright © 2018 Stellenbosch University All rights reserved
Abstract
Soft-sensors are of interest in mineral processing and can replace slower or more expensive sensors by using existing process sensors. Sensing process information from images has been demonstrated successfully, but performance is dependent on feature extractors used. Textural features which utilise spatial relationships within images are preferred due to greater resilience to changing imaging and process conditions.
Traditional texture feature extractors require iterative design and are sensitive to changes in imaging conditions. They may have many hyperparameters, leading to slow optimisation. Robust and accurate sensing is a key requirement for mineral processing, making current methods of limited potential under realistic industrial conditions.
A platinum froth flotation case study was used to compare traditional texture feature extractors with a proposed deep learning feature extractor: convolutional neural networks (CNNs). Deep learning applies artificial neural networks with many hidden layers and specialised architectures for powerful correlative performance through automated training. All information of the input data structure is determined inherently in training with only a limited number of hyperparameters. However, deep learning methods risk overfitting with small datasets, which must be mitigated.
A CNN classifier and a framework for unbiased comparison between feature extractors were developed for predicting high to low grade classes of platinum in flotation froth images. CNNs can perform all the functions of a soft-sensor, but this may bias performance comparison. Instead, features were extracted from hidden layers in CNNs and fed into a traditional soft-sensor. This ensured performance measurements were unbiased across all feature extractors. With a full factorial experiment, the following CNN hyperparameters were evaluated: batch size, number of convolutional filters, and convolutional filter size.
Accuracy of grade classification was used to score feature extractors. These reference texture feature extractors were compared to CNNs: Local Binary Patterns, Grey-Level Co-occurrence Matrices, and Wavelets. The impact of spectral features (bulk image features such as average colour) was also evaluated, as CNNs can also use spectral image properties to create features, unlike traditional texture extractors. Extractors were tested with input resolutions from 16x16 to 128x128 with two soft-sensor models: Linear Discriminant Analysis, and k-Nearest Neighbour classifiers. Optimal grade classification accuracies were: CNN – 96.5%, LBP – 100%, GLCM – 73.7%, Wavelets – 98.3%, and Spectral – 98.4%
Training CNNs to extract features was successful with robust results regardless of hyperparameters selected. The only statistically significant differences obtained during training were that smaller batch size and smaller input resolution gave superior training performance. Results were found to be reproducible for all models.
Analysing learned CNN features indicated both textural and spectral features were utilised. Overall results showed spectral features gave good classification performance, potentially adding to CNN performance. CNNs showed comparable performance to other texture feature extractors at all resolutions.
This proof of concept implementation shows promise for deep learning methods in mineral processing applications. The resilience of CNNs to changes in imaging and process conditions could not be evaluated due to limited data in the case study. Future work with deep learning methods, while promising, will require larger datasets which are more representative of a variety of process conditions.
Abstrak
Inferensiële waarneming is van belang in die mineraalverwerkingsveld. Dit kan stadiger of duurder aanlynsensors vervang met bestaande prosesveranderlike sensors. Waarneming van proses inligting uit beelde is suksesvol gedemonstreer, maar werkverrigting is afhanklik van die kenmerk-ekstraksie metode. Teksturele eienskappe wat ruimtelike verhoudinge binne beelde gebruik geniet voorkeur as gevolg van hul veerkragtigheid teenoor veranderings in beeldopname en prosesomstandighede.
Tradisionele tekstuurkenmerk-ekstraksiemetodes benodig iteratiewe ontwerp en is sensitief vir veranderinge in beeldopnameomstandighede. Tekstuurkenmerk-ekstraksiemetodes kan baie
hiperparameters hê wat stadige optimalisering veroorsaak. Robuuste, akkurate waarneming is 'n belangrike vereiste vir minerale verwerking. Huidige tegnieke van tekstuur-ekstraksie het beperkte potensiaal onder realistiese industriële toestande.
’n Platinumflottasieskuim gevallestudie is gebruik om tradisionele tekstuurkenmerk-ekstraksie te vergelyk met ’n voorgestelde diep-leer kenmerk-ekstraksiemetode: konvolusionele neurale netwerke (KNNs). Diep-leer pas kunsmatige neurale netwerke, met versteekte lae en gespesialiseerde argitektuur, toe. Dit maak voorsiening vir ‘n kragtige korrelatiewe prestasie en geoutomatiseerde opleiding. Alle inligting rakende die insetdata struktuur word inherent bepaal tydens opleiding met slegs ’n beperkte hoeveelheid
hiperparameters. Klein datastelle kan egter lei na oormatige passing in diep-leermetodes. Dié risiko moet versag word.
’n KNN-klassifiseerder en ‘n raamwerk vir onbevooroordeelde vergelyking tussen
kenmerk-ekstraksiemetodes is hier ontwikkel om lae tot hoë platinumgraadklasse van flotasieskuimbeelde te voorspel. KNNs kan dieselfde funksies as inferensiële sensors verrig, maar dit kan sydig wees in
prestasiemetings. Om dit te voorkom is kenmerke van versteekte lae in die KNNs onttrek en as insette in die tradisionele inferensiële sensor gebruik. Dit het verseker dat kenmerk-ekstraksie nie sydig was as gevolg van die korrelerende vermoëns van KNNs nie. Die volgende KNN-hiperparameters is evalueer deur ’n vol-faktor eksperiment: bondelgrootte, toenemende of konstante aantal konvolusiefilters, en
konvolusiefiltergrootte.
Tekstuurkenmerk-ekstraksiemetodes is gegradeer volgens die klassifikasie-akkuraatheid van
platinumgraad. Hierdie tradisionele tekstuurkenmerk-ekstraksiemetodes is vergelyk met KNNs: Lokale Binêre Patrone (LBP), Grysskaalmede-aanwesigheidsmatrikse (GSMMs), en Golfie-transformasies. Die impak van spektrale eienskappe (byvoorbeeld massa eienskappe soos gemiddelde kleur) is geëvalueer, aangesien KNNs spektrale beeldkenmerke ook kan toepas om eienskappe te skep, anders as tradisionele tekstuur-ekstraksiemetodes. Die kenmerk-ekstraksiemetodes is getoets in 'n reeks insetresolusies van 16x16 tot 128x128 met een van twee sagte-sensor modelle: Lineêre Diskriminant Analise (LDA) en k-Naaste
Buurman (k-NB) klassifiseerders. Die beste klassifikasie-akkuraatheid vir elke metode was as volg: KNN – 96.5%, LBP – 100%, GSMM – 73.7%, Golfie-transformasies – 98.3%, en Spektraal– 98.4%
Die opleiding van KNNs vir kenmerk-ekstraksie was suksesvol, met robuuste resultate ongeag die gekose hiperparameters. Die enigste statisties beduidende resultate wat behaal is, is dat kleiner bondelgrootte en kleiner insetresolusie 'n beter opleidingsprestasie het. Herhalingstoetsing het bevind dat
opleidingsresultate reproduseerbaar was.
Ontleding van geleerde KNN-kenmerke het aangedui dat beide teksturele en spektrale kenmerke gebruik is. Oor die algemeen het inferensiële toetse getoon dat spektrale kenmerke tot uitstekende klassifikasie-prestasie gelei het, wat moontlik die KNN se klassifikasie-prestasie verbeter. KNNs het vergelykbare klassifikasie-prestasie getoon met ander tekstuurfunksie-ekstrakte by alle beeldresolusies, en het klassifiekasie-uitslae geproduseer wat geskik is vir beheer- en moniteringdoeleindes.
Met hierdie bewys-van-konsep implementering, toon diep-leermetodes belofte vir gebruik in minerale verwerkingsprobleme. Die veerkragtigheid van KNNs teen verandering in beeld- en prosesomstandighede kon egter nie geëvalueer word nie, as gevolg van beperkte data in die gevallestudie. Verdere werk met diep-leermetodes, terwyl belowend, sal groter datastelle benodig wat meer verteenwoordigend is van ‘n verskeidenheid prosesomstandighede.
Acknowledgements
First and foremost, I would like to thank Lidia for providing me the opportunity to pursue further studies and produce this work. Her support and patience were invaluable and helped me through some tough times. I apologise to subjecting her to my sometimes-vexing understanding of deadlines.
To my wife, Judy-Ann, I thank her endless support during this work and for being my proof-reader extraordinaire. Without her my semantically reckless use of commas and semicolons would still be terrorising the readers.
To my family, for tolerating my desire to continue studying and not enter the job market. Their support and love always encourages me.
Lastly, I would like to thank all my friends and colleagues for listening to me ramble about neural networks and flotation froths and for keeping me sane with dinner, drinks, and board games.
Table of Contents
Declaration of Originality ... i
Abstract ... ii
Abstrak ... iv
Acknowledgements ... vi
Table of Contents ... vii
Nomenclature ... xii Glossary ... xiv Chapter 1: Introduction ... 1 1.1 Motivation ... 2 1.2 Challenges ... 3 1.3 Objectives ... 4 1.4 Scope ... 4
Chapter 2: Froth Flotation ... 5
2.1 Flotation Operation Theory ... 6
2.1.1 Froth System Inputs ... 7
2.1.1.1 Ore Type ... 7
2.1.1.2 Collector Reagent ... 7
2.1.1.3 Frothing Reagent ... 8
2.1.1.4 Modifier Reagents ... 8
2.1.1.5 Agitation Rate ... 8
2.1.1.6 Air and Bubble Properties ... 8
2.1.1.7 Pulp Particle Size Distribution ... 9
2.1.1.8 Pulp Level ... 9
2.1.1.9 Temperature ... 9
2.1.2 Fundamental Flotation Processes ... 9
2.1.2.1 Pulp Phase ... 9
2.1.2.2 Froth Phase ... 10
2.2 Industrial Application ... 11
2.3 Performance Monitoring ... 11
2.3.1 Industry Requirements and Resources ... 12
Chapter 3: Soft-Sensing and Computer Vision ... 13
3.1 Soft-Sensing ... 13
3.1.1 Soft-Sensing in Process Control ... 13
3.1.2 Soft-Sensor Models ... 14
3.1.3 Developing Soft-Sensors ... 15
3.2 Computer Vision ... 17
3.2.1 Computer Vision in Soft-Sensing ... 18
3.2.2 Computer Vision in Industry ... 19
Chapter 4: Image Feature Extraction ... 21
4.1 Approaches to Texture Feature Extraction ... 21
4.2 Methods of Texture Feature Extraction ... 22
4.2.1 GLCM Extractors ... 23
4.2.2 LBP Extractors ... 24
4.2.3 Wavelet Extractors ... 25
4.3 Texture Feature Extractors in Industry ... 25
Chapter 5: Artificial Neural Networks ... 27
5.1 Artificial Neurons and Multilayer Networks ... 27
5.1.1 Activation Functions ... 29
5.1.2 Training and Backpropagation ... 30
5.1.3 Advantages and Disadvantages ... 31
5.2 Deep Neural Networks ... 32
5.2.1 Deep Network Architectures ... 32
5.2.1.1 Training Deep Neural Networks ... 32
5.2.1.2 Training with Gradient Descent Methods ... 35
5.2.2 Comparing General ANNs and Specialised Architectures ... 38
5.2.3 Feature Extraction with Deep Networks ... 38
5.3 Convolutional Neural Networks ... 39
5.4 Artificial Neural Networks in Process Engineering ... 41
5.5 Continuing Advances ... 42
Chapter 6: Key Literature ... 44
6.1 Froth Flotation Sensing ... 44
6.2 Image-based Soft-Sensors with Convolutional Neural Networks ... 44
Chapter 7: Methodology ... 46
7.1 Dataset Information ... 46
7.2 Pre-Processing of Datasets ... 47
7.2.1 Sub-sampling and Variant Generation ... 49
7.2.1.1 Rotation Variants ... 51
7.2.1.2 Scale Variants ... 52
7.2.1.3 Colour Space Variants ... 52
7.2.1.4 Gaussian Noise Variants ... 53
7.2.2 Resolution Scale Set Generation and Saving ... 54
7.3 Convolutional Neural Network Definition and Training ... 54
7.3.1 Convolutional Layers ... 55
7.3.1.1 Convolution Parameters ... 56
7.3.1.2 Pooling Parameters ... 56
7.3.2 Fully Connected Layers ... 56
7.3.2.1 Feature Layer ... 57
7.3.2.2 Output Layer ... 57
7.3.3 Normalisation and Dropout ... 57
7.3.4 Batch Sizes ... 58
7.3.5 Training Search Space ... 59
7.3.6 Loss and Gradient Descent Methods... 59
7.3.7.1 Evaluating Network Training Results ... 61
7.3.7.2 Statistical Tests Used in Training Evaluation ... 62
7.3.8 Unsupervised Training ... 62
7.4 Neural Network Visualisation ... 63
7.4.1 Naïve Feature Visualisation ... 63
7.4.2 Intermediate Layer Output Visualisation ... 64
7.5 Feature Extraction ... 64 7.5.1 GLCM Parameters ... 64 7.5.2 LBP Parameters... 65 7.5.3 Wavelet Parameters ... 65 7.5.4 Spectral Parameters ... 65 7.6 Soft-Sensor Training ... 65
7.6.1 Linear Discriminant Analysis Modelling ... 66
7.6.2 k-Nearest Neighbour Modelling ... 67
7.7 Performance Comparison Between Feature Extractors ... 67
7.8 Hardware and Software Used ... 68
Chapter 8: Results and Discussion ... 69
8.1 Neural Network Training Results ... 69
8.1.1 Batch Normalised Networks Results ... 70
8.1.2 Selected Networks Repeat Results ... 75
8.1.3 Visualising Network Parameters ... 79
8.2 Feature Properties and Extraction Speed Results ... 84
8.3 Soft-sensor Results ... 85
8.3.1 Linear Discriminant Analysis Classification ... 85
8.3.2 k-Nearest Neighbour Classification ... 86
8.3.3 CNN Features ... 87
8.4 CNN Soft-Sensor System Development ... 88
Chapter 9: Conclusions and Recommendations ... 91
9.1 Training CNNs on Flotation Froths ... 91
9.2 CNNs as Textural Feature Extractors ... 92
9.3 Outlook and Further Work ... 92
Chapter 10: References ... 94 Appendix A: Example of Single Image Processing in CNN ... A A.1 Input Image to First Convolution ... A A.2 Convolutional Layer to Convolutional Layer ... F A.3 Final Convolution to Fully-Connected ... G A.4 Fully-Connected Layer to Fully-Connected Layer ... H A.5 Fully-Connected to Classification ... H A.6 Summary ... I
Nomenclature
ANN Artificial Neural Networks ANOVA Analysis of variance
𝑏𝑏0 Bias term of a neuron
𝛽𝛽1 1st moment estimate exponential decay rate
𝛽𝛽2 2nd moment estimate exponential decay rate
𝐶𝐶𝑖𝑖,𝑗𝑗,𝑐𝑐 Convolutional filter value applicable to 𝐼𝐼𝑖𝑖,𝑗𝑗,𝑐𝑐 CNN Convolutional Neural Networks
𝛿𝛿 Gradient stabilisation term
𝜕𝜕𝑖𝑖𝑗𝑗 Kronecker delta of predicted class 𝑗𝑗 and actual class 𝑖𝑖 DNN Deep Neural Networks
𝐹𝐹𝑐𝑐𝑐𝑐𝑐𝑐𝑐𝑐𝑐𝑐 Maximum convolutional filter size
𝐹𝐹𝑝𝑝 Max-pooling size
𝑓𝑓(𝑥𝑥) Some activation function for neuron GLCM Grey-level Co-occurrence Matrices GPGPUE General Purpose Graphics Processing Unit GPU Graphical Processing Unit
𝐻𝐻 Activation outputs of a layer of neurons
𝐻𝐻′ Normalised activation outputs of a layer of neurons
𝐻𝐻𝑖𝑖 i-th neuron in hidden layer
𝐻𝐻0 Null-hypothesis
𝐻𝐻1 Alternative hypothesis HSL Hue, Saturation, Lightness HSV Hue, Saturation, Value
𝐼𝐼𝑖𝑖 i-th neuron in input layer
𝐼𝐼𝑖𝑖 i-th input to neuron
𝐼𝐼𝑖𝑖,𝑗𝑗,𝑐𝑐 Pixel at location i,j and channel c of image window k-NN k-Nearest Neighbours
𝐿𝐿 Classification loss
LAB Luminosity, colour channels A and B LBP Local Binary Patterns
LDA Linear Discriminant Analysis
𝑚𝑚 Total number of activations in a layer MIA Multivariate Image Analysis
𝑁𝑁 Number of images in a batch
𝑛𝑛𝑐𝑐𝑐𝑐𝑐𝑐𝑐𝑐 Number of convolutional layers
𝑂𝑂0 Output of a neuron
𝑂𝑂𝑖𝑖 i-th neuron in output layer
OSA On-stream Analyser
PCA Principal Component Analysis PGM Platinum Group Metal PLS Partial Least Squares
RBM Restricted Boltzmann Machines ReLU Regularised Linear Units
RGB Red, Green, Blue
𝑟𝑟𝑖𝑖𝑐𝑐𝑝𝑝𝑖𝑖𝑖𝑖 Input image resolution SGD Stochastic Gradient Descent
𝜎𝜎2 Variance
SVM Support Vector Machines
UG2 Upper Group 2
𝑊𝑊𝑖𝑖 Weight for i-th input to a neuron
𝑤𝑤𝑖𝑖 Weighting term for classification loss calculation
𝑦𝑦 Actual class label
𝑦𝑦� Predicted class probability
𝑥𝑥 Summed weighted input of neuron
Glossary
Architecture (Neural Networks) The specific arrangement of neurons in and between layers Assay Determination of fraction of particular mineral or metal in ore Backpropagation Updating of neural network parameters through error derivative of
parameters in neural network
Classification Categorisation of data points into specific discrete representative classes
Classifier Mathematical model which places data within discrete categories Comminution Grinding of mineral ore into smaller particle sizes
Convolution (Neural Networks) Neural architecture where the input is divided into smaller overlapping input areas which all share the same parameters Convolve The process of convolution, a piecewise matrix multiplication with
convolutional parameters, centred around each input element Deep Learning The application of deep or many layered neural networks
Dimensionality Reduction Decreasing the number of values in a descriptive dataset while ideally maintaining descriptive representation
Feature Any variable or variables which describe or represent data being analysed
Feature Extraction The process of obtaining features from larger datasets through manipulation, selection, or other transforms
Forward Propagation Feeding data into a neural network and producing a final output. Used in conjunction with backpropagation to calculate training error. Hyperparameter User settable parameters which affect or determine a large number of
hidden parameters
Inferential-Sensor Algorithm which estimates system properties while not directly measuring those properties
Labelled Data Data which is associated with a known classification or regression output which can be trained against
Layer
A collection of neurons performing the same action at the same depth in the neural network. Usually no intra-layer connections between neurons
Loss Function Mathematical model which describes predictive error for a model across the entire dataset being tested
Machine Vision Application of computerised imaging for data extraction purposes Overfitting The process of encoding a limited training dataset into model
parameters and failing to discover underlying true correlations Parameter Any property within a model whose value is determined through
machine learning and not manual human setting
Pooling Reduction of dimension in images through grouping and merging of pixels in a certain area, and repeating across the entire image Regularisation Any method which introduces additional information to prevent
overfitting
Slurry A liquid like suspension of small particles in (most commonly) water to facilitate processing and transportation of solids
Soft-Sensors A detection device which uses computer processing to correlate input information to a desired output
Sparge To homogeneously distribute air through a liquid
Spectral Information related to the relative intensity of different frequencies in data such as colour in images
Stride The distance by which an operation on sub-data shifts within a dataset before operating on the next set of sub-data
Supervised Learning Updating the parameters of a model through a targeted goal as determined by information correlated to the input data
Testing (Data) Previously unseen inputs for evaluation of a trained machine learning model
Texture Spatial relationships and patterns in image data
Training (Data) Inputs used during updating of model parameters, not suitable for evaluating final performance due to risk of being encoded
Unsupervised Learning
Updating the parameters of a model through reconstruction of input data or other objective function not related to correlated information of the input
Validation (Data) A subset of training data used during parameter updating to provide a crude indication of training performing while training
Variant A set of data generated from original data with some transform applied to improve training effectiveness by increased representation
Chapter 1:Introduction
Process monitoring forms a fundamental basis of modern process plant operation and optimisation in almost all industries. Measuring process variables and determining key performance indicators is an integral part of this. Image-based soft-sensing is playing a growing part in process monitoring as computational power and imaging algorithms advance.
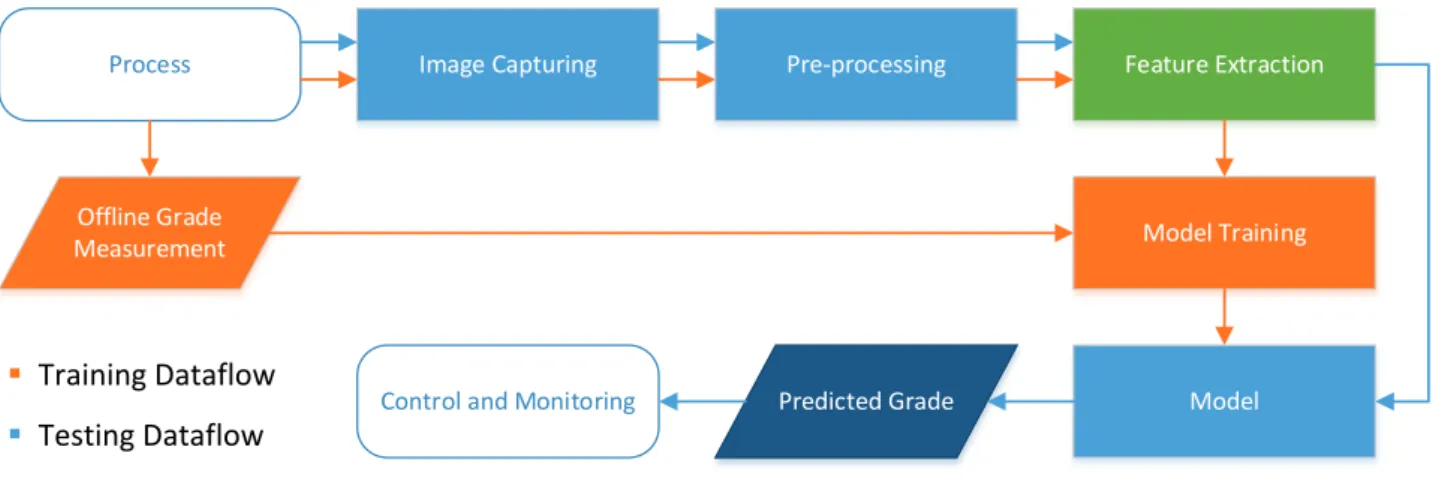
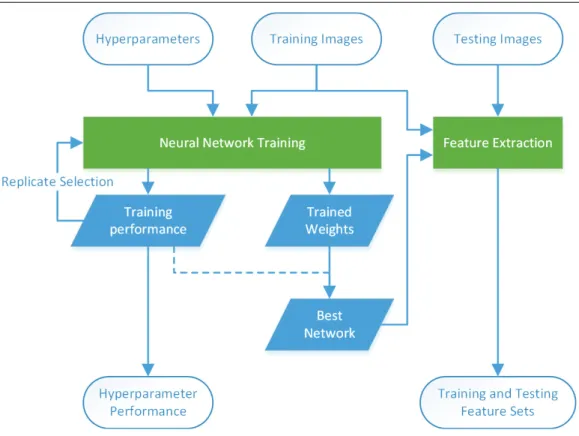
Soft-sensing through image analysis forms a core component of this study in which the application and performance of deep learning as a method of gathering inferential process data will be analysed. The intent is to extract useful textural feature information from images via deep learning and compare how effectively these may be coupled to process variables. The deep learning method selected will be benchmarked against traditional feature extraction methods in a soft-sensor framework such as that in Figure 1-1.
Of interest is implementing image-based soft-sensing for froth flotation systems, specifically in the platinum industry. Froth flotation is a complex process and many process variables influence froth appearance. In brief, froth flotation exploits hydrophobic and hydrophilic properties of minerals within an ore to induce separation. Within a flotation cell, air flows through a slurry, forming a froth at the surface to which (in most cases) the desired mineral has preferentially attached to. By examining flotation froths with suitable feature extraction methods, one or more process variables of interest may be correlated with the extracted features; this would allow for more effective process control and decision making at this step of platinum concentration. Key performance indicators for flotation such as grade and recovery are typically expensive or slow to measure with direct sensing methods.
Figure 1-1: Overview of a Soft-Sensor Training and Usage Framework
Traditional methods of extracting data from images have several drawbacks hindering widespread implementation. Parametric texture-based methods make specific assumptions of features present and have several hyperparameters (parameters which are fixed prior to training and affect hidden parameters) to tune. Spectral methods (simplistic bulk measurements of image properties, i.e. the average red, green, and blue
Process
Offline Grade Measurement
Predicted Grade
Image Capturing Pre-processing Feature Extraction
Model Training
Model
Control and Monitoring
Training Dataflow
types to determine which method and hyperparameter combination is suitable for the type of process images being analysed.
Deep learning in comparison has properties which make it an attractive alternative to current multivariate image analysis methods implemented by industry. Deep learning is an evolution of shallow neural networks by applying many neurons in many layers. The large number of layers in deep learning networks allows specific layer architectures to be implemented, mitigating many shortcomings of shallow neural networks. It does not require prior knowledge to extract structured information from images due to its training process. Deep learning methods inherently discover any hidden features in images without making any assumptions of feature types and are less sensitive to hyperparameter selection.
Deep learning methods can form soft-sensors completely within themselves, both extracting features and producing predictions. However, to provide a baseline for comparison between methods, deep learning methods will only be used as feature extractors in this study. Feature sets from each feature extraction method will be compared in a shared soft-sensor architecture with common classifiers (mathematical models which predict class) to correlate features to process data.
1.1 Motivation
Except for specific applications and sensor systems, accurate and robust image-based soft-sensors remain uncommon in the process industry. Current image sensors are dependent on feature extractors which require slow iterative design or prior knowledge during selection to achieve good performance as shown by the variety and complexity of methods available (Tian, 2013). These systems do not generalise well to large changes in process conditions and are susceptible to imaging variances. If image-based sensors are to be more prevalent in process industries, alternative methods of feature extraction that are both more robust and generalizable must be examined.
Deep learning is a promising candidate for machine vision systems in process industries. In other image classification tasks, it outperforms most other methods previously considered (Xie, 2008), and is more robust and accurate under varying imaging conditions and use scenarios.
A search for literature with the following keywords was performed: “deep learning process engineering”, “deep learning chemical engineering”, “deep learning soft-sensing”, and “convolutional neural networks chemical engineering”. It was discovered that recent research is limited, with most results from the early 90s. Some of the later research by (Bharati & MacGregor, 1998) still faced problems with data and computational limitations. The focus on newer research has remained in shallow neural networks as classification algorithms. Despite the proliferation of high performance Graphical Processing Units (GPUs) for machine learning and new process data sets, deep learning methods have not been further evaluated in recent work for process engineering application (Duchesne, et al., 2012).
Widespread application of froth flotation in industry makes it an attractive candidate for developing and testing a deep learning based soft-sensor (Fuerstenau, et al., 2007). Case studies are possible in a variety of different conditions and mineralogical systems; in addition, suitable data capturing systems are already in place at many froth flotation separators at South African mining operations. These systems measure parameters such as froth height and bubble velocity, but often discard the original images due to storage limitations. Additional sensors such as on-stream analysers (OSA) may also be available to draw information from.
If a soft-sensor is successfully developed for froth flotation, it may easily be adapted to similar image analysis and sensing tasks due to the flexible nature of deep neural networks. Deep networks can transfer what they have learned in their training to new systems (Oquab, et al., 2014), or can be further trained with new data to adapt to other processes.
1.2 Challenges
Sufficient data for training a deep learning soft-sensor is a primary concern in this work. Deep learning systems require large amounts of training data to enable accurate prediction under actual operation. Insufficient data coupled with naïve training will result in such a system not recognising new information accurately (Srivastava, et al., 2014). This phenomenon is known as overfitting and deep learning systems are especially susceptible to it, resulting in a model of little value for sensing applications.
Gathering sufficient data itself is problematic; deep learning methods require significantly more labelled data than required to train soft-sensors with traditional methods of feature extraction. While image data from froth flotation cells may be captured easily, it is more difficult to obtain process data which can be correlated with those images. It may be possible to use standard offline analyses (with appropriate assumptions and estimates) performed at the plant in question; alternatively, a sampling campaign must be performed in concert with imaging for later assay. Some compromise must be made between new samples, existing data, and training optimisation as the number of samples required for naïve deep learning would be financially prohibitive to analyse.
Deep learning itself also provides some challenges. Aside from overfitting mentioned above, deep learning also requires significant computing power to perform training, especially in the case of high dimensional applications such as image analysis. The problem may be mitigated somewhat with proper selection of deep neural network architecture and using efficient deep learning software libraries. However, this may limit the types of neural nets and training methods which can be utilised (Krizhevsky, et al., 2012).
Lastly, to be considered a viable online sensor, a deep learning soft-sensor must be both fast and accurate. This project will investigate the requirements of a soft-sensor in monitoring froth flotation and determine
which key performance indicators must be considered to evaluate performance of deep learning in contrast to other methods.
1.3 Objectives
Three primary objectives have been developed from the challenges facing this project: 1. Develop and evaluate a deep learning system for froth flotation sensing.
2. Compare deep learning feature extractors with traditional ones and evaluate the performance requirements for a soft-sensor in froth flotation
3. Contextualise results of deep learning system development with industry requirements and challenges for vision-based soft-sensing systems
1.4 Scope
This is a preliminary research project into the application of deep learning for soft-sensor systems. It would be premature and unrealistic to produce a complete and final product for industrial application. This study will focus on creating a proof of concept for soft-sensing in froth flotation. Any additional work beyond the initial scope of the project will only be considered once the primary objectives have been realised.
Chapter 2:Froth Flotation
Froth flotation is an effective and well-established process used for concentration in the mining industry, with applications to processes ranging from copper to platinum concentration. Its ability to rapidly separate complex or low-quality ores with small particle sizes makes it an attractive process compared to gravity or density separation methods. While sensors exist to measure parameters such as air flow and froth height in a flotation cell, systems which measure process conditions within flotation cells such as platinum grade or fault conditions are rare (Liu & MacGregor, 2008; Liu, et al., 2005). To meet the performance requirements of industrial applications, many parallel and series flotation cells circuits are used in a flotation plant with recycle streams to achieve separation and throughput targets.
As with all mineral concentrators, the operation of a froth flotation cell is characterised by a grade/recovery curve. Grade (the fraction of the output consisting of desired minerals) and recovery (the fraction of total input desired minerals in the output) are both important performance indicators of the process unit which would provide control benefits if measured online. Currently on-stream analysers (OSAs) are used to measure these parameters. However, they are expensive to purchase and require continuous calibration and maintenance. Additionally, certain OSAs utilise X-ray or other ionising radiation sources for sensing, presenting a risk to workers (Owen, 1988). One effect of this is that OSAs are generally purchased to measure the output of banks of flotation cells, sensing from each cell would be prohibitively expensive due to the large number present in each bank (Holtham & Nguyen, 2002). This increases dead-time significantly and eliminates the possibility of detecting changes and problems in individual flotations cells.
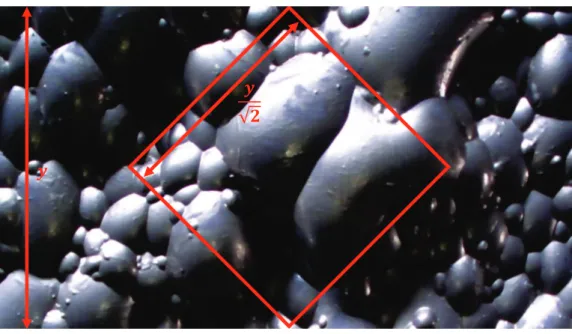
In the platinum mining industry, from which the case studies for this work are taken, froth flotation is the primary concentration method for ores. An example image of the flotation froth can be seen in Figure 2-1. The case study will be limited to grade prediction due to limitations in the available process data.
2.1 Flotation Operation Theory
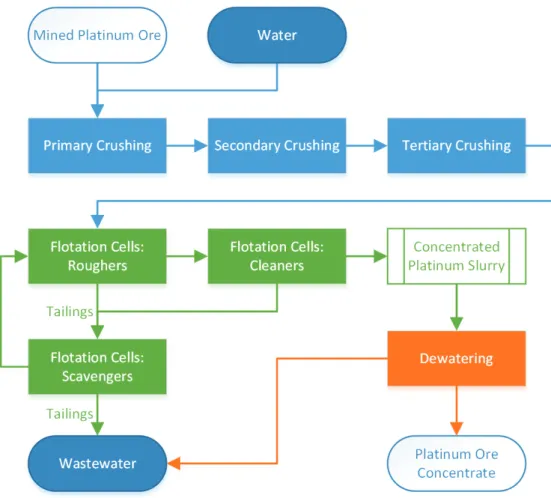
Flotation cells operate on mineral slurries resulting from prior stages of comminution (particle size reduction). As summarised in Figure 2-2, mineral ore is first crushed into progressively finer particles through primary, secondary, and tertiary comminution. The resultant slurry contains water with fine mineral particles suspended throughout it.
Flotation chemicals, described in further detail later, are added to the slurry to enhance properties beneficial for the flotation process. In the cell, the mixture is agitated, and air is sparged (uniformly pumped) through the cell to form a froth. As the bubbles rise to the surface of the cell, two distinct phases are formed: the liquid phase, known as the pulp, and the froth phase.
Figure 2-2: Simplified Overview of Froth Flotation Process for Platinum Beneficiation
Desired minerals, through action of the flotation reagents, are hydrophobically attracted to the bubble surfaces as they rise, while waste minerals remain within the pulp phase. This results in separation and concentration of desired minerals into the froth phase (Leja, 1982).
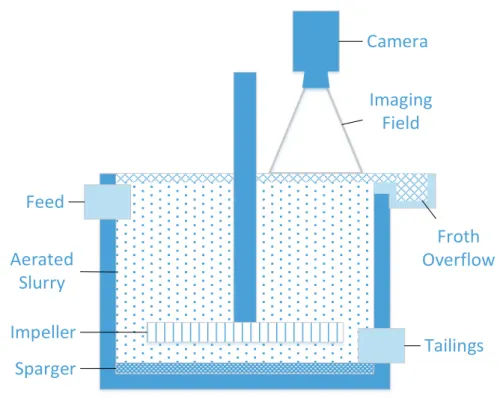
Figure 2-3: Flotation Cell Cross-Section Showing Relevant Components and Setup
Eventually the froth phase rises, up and over the weir level of the flotation cell as shown in Figure 2-3, where it is either sent to the next flotation cell for further concentration, or to final processing. A good overview of flotation systems may be found in (Gupta & Yan, 2006) and will be briefly summarised with supporting works as needed in the following sections.
2.1.1 Froth System Inputs
Process conditions, ore properties, and reagent addition all have a significant impact on both pulp and froth phases within a flotation cell. The impact of these on the flotation process will be evaluated and discussed.
2.1.1.1 Ore Type
A platinum process case study is used for this work and focus will be placed on the properties of platinum bearing ores. The effect of ores originating from specific reefs on outputs from the flotation process are likely to be significantly different from other platinum ores or processes not beneficiating platinum group metals (PGMs).
2.1.1.2 Collector Reagent
Certain minerals present in ores are generally hydrophilic and must be bound to a chemical agent to form the necessary hydrophobic properties for flotation. Collectors selectively adsorb onto minerals as a monomolecular layer through electrochemical processes, giving hydrophobic properties.
Flotation then occurs with hydrophobic particles clinging to bubble surfaces as they travel through the pulp
Impeller
Feed
Aerated
Slurry
Tailings
Sparger
Froth
Overflow
Camera
Imaging
Field
separation efficiency. In the case of platinum processing, Xanthan is generally used as a collector (Wills & Napier-Munn, 2005).
2.1.1.3 Frothing Reagent
Frothers act on air bubbles in the flotation cell using a similar electrochemical mechanism to that of collector reagents. They reduce liquid surface tension in the slurry to promote bubble growth and stability, ensuring both sufficient surface area for minerals to interact with the bubbles, and sufficient bubble lifespan to allow successful removal from the top of the flotation cell (Wills & Napier-Munn, 2005).
Excess reagent will promote greater bubble growth, but may result in excessive froth overflowing the flotation cell weir or other operational issues in downstream processes.
2.1.1.4 Modifier Reagents
As the name suggests, modifiers change conditions within the pulp phase to ensure ideal conditions for separation of valuable minerals from waste. There are several different types of modifiers which may be categorised as follows:
Activators – modify mineral surfaces to make them more accepting of collector reagents
Depressants – modify waste surfaces to reject collector reagents more strongly
pH regulators – control pH levels to balance flotation performance and equipment corrosion
Dispersants – remove clay from mineral surfaces which may form slimes, hindering flotation
Precipitants – induce dissolution of undesired ions in flotation pulp
Additionally, careful control of these reagents can allow for differential flotation, a process in which multiple desired minerals may be separated in sequential flotation cells without having to use other separation processes.
2.1.1.5 Agitation Rate
Bubble dispersion and liquid/gas interaction within a flotation cell are controlled mainly through mechanical agitation via an impeller. As impeller speed changes, so does the kinetic energy imparted to the pulp, changing bubble-particle interaction.
2.1.1.6 Air and Bubble Properties
Size, stability, and rate of bubble flow through the pulp phase are controlled by a combination of air flow rate and mechanical properties of the air distributor (sparger) within a flotation cell. Decreased air flow rate results in more stable froths containing a higher grade of desired minerals, at the expense of lowered mineral recovery and potentially lower mass throughput (Barbian, et al., 2005).
2.1.1.7 Pulp Particle Size Distribution
For a given ore, the particle size distribution must balance competing requirements of comminution costs, mineral liberation, and maximum size for flotation. The lower bound of particle size is determined by the size of mineral inclusions in the ore and cost of comminution. The ore should be crushed finely enough to allow for liberation of most valuable minerals within the ore. While there is no real limitation on further reducing particle size, capital and operating expenses increase strongly with smaller particle sizes.
The upper bound for particle size is that which can no longer participate in flotation due to gravitational forces acting on the particles.
2.1.1.8 Pulp Level
Froth height can be controlled directly by modifying pulp height within the flotation cell. Altering airflow and pulp height can ensure that requisite residence times are achieved in the pulp phase (Wills & Napier-Munn, 2005).
2.1.1.9 Temperature
Temperature has an impact on froth phase viscosity, in turn affecting bubble stability, and in some cases, can act as a depressant for minerals (Wills & Napier-Munn, 2005). However, slurry temperatures are generally not controlled due to energy requirements. Slurries may be warmer directly from comminution and cooler at later flotation stages, though overall process impact is small.
2.1.2 Fundamental Flotation Processes
There are several fundamental processes which occur in both the pulp and froth phases within a flotation cell. Inertial, gravitational, hydrodynamic, capillary, and surface forces all play a role which can be quantified through several effects.
2.1.2.1 Pulp Phase
Within the pulp phase, collection of desired minerals is determined by collisions, attachments and detachments of particles and bubbles. The more bubbles, particles, and turbulence within the cell the higher the probability of collision occurring between bubbles and particles. Each collision gives rise to the possibility of particles attaching or detaching from bubbles as they rise through the pulp.
The attached bubbles are affected by many intermolecular, interphase, and other physical forces. The chemistry within the pulp determines which particles preferentially attach and detach from the bubbles which allows separation to occur within a flotation cell (Nguyen & Nguyen, 2009).
2.1.2.2 Froth Phase
The froth phase is intimately linked to the pulp phase, though while effects within the pulp can lead to good separation of minerals to the froth phase, there are several paths of material transfer within the froth phase which can affect final recovery and grade of minerals in the froth overflow of a specific cell. The pulp phase chemistry has the largest impact on true flotation, as the particles attach selectively to bubbles due to hydrophobic effects.
Two linked processes in the froth phase are drainage, and entrainment. As the froth builds on the surface of the pulp, some pulp is captured (entrained) in the froth phase as bulk fluid which hasn’t undergone frothing, ultimately reducing selectivity of the flotation cell. Some of this fluid, along with unattached particles on the bubble surface will drain back to the pulp phase. During drainage, some of the unattached particles may attach to bubbles as with true flotation, making this an important process in maintaining good selectivity in a flotation cell (Mathe, et al., 1998).
Finally, the froth moves out of the flotation cell and to the concentrate stream. This is controlled by a combination of air-flow rate and pulp level in a flotation cell to maintain a requisite residence time for the pulp phase components. Additionally, mechanical paddles may also be used to accelerate froth transfer, though their use is uncommon.
2.1.3 Froth Appearance
Bubble size, shape, velocity, stability, and mineral loading all affect appearance of the bulk froth. As the froth is the final output of the flotation cell, its appearance can be used to infer various process conditions in the flotation process (Moolman, et al., 1995).
Each of these visual characteristics are affected as follows:
Bubble size – drainage from the froth phase and residence time
Bubble shape – in addition to the bubble size effect, froth phase depth has a large impact on shape
Velocity – directly a function of the rate of froth removal, and thus residence time
Stability – strongly affected by pulp flow rate into the flotation cell
Lastly, there is also a colour factor apparent within the froth phase which is directly affected by minerals bound to the bubble surfaces. Combining bubble shape, size, and colour gives overall textural and spectral features which may be used for control and monitoring of to varying degrees of success (Aldrich, et al., 2010). Inferring grade or recovery from these characteristics is made difficult as they are influenced by other process variables.
2.2 Industrial Application
In concentrators, several flotation cells are used both in series and in parallel, grouped in banks, to achieve requisite grade/recovery profiles and mass pull rates. Mass pull is the fraction of concentrate output mass from flotation compared to total input mass. This is distinct from recovery and measures how much of the original ore passes through flotation, a lower fraction indicates higher selectivity. There is a practical limitation on flotation cell size which, coupled with the specific flotation process requirements, limits the throughput of a single flotation cell.
Each bank of cells consists of sequential flotation cells operating under similar conditions. Concentrate is passed to each cell in sequence, further increasing the grade of the concentrate. The first bank is known as the primary rougher. Here focus is placed on recovery, with most of the valuable minerals being separated from the feed slurry. The concentrate from the primary rougher is sent to the rougher cleaner bank, where requisite grade is achieved for the final concentrate. Ultimately the final grade is a balance between flotation expenses, total recovery, and smelting costs of the concentrate.
The tailings from the rougher sections may be sent to a further set of flotation cells, the scavengers. As with the roughers, there may be both primary and cleaner scavenger, with the same goals of first getting maximum recovery, and then requisite grade. Operating conditions though are optimised for lower yield slurries as most of the desired minerals have been removed in the roughers.
While it is possible to optimise each flotation bank to maximise grade, recovery, and mass pull, this is dependent on having a good understanding of changing operating conditions within each bank. In practise each bank is operated conservatively to ensure recovery, and mass pull targets are met under varying feed conditions.
2.3 Performance Monitoring
Research indicates that the appearance of froth from flotation cells may be strongly correlated with flotation cell conditions as shown by (Li, et al., 2016), (Marais & Aldrich, 2011), and (Moolman, et al., 1995). This makes a vision-based soft-sensor an attractive candidate for use in froth flotation. Texture analysis especially is attractive as it has been found to better correlate with process conditions than spectral methods which ignore spatial relationships and are less susceptible to changing imaging conditions (Liu, et al., 2005). Process operators use appearance of flotation froths to determine operating parameters with some success (Shean & Cilliers, 2011). This provides further confirmation that relevant process information can be extracted from flotation froth images.
conditions within the flotation cell such as pulp level and air feed rates. Other process conditions such as grade and recovery have not been monitored or controlled with froth appearance in commercial applications even though research indicates this to be possible (Aldrich, et al., 2010).
2.3.1 Industry Requirements and Resources
Controlling flow rates and pulp levels are issues which have been investigated with varying levels of success in developing systems for froth flotation control. Industrial users of flotation cells require real time information of grade and mass-pull in concentration processes. Currently this may be done through on-stream analysers, but the expense and maintenance requirements often limit these to the output of a complete flotation bank, not individual cells. Image-based soft-sensors may be combined with existing online grade analysis to provide more information on individual flotation cells and perform additional tasks such as fault detection of in flotation cells that is not possible with other process sensors.
Availability of existing process data, and widespread use of froth flotation in local industry makes flotation an ideal candidate for soft-sensing. As shown in (Moolman, et al., 1995) and (Marais & Aldrich, 2011), useful process data may be extracted from textural features in flotation froths with varying degrees of success. Ideally, image-based soft-sensor systems would accept inputs from various upstream processes and other flotation cell operating set-points such as reagent dosage to maximise sensor capabilities.
The existence of extensive local industry allows professional relationships to be leveraged to gather further data for research into froth flotation. Drawbacks identified in current datasets through the course of this work can be corrected by communicating with industrial partners and obtaining additional new data through them.
Chapter 3:Soft-Sensing and Computer Vision
Soft-sensors allow process variables to be measured indirectly via existing sensors or with non-traditional sensing systems such as vision and audio systems. Such sensors can be very flexible under suitable conditions and allow for online measurement of process variables which would otherwise require offline measurement or more expensive direct sensors.
Soft-sensors do not require defined fundamental models linking measured and inferred variables, measured variables can be any process condition which is affected by the property to be inferred. A property such as process appearance which has a complex and undefined relationship with desired information may be used to develop a correlative model for monitoring and control (Kadlec, et al., 2009).
Intimately related to soft-sensing is the use of computer vision, a wide-ranging term encompassing computer processing of digital images, from acquisition to processing. It may also be referred to as machine vision, however the terminology is used interchangeably in literature. The heavy use of computer power to extract images under analysis in this work results in a preference for the term computer vision.
To provide relevant context for the selection of deep learning for sensing, this chapter will provide a broad overview of technologies and practices used in image-based soft-sensors for mineral processing.
3.1 Soft-Sensing
Online and non-intrusive measurement of key process variables is one of the hallmarks of soft-sensors. With the advent of cheaper electronics and increased computation power soft-sensor implementations and studies have increased considerably in the last 30 years. These systems are also known as soft-sensors in the process industry (Kadlec, et al., 2009).
Using measurements from standard process sensors such as pH, flow rate, temperature, or pressure additional process information may often be correlated when using a suitable model. In-depth information on soft-sensor implementation and use can be found in (Kadlec, et al., 2009), (Lin, et al., 2007), and (Kim, et al., 2013).
This contrasts with direct sensing methods which can only monitor a limited number of physical properties as determined by sensor technology. While of interest in many processes and the first step in control and monitoring, these values often do not indicate process performance unless interpreted with expert knowledge.
3.1.1 Soft-Sensing in Process Control
Many process variables of interest are difficult to measure directly, and where direct sensors exist they are often expensive and too slow relative to the rate of change in the process under measurement. In online prediction, key process variables are accurately estimated in real-time or near real-time (Kadlec, et al., 2009). These variables are more commonly known as key performance indicators and are often not apparent to standard direct sensors. Increasing measurement accuracy and speed leads to improved process control, which has a cascade effect on production efficiency, product quality, and profit (Kim, et al., 2013).
Process operator knowledge and judgement plays a key role in the smooth running of process systems and form a key part of the control process (Kluge, 2014). The knowledge and experience operators require are not trivial; estimating process performance directly from standard sensors is not possible for most processes. As processes become more complex and economic pressure grows larger, the human performance of operators is no longer sufficient, which is where soft-sensing provides an advantage.
Using data provided by soft-sensing, new forms of automation may be implemented to reduce control load on operators, reducing risk of erroneous control and improving process efficiency and safety. Inferred data may also be presented to the operator in lieu of standard variables. This abstraction of information can improve operator judgement and reduce cognitive load, albeit at the risk of hiding abnormal events which a skilled operator could otherwise identify. Any soft-sensor is only as good as the framework and data it was trained with, when presented with previously unseen or unknown process operating conditions, erroneous results may be produced by the soft-sensor.
Sensor validation is another use case for soft-sensing. Accurate process control is dependent on reliable sensor data, so for critical measurements some form of validation is commonly applied. Using a soft-sensor in this role allows for independent measurement and verification of a process variable allowing fault detection and diagnosis of both the process and the primary sensor. Often the soft-sensor may replace the primary direct sensor temporarily in the case of a fault (Fortuna, et al., 2007).
Lastly, the models developed for soft-sensors may be used in analysing process dynamics of the system by simulating scenarios of various process conditions and operation states. This may be artificially generated data or real process data gathered during unusual operating conditions or during fault conditions. This may lead to improved control methodologies as process responses are better understood from the results of scenario testing (Fortuna, et al., 2007).
3.1.2 Soft-Sensor Models
Inferential-sensors use one of two model types to correlate measured variables with desired variables: model-based, and data-based (Kadlec, et al., 2009). Vision-based sensors are inherently data-based as will be seen in the following definitions.
Model-based soft-sensors attempt to model the process being monitored in fundamental or phenomenological terms. These analytical solutions are often sufficient for steady-state models of low complexity. However, the assumptions and errors in defining such a model for a soft-sensor often limit the ability of the system to make accurate predictions under more realistic or complex process conditions, such as encountered in mineral processing systems (González, 2010). Often the analytical model may simply be too difficult to implement or computationally expensive to allow for economical real-time measurement. In contrast to model-based sensors, data-based sensors seek empirical correlations between input and output variables. Using various statistical methods and historical data, an empirical model is derived for the sensor system. This bypasses the risks of errors and assumptions in model-based systems and is more effective at establishing correlations which may be unknown in current fundamental models. Data-based sensors are also capable of predicting process conditions where no fundamental models have been developed or are feasibly possible, such as vision-based sensors. However, data-based sensors can be sensitive to errors and bias in input data, which may require significant pre-processing to produce data that reflects the full range of process conditions accurately. Additionally, this also makes extrapolating for unknown process conditions riskier when compared to model-based sensors.
For these reasons, data-based or hybrid (data and model-based) approaches are preferred in industrial applications (González, 2010). Additionally, data-based models can be continuously improved (though also requiring continuous calibration) as more data is gathered and analysed (Fortuna, et al., 2007), mitigating some of the initial disadvantages of deploying a data-based sensor into a process. However, there is a trade-off between simpler soft-sensor models which require more frequent updating or more complex models which can be updated less frequently, but require more complex methods to develop and implement (González, 2010).
3.1.3 Developing Soft-Sensors
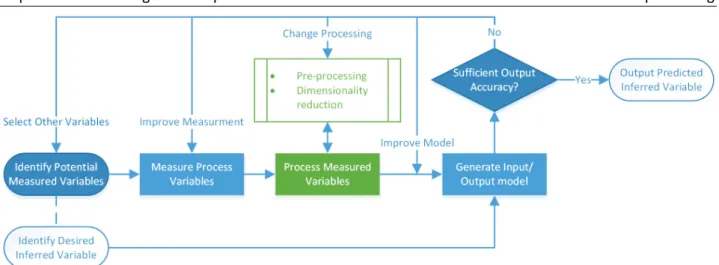
This review of soft-sensor development and implementation will be limited to data-based models, which are the focus of this study. Further information on model-based sensors may be found in (Fortuna, et al., 2007). The first step in soft-sensor development, regardless of model type, is to identify the desired output, or inferred variables and potential input, measured variables. A generic framework for developing data-based soft-sensors is summarised in Figure 3-1. The identification and measurement of process variables pertinent to developing an accurate soft-sensor is often made easier by the significant volume of historical data collected in modern process plants. For older plants or in cases where data has not been gathered, the task of collecting relevant data is often more time consuming and expensive than developing the soft-sensor model itself (Kadlec, et al., 2009).
Figure 3-1: Development Framework for a Generic Data-Based Inferential Senor
Data fed into a soft-sensor during training is often pre-processed to minimise bias and correct for missing data which may affect later models, though this is not compulsory for all models. In some cases, later dimensionality reduction methods or specific soft-sensor models may be resilient to data deficiencies, thus pre-processing is skipped.
Final processing of the data is generally some form of dimensionality reduction when the number of measured variables is large, as is the case with vision-based systems. In this step, original data is transformed or mapped to new data that is smaller in size, but still representative of differences within the original dataset. This reduced representation (known as the feature set) is used to generate the final input/output model of the inferential-sensor with greater accuracy and speed than possible with the original measured variables. In this study, the capability of dimensionality reduction (specifically feature extraction from images) of various methods will be compared in the context of process engineering requirements.
One of the more common methods of analysis applied in process engineering is principal component analysis (PCA), which projects data onto axes of maximum variation (Elshenawy, et al., 2010). The most important of these principal components may be selected and the rest discarded as a form of dimensionality reduction. As these components are linear transforms of the original measurements, they do not necessarily have any effect on the separability of non-linear data (Jolliffe, 2014). For vision-based soft-sensors, other strategies are more commonly applied.
As vision-based soft-sensing is the primary component of this work, only data-based input/output models will be evaluated and discussed. There exists no fundamental model between appearance and conditions for most processes, or it is so complex as to be infeasible to implement. The input/output model may either perform regression or classification, depending on the requirements and properties of the desired inferred variable. The most common methods used in soft-sensors include: partial least squares (PLS), shallow artificial neural networks (ANN), and support vector machines (SVM) (Kadlec, et al., 2009). To train the input/output model, a linked dataset of the inferred variable and measured variables is required to learn the required classification or regression models.
The measured variables, pre-processing and processing methods, and input/output model are changed and improved until sufficient accuracy in the inferred variable is achieved for monitoring and control tasks.
3.2 Computer Vision
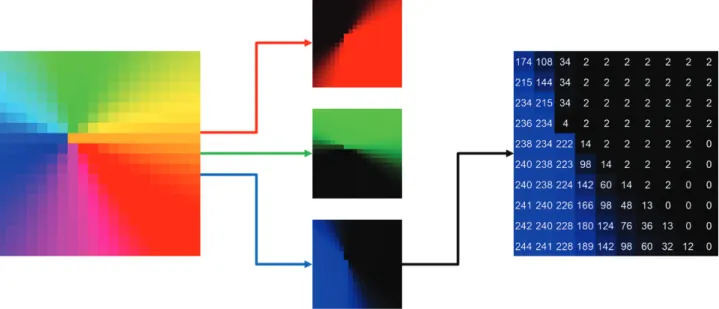
Digital images are stored as a grid of points representing luminous intensity at each point, more commonly known as pixels. In colour images, each pixel consists of three channels with luminous intensities for the primary colours red, green, and blue, as shown in Figure 3-2. The three channels in the image form the colour space of the image, in this case RGB colour space. Other mappings exist such as HSL (Hue, Saturation, Lightness), and LAB (Luminance, A and B colour components). However, these other colour spaces are intended to improve image editing by presenting image channels as they are interpreted by human vision and have little to no effect on computer vision algorithms (Sonka, et al., 2015).
Figure 3-2: Breakdown of Information Storage in an 8-bit RGB Image
Spectral bands other than red, green, and blue may be detected by vision systems, such as ultraviolet and infra-red, which may provide additional information not apparent to the human eye. Additional optical phenomena such as polarisation may also be recorded, but is outside the scope of most computer vision systems and this work.
In standard consumer imaging systems, the luminosity values are represented as 8-bit values, leading to 256 distinct intensity levels from 0 (darkest) to 255 (lightest). For the purposes of computer vision, each pixel is considered a variable which itself may be monochrome or consist of multiple spectral values for colour images. Unlike other multivariate data sources in soft-sensing, images are highly correlated across a 2-dimensional (3-2-dimensional if including colour channels) field, requiring specialised methods of feature extraction. These are known as textural features and are a function of spatial relationships within images (Haralick, et al., 1973).
If the spatial information is not considered important by later analysis or bulk spectral information is required, the images may be unrolled into vectors. For, example a 16x16 pixel colour image would unroll to 768 variables. A 32x32 pixel image would unroll to 3072 variables. This demonstrates the rapid growth in variables with image resolution which requires the use of feature extractors in vision-based soft-sensors. The ultimate goal of computer vision is to detect and extract information which could have been obtained by a human physically observing the process and additional information which would not be apparent to a human observer. As a result, many computer vision implementations, including deep learning, attempt to recreate biological models of vision. Computer vision systems have improved with increasing computational power and can qualitatively and quantitatively outperform humans in several tasks (He, et al., 2015), (Ciregan, et al., 2012). However, computer vision systems remain limited to specific applications and cannot match the flexibility of humans (Yu & MacGregor, 2004).
3.2.1 Computer Vision in Soft-Sensing
Most computer vision systems are a specialised form of soft-sensors where images form multivariate inputs to a soft-sensor. They are inherently data-based due to the extreme difficulty of developing accurate fundamental models linking image appearance with process conditions. As with any other soft-sensor input, pre-processing and processing steps must occur before the input/output model is developed.
Starting with the imaging device, images must be fed into the soft-sensor under potentially demanding industrial conditions. Traditionally it has been important to maintain uniform and consistent conditions under which to capture images. However, in more advanced processing methods such as deep learning, this may no longer be the case with sufficient data to train such systems to compensate for changes during image acquisition (LeCun, et al., 2004).
Common pre-processing tasks for images include: normalisation, histogram equalisation, and channel extraction. Only certain spectral channels in conjunction with contrast enhancement may be selected for further processing. This is especially important for most traditional feature extraction methods but is not as important for methods such as deep learning which can incorporate such actions within the model because of its structure and training process.
As previously mentioned, the high dimensionality of images imposes the requirement of feature extraction when used in soft-sensing. Most input/output models for soft-sensors perform poorly with many input variables and often take substantially longer to train the larger the input dataset is. Dimensionality reduction must be able to extract useful information from the image data while discarding as much extraneous information as possible. Generally, two types of features are extracted from the original data: spectral and textural features.
Spectral features only consider bulk parameters of pixels in an image, such as mean values for each colour channel. They do not consider spatial relationships, allowing more rapid processing with methods such as PCA. Their performance is often satisfactory under controlled conditions, but due to the spectral nature, the features are very dependent on imaging conditions (Vathavooran, et al., 2006).
Conversely, textural features are strongly dependent on spatial distributions within input images. In order to fully exploit these and intelligently reduce dimensionality, it must be ensured that pre-processing preserves spatial properties in all images. Traditional textural feature methods such as local binary patterns (LBPs), grey-level co-occurrence matrices (GLCMs), and wavelets are suited to specific image types, with no method universally applicable to all images under all conditions (Yu & MacGregor, 2004). Their parameters directly relate to spatial properties within the input images and good performance is dependent on expert selection of them.
Textural and spectral methods are generally limited to only analysing one of the feature types, discarding the other potentially valuable process information. However, methods such as deep learning networks may, through training, inherently consider both textural and spectral information to produce reduced feature sets. More detailed information on textural features will be available in the next chapter.
Regardless of the dimensionality reduction method used, the reduced feature sets are fed into the input/output models the same way low dimensional data would be fed directly into a soft-sensor without feature extraction. No unique input/output models are required outside of the training required for all soft-sensors.
3.2.2 Computer Vision in Industry
There are several industrial applications of computer vision systems which can be divided into four broad categories: defect detection, like finding abnormalities in products such as textiles (Özdemir, et al., 1998); object detection, determining if an object or shape is of interest in autonomous systems (Oquab, et al., 2014); classification, discriminating between several possible classes for an image such as detecting if there are or aren’t faces visible in them (Chan, et al., 2015); and regression, continuous response to input images such as classifying mineral properties (Marais & Aldrich, 2011).
The last two methods show good applicability to mineral processing and make computer vision an attractive tool for process engineers (Stanford, et al., 1992). The appearance of solids and mineral rich slurries has been shown to provide information on current process conditions in mineral processing (for example, (Kistner, et al., 2013)). One of the primary objectives of this work is to implement an image-based soft-sensor using deep learning in a mineral processing context.
Several commercial systems have been developed for the minerals processing industry in specialised applications such as mineral detection in slurries and froth flotation bubble feature detection (Barbian, et al., 2005).
Froth flotation was selected as the application for a deep learning system in this study. As with other metallurgical concentration methods, there are two primary measures of economic performance: grade and recovery (of valuable minerals in the concentrate output). Grade and recovery are linked via a curve specific to the mineral composition and process under evaluation. The operating position of the process on this grade/recovery curve is difficult to ascertain quickly with traditional sensors. In addition, the shape of the cure may vary with changes in process conditions. Online measurements are preferred for these properties. Recovery cannot easily be measured online as the quantity of the specified mineral must be known both in the input and final output streams of the entire process. This can typically be achieved only as part of a steady state mass balance after assay of all the process inputs and outputs. In contrast, grade is more easily measured online as it is defined as the fraction of valuable minerals in the total product stream under measurement (Duchesne, 2010). Grade will be the key performance indicator measured by the deep learning soft-sensor developed in this work.
Chapter 4:Image Feature Extraction
Feature extraction, as introduced in the previous chapter, is a method of dimensionality reduction which maintains meaningful information of the original input data for use in various applications. While it can refer to any method of dimensionality reduction, within the context of this work, feature extraction refers to (primarily textural) methods to reduce dimensionality of images for use in process sensing and monitoring. This chapter will focus primarily on textural methods of feature extraction as those are likely to be more robust for process engineering applications. Textural features are complex and contextual image properties, but at their simplest, may be considered representations of repeating spatial organisation within an image (Xie, 2008). Textures vary from image source to image sources and few methods are suitable for all image sources when using the same extraction parameters.
Older methods of texture feature extraction require assumptions about structural content of images and have a number of parameters which must be carefully selected. Conversely, deep learning methods as discussed in the next chapter, are more flexible and do not make assumptions of image properties, rather they are learned inherently during training (Baldassi, et al., 2016).
4.1 Approaches to Texture Feature Extraction
The approaches selected for texture extraction vary based on the types of images to be analysed and the task which is to be achieved. Most tasks in texture analysis can be classified as one of the following:
Segmentation – detecting and dividing images into areas of similar textures
Synthesis – identifying and modelling the fundamental structure of textures to recreate them
Classification – detecting and categorising images into pre-defined classes
Segmentation commonly uses structural approaches to model texture properties in terms of fundamental features. These texture primitives (fundamental texture components) may be areas of uniform brightness, line segments, or other simple geometric shapes. Textures are defined by the spatial relationships and statistics of these primitive features which can then be detected and output as feature sets. The feature sets may be used directly as outputs in terms of the fraction of the image covered by a certain texture or they may be used as an input in another texture processing step, such as identifying areas of interest for other texture extraction methods.
Synthesis is more complex and has not been used in vision-based soft-sensors. Feature or texture synthesis involves the extraction of a reduced feature set, and the reconstruction of a texture from the reduced features. While a reconstructed texture is not much use in a soft-sensor, it is a powerful tool for validating reduced feature sets. By sufficiently reconstructing an arbitrary texture from a reduced feature set it can be