Graph Cuts based Image Segmentation using Fuzzy Rule
Based System
Muhammad Rizwan KHOKHER, Abdul GHAFOOR, Adil Masood SIDDIQUI
Department of Electrical Engineering, Military College of Signals National University of Sciences and Technology (NUST), Islamabad, Pakistan [email protected], [email protected], [email protected]
Abstract. This work deals with segmentation of the gray scale, color and texture images using graph cuts. From an input image, a graph is constructed using intensity, color and texture profiles of the image simultaneously (i.e., inten-sity and texture for gray scale images and color and tex-ture for color images). Based on the natex-ture of image, a fuzzy rule based system is designed to find the weight that should be given to a specific image feature during graph develop-ment. The graph obtained from the fuzzy rule based weighted average of different image features is further used in nor-malized graph cuts framework. The graph is iteratively bi-partitioned through the normalized graph cuts algorithm to get optimum partitions resulting in segmented image. The Berkeley segmentation database is used to test our algorithm and the segmentation results are evaluated through proba-bilistic rand index, global consistency error, sensitivity, pos-itive predictive value and Dice similarity coefficient. It is shown that the presented segmentation method provides ef-fective results for most types of images.
Keywords
Segmentation, normalized graph cuts, fuzzy rule based system.
1. Introduction
Image segmentation divides an image into meaning-ful pieces or segments with perceptually same features and properties. The aim is simplification and representation of the image to make it more meaningful and easier to analyze. It is an important step in high level processing techniques (like object detection and recognition) and an important re-search area [1]-[16].
Several techniques of image segmentation exist in the literature (including histogram [1], edge based [2], data clus-tering [4], watershed transformation [6], mean shift [7] and graph cuts [8]). Sometimes different techniques are merged to get better results [9]. Histogram thresholding [1] works effectively for monochrome images but for color images,
the scenario is different (where multi-thresholding for RGB histograms becomes challenging). The boundaries formed using edge detection based methods [2] are not necessarily closed and the results vary where regions are fused together. In data clustering [4], the edge information and spatial struc-ture is not well-looked-after, furthermore it is biased towards ellipsoidal clusters. In case of watershed transformation [6] and mean shift [7], a large number of small regions are pro-duced (as these are unsupervised segmentation methods hav-ing a priori knowledge of number and size of segments), therefore a kind of region merging algorithm is applied to cater to this effect.
So far, one of the most promising approaches for image segmentation is based on the graph cuts [8]. Graph based methods help in image perceptual grouping and organiza-tion using image features and spatial informaorganiza-tion. The input image is converted into an undirected graph with image pix-els as its nodes and edge weighting is made by taking into account the similarity or dissimilarity between image pixels. Then a graph partitioning algorithm is applied to partition the graph. Existing partition methods include ratio cuts, aver-age cuts, minimum cuts and normalized cuts [10]-[12]. The normalized cuts method was proposed [12], [13] to solve the perceptual grouping problem for optimal segmentation. Re-sultantly, segmented image is obtained from the partitioned graph.
In related work, there are some techniques that use dif-ferent image features (i.e., color and texture) and graph cuts for color-texture segmentation [14]-[18]. In papers [14], [16], the foreground is extracted from background using color and texture features of image and minimum cuts al-gorithm as graph cuts. Texture feature extraction is made by textons computation in [14] and SIFT (scale-invariant fea-ture transform) in [16] while color feafea-ture extraction is done by using RGB color model in both. Here, color model to be chosen is important. RGB does not provide a good human perception of colors which should be considered while using graph cuts. Also, minimum cuts algorithm does not work for isolated nodes in graph and it considers them as a sepa-rate segment which is not desirable [13]. In another method [15], watershed algorithm is used to find a large number of small regions and these regions are used to construct a graph
with these regions as its nodes. Then graph cuts algorithm is used to get the segmented image with K-means algo-rithm for quantization. Merging different segmentation al-gorithms is effective but computationally expensive. In pa-pers [17], [18], minimum cuts algorithm is used which does not cater the effect of isolated nodes in the graphs. In our method, Lab color space is used for better human percep-tion of colors as it is specifically designed for this purpose. Also the normalized graph cuts algorithm is used to cater the effect of isolated nodes which is ignored by minimum cuts algorithm, and for optimum partitioning of graph.
Segmentation using the graph cuts is highly dependent on optimum calculation of weights on the edges in graph de-velopment. Different methods have been discussed in this regard [13] but still some improvements are required to ac-complish this essential step. With in view, edge weighting is made by considering brightness, color and texture profiles of an image simultaneously (i.e., brightness and texture for gray scale images and color and texture for color images). The main focus is to get the knowledge about how much a specific image feature should be involved in development of an optimized graph. Simple averaging may not give the required results. Therefore, a fuzzy rule based system [19] is used to get the knowledge of how much a specific image feature should be involved in building the optimized graph. The proposed image segmentation scheme can be embed-ded into high level processing techniques (like object clas-sification and recognition) for better results. The Berkeley segmentation database [20] is used to experiment with our algorithm. Different evaluation measures like probabilistic rand (PR) index [21], global consistency error (GCE) [22], sensitivity, positive predictive value (PPV) and Dice simi-larity coefficient [23] are used to quantitatively evaluate the segmentation results.
2. Graph Development using Fuzzy
Rule Based System
The input image is first transformed into a weighted undirected graphG(V,E)whereV={v1,v2,v3, ...,vm×n}is the set of nodes and the set of edges between nodes is rep-resented byE. The graphG(V,E)is internally represented by an affinity matrix or similarity matrix W that contains weights on all the edges in the graph. Different image fea-tures help in finding the degree of similarity between neigh-boring pixels to construct the similarity matrix W. A vital step in the graph cuts based method is the optimum com-putation of similarity matrix as graph partitioning part to-tally counts on it. Local image features like brightness, color and texture can be modeled and formulated to approximate the likelihood of neighboring pixels to belong to a common segment. Different categories of images can have different types of local features in rich amount. For example, in gray scale images like medical images, the intensity character-istics cover most of the information and in natural images,
the color feature is dominant. Choice of proper color space is an important factor while choosing among different color spaces like RGB, HSV and Lab etc. Other than gray level or color information, texture is considered to be an important feature that provides strong base to interpret images.
2.1 Image Feature Models
Now we define the image feature models using bright-ness, color and texture for development of similarity matrix. 2.1.1 Brightness
Considering the brightness feature of pixels and their spatial locations [13], intermediate brightness similarity ma-trixWbcan be calculated as:
forkSvi−Svjk2≤ℜ, Wb(vi,vj) =exp " − kI vi−Ivjk2 α 2 − kS vi−Svjk2 β 2# , (1) otherwise,Wb(vi,vj) =0. In (1),kIvi−Ivjk2andkSvi−Svjk2
are the Euclidean distances in intensity and spatial domains respectively. Ivi is the intensity value whileSvi is the spatial
location of nodevi.k·k2is the Euclidean norm.α,β∈(0,∞)
are the free factors to adjust the gray level and position im-pact on calculation of the weights. ℜcontrols the influence of the number of local vertices taking part in weight calcula-tion.
2.1.2 Color
For optimal segmentation based on color feature, the perceptual color differentiation and Euclidean distance in color space should be linked together [9]. Lab color space has been specifically designed to keenly approximate the hu-man vision perception. L component, which is lightness, matches the human perception of brightness.aandbare the chromaticity coordinates. The intermediate color similarity matrix Wcusing Lab color space can be calculated as:
forkSvi−Svjk2≤ℜ, Wc(vi,vj) =exp " − kZ vi−Zvjk2 α 2 − kS vi−Svjk2 β 2# , (2) otherwise, Wc(vi,vj) =0. HereZvi={L(vi),a(vi),b(vi)}is
the color feature vector for nodevi. 2.1.3 Texture
In both image categories (natural color images and gray scale), texture holds a substantial information to analyze the image. Julesz [24] introduced the term texton. Textons are used widely to analyze the images. Windowed texton his-tograms are compared to calculate texture similarities. Win-dow for pixelviis represented byJ(vi)centered at pixelvi. There areKnumber of bins per histogram, one for each tex-ton channel. The number of pixels in textex-ton channelkthat fall inside the windowJ(vi)is used to compute the value of
kthhistogram bin for pixelvi. This can be written as: hvi(k) =
∑
j∈J(vi)
I[T(vj) =k] (3)
whereT(vj)gives the texton assigned to pixelvj andI[·]is the indicator function. The pairwise difference between two histogramshvi andhvj at pixelsviandvjrespectively is
cal-culated as: χ2(hvi,hvj) = 1 2 K
∑
k=1 [hvi(k)−hvj(k)]2 hvi(k) +hvj(k) (4)wherehvi andhvj are the two histograms. Now the
interme-diate texture similarity matrix Wt can be calculated as: Wt(vi,vj) =exp
−χ2(hvi,hvj)/γ
(5)
whereγ∈(0,∞)is a free factor adjusting the effect of texture
on calculation of the weights. If the histogramshvi andhvj
are very different, weight Wt(vi,vj)is small due to largeχ2.
2.2 Weighted Average of Image Features
The above feature models provide the intermediate similarity matrices estimating the similarity between neigh-boring pixels. Each model estimates some dominant feature in the image but is not good enough on its own to build an op-timized similarity matrix which is the foundation of segmen-tation process. We need to pour the effect of most of the im-age features in similarity matrix. For this purpose weighted average of intermediate matrices Wb, Wc and Wt (i.e., Wb and Wt for gray scale images and Wc and Wt for color im-ages) is calculated to treasure the final similarity matrix W. It can be formulated as:
W(vi,vj) =
∑
pcp∗Wp, 0≤cp≤1 (6)
wherep=b,candt, constantscb,ccandct represent the weights to average out intermediate similarity matrices Wb, Wc and Wt respectively. For gray scale images, constant cc=0 while for natural color images, constantcb=0. 2.2.1 Fuzzy Rule Based Calculation of Constants
The calculation of constantscb,cc andct depends on the involvement of brightness, color and texture in the image accordingly. This knowledge is imprecise since it does not state how much these different image features are involved in the image and what should be the values of constants. In this case, a fuzzy rule based system can be viewed for approx-imation. The fuzzy rule based system is interpreted in lin-guistic terms (i.e.,small,medium,large) and provides high interpretability as well as high accuracy. The process of fea-ture extraction, constants calculation using fuzzy rule based system and weighted averaging is shown in Fig. 1.
Fig. 1.Similarity or weight matrix calculation.
The intermediate similarity matrices Wb, Wc and Wt can be analyzed to gauge which feature would provide more information about the nature of image. This can be done by taking mean value of the intermediate similarity matri-ces. The mean value will be the closer to zero the higher the involvement of that specific feature. These values are the inputs of fuzzifier where crisp values are transformed into fuzzy values. Gaussian fuzzifier (GF) [19] is used as it has advantage over other fuzzifiers in terms of accuracy and effi-ciency. Membership function (MF) of GF to mapx∗to fuzzy set, can be represented mathematically as follows:
µF(x) =e − x1−x 0 1 σ1 !2 ? ... ?e − xN−x 0 N σN !2 (7) whereσiare the positive parameters,Nrepresents number of linguistic terms used and t-norm?is usually selected as alge-braic product. A collection of linguistic values (i.e.,H:high, M:medium,L:lowandSct:small,MSct:medium small,Mct:
medium,MLct:medium large,Lct:large) is given to each of
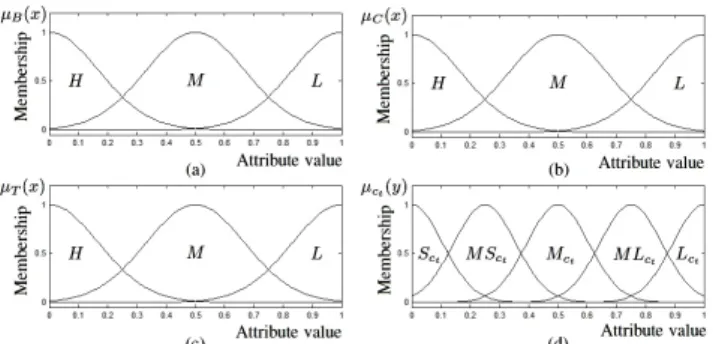
the input and output variables. The input and output Gaus-sian MFs are shown in Fig. 2.
Fig. 2.(a), (b) and (c) Gaussian MFs of linguistic values for in-puts. (d) Gaussian MF of linguistic values for output. µB(x),µC(x)and µT(x)are the input MFs and µct(y)
is the output MF. For color imagesµC(x)andµT(x)and for gray level imagesµB(x)andµT(x)are considered. One out-put MF is taken for calculation of constantct as rest of the constants can be calculated ascc=1−ctandcb=1−ctfor the color and gray level images accordingly.
A Rule base comprises fuzzy IF-THEN rules describ-ing the relation between above fuzzy ldescrib-inguistic input and out-put values. Rule base should be meaningful, consistent and simple [19]. It can be described by a decision table. There
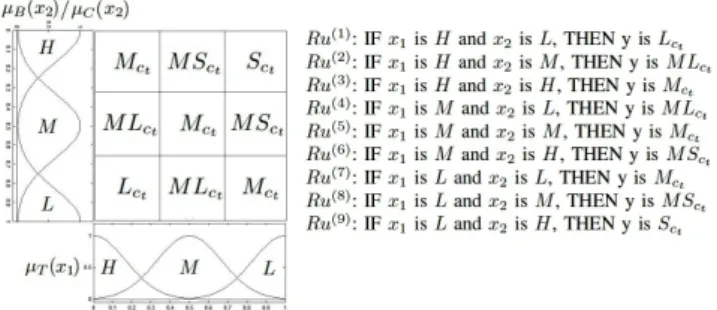
are nine cells generated by three antecedent linguistic values (i.e.,H: high,M: medium,L: low) on each axis of two di-mensional space. Each of the nine cells correspond to nine fuzzy IF-THEN rules. Fig. 3 shows the decision table and fuzzy IF-THEN rules for rule base.
Fig. 3.Decision table and fuzzy IF-THEN rules.
For certain input, any of the nine rules can be fired. If multiple rules are fired, inference engine will look after the processing. In the inference engine, all rules to be fired are combined first to get a single fuzzy relation, viewed as a single fuzzy IF-THEN rule which is then used to get the output. Accepting the point of view that all rules are inde-pendent conditional statements, Mamdani inference engine [19] is used to combine the rules. Mathematically:
QM= M
[
r=1
Ru(r) (8)
whereQMis the resultant fuzzy relation,Mis the number of rules to be fired.
The fuzzy output from inference engine is transformed back into crisp value using center average defuzzifier [19]. As fuzzy output set is union ofM fuzzy sets, a better ap-proximation is weighted average of centers ofMfuzzy sets with the weightswrequal to heights of corresponding fuzzy sets. It can be written as:
c∗t = M
∑
r=1 ctr∗wr M∑
r=1 wr (9)wherec∗t is the final crisp output. It is computationally sim-ple and small changes in crt andwr result in small change inc∗t.
3. Graph Partitioning using
Norma-lized Graph Cuts Framework
Finalized similarity matrix W through weighted av-erage of intermediate similarity matrices Wb, Wc and Wt is used to build the required graph G(V,E). This graph is then partitioned using normalized graph cuts framework [12], [13]. The normalized graph cuts framework [12], [13]
is used to get optimal partitions through recursive bisections of the graphG(V,E). The weight matrix W is used to find the different components of a generalized eigenvector sys-tem [13] as follows:
(D−W)y=λDy (10) where D is the diagonal matrix calculated as D(vi,vi) =
∑vjw(vi,vj)andy={a,b}
m×nis an indicator vector to indi-cate the identity of pixels towards their group. Hereyvi=a
ifvi∈V1andyvj =bifvj∈V2. λrepresents the
eigenval-ues which give eigenvectors to partition the graph. Using the second smallest eigenvector, an optimized partition is calcu-lated and graph is partitioned into two parts. This process of bi-partitioning the graph, continues iteratively if segmented graph needs to be subdivided. From these graph partitions, the segmented image is obtained.
The proposed method of graph development through weighted average of different image features using fuzzy rule based system and graph partitioning through normalized graph cuts framework can be summarized as follows:
1. Given an image, extract the image features using dif-ferent feature models as follows:
(a) Use the image intensity profile to calculate Wb from (1).
(b) Use Lab color model to find Wcfrom (2). (c) Use the texton based texture analysis method to
compute Wtfrom (4) and (5).
2. Calculate the constantscb,cc andct using fuzzy rule based system as follows:
(a) Transform the crisp inputs into fuzzy inputs us-ing GF with three lus-inguistic terms from (7). (b) Apply the fuzzy IF-THEN rules to get the
out-put.
(c) Combine the rules to be fired using Mamdani in-ference engine from (8) to get a single fuzzy re-lation.
(d) Transform the fuzzy output into crisp output us-ing center average defuzzifier from (9).
(e) Get the constantscb,ccandct.
3. Calculate the weighted average of Wb, Wcand Wt to obtain final similarity matrix W from (6).
4. Partition the graph G(V,E) using the normalized graph cuts framework as follows:
(a) Use the similarity matrix W to find the diagonal matrixD[13].
(b) To get eigenvectors with smallest eigenvalues, solve the generalized eigenvector system using (10).
(c) Bi-partition the graph using eigenvector with second smallest eigenvector.
(d) Decide if current partition should be subdivided. If yes, repartition the segments iteratively to get final result.
5. Get segmented image from the partitioned graph.
4. Quantitative Evaluation
Recently, the development of new image segmentation techniques has inspired the requirement of evaluating these methodologies. From one individual to another, image per-ception is inconsistent resulting in multiple solutions so we need some techniques that compare the results with differ-ent manual segmdiffer-entations (ground-truth). PR index [21], GCE [22], sensitivity, PPV and Dice similarity coefficient [23] methods are used to evaluate our segmentation algo-rithm. These methods compare the segmentation results with ground-truth images and provide a measure of similar-ity/dissimilarity to evaluate the segmentation algorithm in an effective way.
4.1 PR Index
PR index is a generalization to rand index. Rand index [25] measures the agreement of a segmentation result with a given ground-truth. It compares the two segmentations (i.e., segmentation result and ground-truth) by considering pairwise label relationship. Let the two segments beSand S0 with label assignmentli andli0 respectively forN points X=xi, wherei=1,2, . . . ,N. Rand index is defined as ratio of number of pixel pairs having same label relationship inS andS0. It can be represented as:
R(S,S0) = (11) 2 N(N−1)
∑
i,j I(li=lj∧li0=l 0 j) +I(li6=lj∧li06=l 0 j)wherei6=jandIis the identity function while the denom-inator represents all possible unique pixel pairs in a data set ofN points. The number of unique labels can be different and same (special case) in S andS0. This measure varies from 0 to 1, where 1 represents thatS andS0 are identical and 0 represents the total dissimilarity. Let us denote a set of ground-truth segmentations{S1,S2, . . . ,Sx} of an image
X={x1,x2, . . . ,xN}, whereNis total number of pixels. Let
Stestbe the segmentation result to be compared with ground-truth segments. Letlitestbe the label of pointxiin segmenta-tionStestandliSk in the ground-truth segmentationsSk. Each labellSk
i andl Stest
i can take values in a discrete set of sizeLk andLtest respectively. In a scenario where each human ob-server gives the segmentationSkin form of binary numbers I(lSk
i =l Sk
j )for each pair of pixelsiandj. The set of ground-truth segmentations defines a Bernoulli distribution over this number giving a random variable with expected value pi j. The PR index is then defined as:
PR(Stest,{Sk}) = 2
N(N−1)
∑
i,j[ci jpi j+v(1−ci j)(1−pi j)](12) wherei< j and ci j =I(liStest =l
Stest
j ) represents the event of pixels i and j having same labels in Stest and pi j =
1 K∑ K k=1I(l Sk i ,l Sk
j )is the probability ofiandjhaving the same label acrossSk. This measure varies from 0 to 1, where 1 represents maximum similarity between Stest and ground-truth segmentations and 0 represents no similarity. Since ci j∈ {0,1}, equation (12) can be written as:
PR(Stest,{Sk}) = 2 N(N−1)
∑
i,j h pci ji j(1−pi j)(1−ci j) i (13) wherei< j. In (13), pci ji j(1−pi j)(1−ci j)represents the like-lihood of pixelsi and j taking valueslStesti andl Stest
j under the defined Bernoulli distribution. The computational com-plexity of PR index isO(KN+∑kLk)which is only linear inN.
4.2 GCE
This evaluation measure [22] is related to consistency among segmentations. GCE is designed to be tolerant to re-finement. LetSandS0be the two segmentations to be eval-uated through consistency error measure. Error measure lies in the range 0 to 1, where 0 represents no error. Segments SandS0are considered for a given pixel pi. The pixel lies in the area of refinement if one of the segments is a proper subset of the other. Otherwise, two regions overlap in an inconsistent way and corresponding error is calculated. Set difference is denoted bynand|x|for the cardinality of setx. ForR(S,pi)being a set of pixels that correspond to a region in segmentationScontaining pixel pi, the local refinement error is given as:
E(S,S0,pi) =
|R(S,pi)nR(S0,pi)|
|R(S,pi)| . (14)
This local error measure is asymmetric. It encodes only one directional refinement measure. E(S,S0,pi)is approxi-mately zero whenSis a refinement ofS0but not vice versa. This local refinement can be considered in each direction. The method used to combine the values for the entire image into an error measure is called GCE which forces all the lo-cal refinements to be in the same direction. GCE is defined as: GCE(S,S0) =1 Nmin (
∑
i E(S,S0,pi),∑
i E(S0,S,pi) ) (15) whereNis the total number of pixels.4.3 Sensitivity, PPV and Dice Similarity
Coefficient
The segments obtained after segmentation process can be validated and evaluated by comparing them to manual segmentation or ground-truth using binary classifiers. Sen-sitivity S and PPV are the measures used to evaluate the
Fig. 4.(a)-(f) Original images. (g)-(l) Segmentation using proposed method. (m)-(r) Segmentation using generic normalized graph cuts method [12], [13] considering individual image feature (i.e., brightness Wband color Wcfor gray scale and color images accordingly). (s)-(x)
Segmentation using generic normalized graph cuts [12], [13] method considering texture Wt.
segmentation results by calculating number of true positive T Pn, false positiveFPnand false negativeFNnvoxels. Using these voxels, S and PPV is given as:
S= T Pn T Pn+FNn , (16) PPV= T Pn T Pn+FPn . (17)
Dice similarity coefficient D [23] compares the two sets, in our case one set is a segment from test image and other from ground-truth or manual segmentation. Let these two sets beAandB, then D is calculated as:
D= 2|A∩B|
|A|+|B| (18)
where| · |represents the function that provides area of the segment.
5. Results and Discussion
A variety of gray scale and natural color images are used to test the performance of proposed algorithm. The
Berkeley segmentation database [20] with 500 images of size
481×321 and their ground-truth or manual segmentations is
used to test our algorithm. Simulations are performed us-ing C programmus-ing language and Matlab. To compute the intermediate weight matrices, Euclidean distance in spatial domain or connection radius of graph is taken as √2 or
ℜ=
√
2. This indicates that we are considering only im-mediate neighbor pixels to calculate the graph due to their major contribution in describing similarity/dissimilarity be-tween pixels. Parametersα,βandγare taken as unity.
Fig. 4(a)-(f) shows the test images used to experi-ment on the proposed algorithm. The segexperi-mentation results through proposed algorithm are shown in Fig. 4(g)-(l). For comparison, segmentation results using generic normalized graph cuts which uses individual image feature for graph de-velopment (i.e., brightness Wband color Wcfor gray level and color images accordingly), are shown in Fig. 4(m)-(r). We can observe that the results are not impressive as there is some involvement of texture, not significant but ignored. In same manner, if we only take Wt texture feature and ig-nore brightness Wbor color Wc which holds major image information, segmentation results are not even considerable as shown in Fig. 4(s)-(x). Fig. 5 shows some more
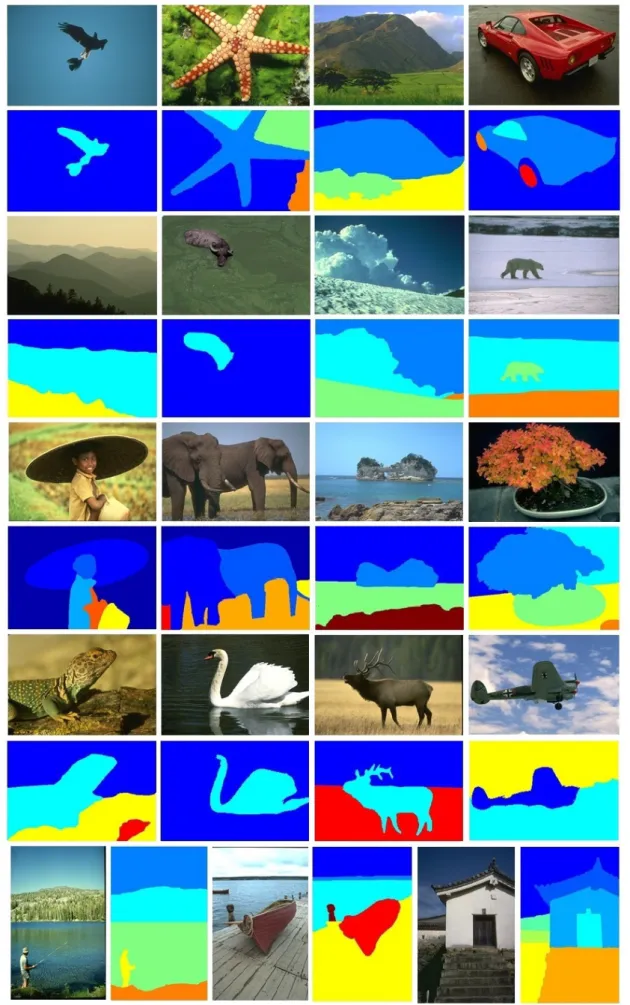
seg-Fig. 5.Image segmentation results through proposed method of weighted average of different image features using fuzzy rule based system and graph partitioning using graph cuts.
Fig. 6.(a)-(b) PR index and GCE distribution of proposed method and generalized normalized cuts method [12], [13]. (c)-(d) PR index and GCE measure for images depicted in Fig. 4(a)-(f) using proposed method and normalized cuts method [12], [13].
mentation results using the proposed method in color label representation on images from the Berkeley segmentation database.
PR index [21], GCE [22], sensitivity, PPV and Dice co-efficient [23] are used for quantitative evaluation of proposed algorithm. These methods use the ground-truth segmenta-tions to evaluate the segmentation results. Fig. 7. shows ground-truth segmentations for images depicted in Fig. 4(d) and Fig. 4(e). PR index and GCE distribution for proposed method and its comparison with generalized normalized cuts method using individual image feature (i.e., color/brightness for color/gray level images and texture for texture images) are shown in Fig. 6(a)-(b).
Here we can see that through PR index most of the im-age percentim-age for proposed method is close to 0.8 and 0.9 index value which shows good segmentation results. Most of the GCE distribution for the proposed method is close to zero which indicates very low error. PR index and GCE dis-tribution is not up to the mark specially in case that only texture feature is used whereas PR distribution is good but
Fig. 7.Ground-truth segmentations for the images shown in Fig. 4(d) and Fig. 4(e).
not impressive in case of color/brightness feature. PR in-dex and GCE is calculated for images shown in Fig. 4(a)-(f) and comparison of proposed method and normalized cuts is presented in Fig. 6(c)-(d).
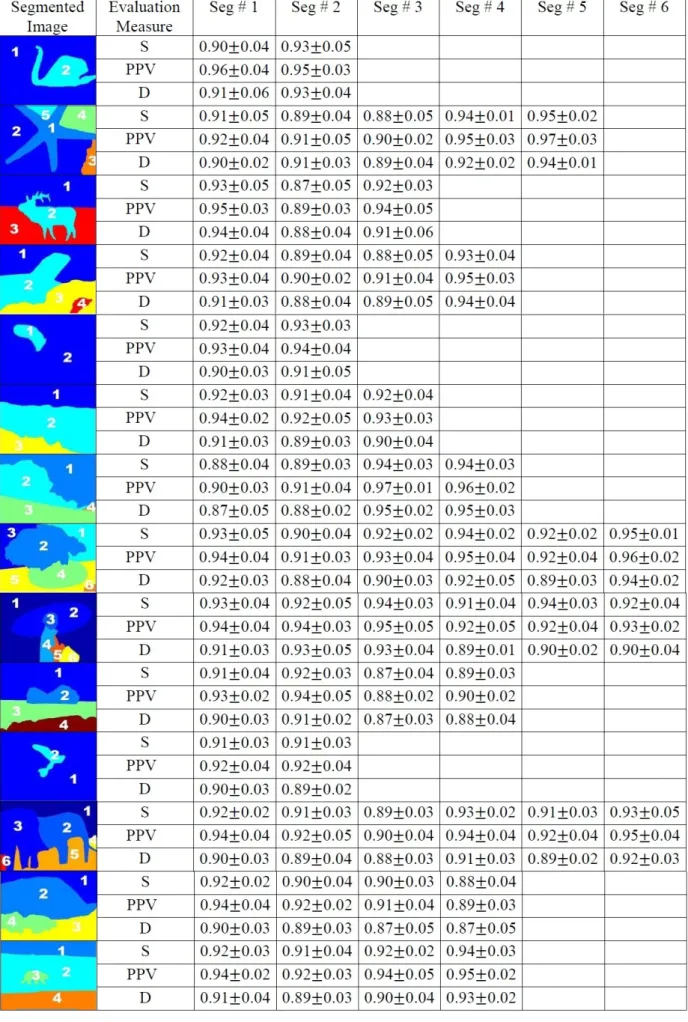
The sensitivity, PPV and Dice coefficient [23] for every segment is calculated for image segmentation results shown in Fig. 5. The segmented images are labeled in numbers as shown in Fig. 8. The mean value along with the standard de-viation (Mean±Std) for S, PPV and D is calculated for every segment in the segmented image using multiple manual
mentations as shown in Fig. 8. We can see that most of the evaluation measures range between 0.85 and 0.95 for S, PPV and D which shows a good segmentation.
6. Conclusion
In this work a new approach for image segmentation of gray scale, color and texture images using normalized graph cuts framework is proposed. A graph representing the mea-sure of likelihood between surrounding pixels is constructed using brightness, color and texture profiles of image at the same time (i.e., brightness and texture for gray scale images and color and texture for color images). A fuzzy rule based system provides the information how much a specific fea-ture is involved in image based on the nafea-ture of image. This graph is further used in normalized graph cuts framework to recursively partition the graph. The graph partitions obtained are then used to get the segmented image. Proposed algo-rithm is tested on the Berkeley segmentation database and is evaluated through probabilistic rand index, global con-sistency error, sensitivity, positive predictive value and Dice coefficient. Presented method provides effective results for most types of images.
References
[1] KRSTINIC, A., SKELIN, A. K., SLAPNIC, I. Fast two-step histogram-based image segmentation.IET Image Processing, 2011, vol. 5, no. 1, p. 63 - 72.
[2] HUANG, Y.-R., KUO, C.-M. Image segmentation using edge detec-tion and region distribudetec-tion. In3rdInternational Congress on Image
and Signal Processing. Yantai (China), 2010, vol. 3, p. 1410 - 1414. [3] PETROUDI, S., BRADY, M. Segmentation of colorectal pathology images using level sets. In9thInternational Conference on Informa-tion Technology and ApplicaInforma-tions in Biomedicine. Larnaca (Cyprus), 2009, p. 1 - 4.
[4] WANG, Z., YANG, M. A fast clustering algorithm in image seg-mentation. In2ndInternational Conference on Computer
Engineer-ing and Technology. Chengdu (China), 2010, vol. 6, p. 592 - 594. [5] ANEJA, K., LAGUZET, F., LACASSAGNE, L., MERIGOT, A.
Video-rate image segmentation by means of region splitting and merging. InIEEE International Conference on Signal and Image Processing Applications. Kuala Lumpur (Malaysia), 2009, p. 437 -442.
[6] ZHANG, X., SHAN, Y., WEI, W., ZHU, Z. An image segmentation method based on improved watershed algorithm. InInternational conference on Computational and Information Sciences. Chengdu (China), 2010, p. 258 - 261.
[7] LI, P., WANG, S., JING, J., ZHU, Z. The segmentation in textile printing image based on mean shift. In10thInternational
Confer-ence on Computer-Aided Industrial Design & Conceptual Design. Wenzhou (China), 2009, p. 1528 - 1532.
[8] LE, T. H., JUNG, S.-W., CHOI, K.-S., KO, S.-J. Image segmentation based on modified graph-cut algorithm.Electronics Letters, 2010, vol. 46, no. 16, p. 1121 - 1123.
[9] TAO, W., JIN, H., ZHANG, Y. Color image segmentation based on mean shift and normalized cuts.IEEE Transactions on Systems, Man, and Cybernetics, Part B: Cybernetics, 2007, vol. 37, no. 5, p. 1382 -1389.
[10] WANG, S., SISKIND, J. M. Image segmentation with ratio cut.IEEE Transactions on Pattern Analysis and Machine Intelligence, 2003, vol. 25, no. 6, p. 675 - 690.
[11] WANG, S., SISKIND, J. M. Image segmentation with minimum mean cut. InEighth IEEE International Conference on of Computer Vision. Vancouver (Canada), 2001, vol. 1, p. 517 - 524.
[12] SHI, J., MALIK, J. Normalized cuts and image segmentation. In 1997 IEEE CS Conference on Computer Vision and Pattern Recog-nition. San Juan (Puerto Rico), 1997, p. 731 - 737.
[13] SHI, J., MALIK, J. Normalized cuts and image segmentation.IEEE Transactions on Pattern Analysis and Machine Intelligence, 2000, vol. 22, no. 8, p. 888 - 905.
[14] KIM, J. S., HONG, K. S. Color-texture segmentation using unsuper-vised graph cuts.Pattern Recognition, 2009, vol. 42, no. 5, p. 735 -750.
[15] LI, X., FAN, H., ZHAO, Y., ZHANG, H. Graph cuts based im-age segmentation using local color and texture. In4thInternational
Congress on Image and Signal Processing (CISP). Shanghai (China), 2011, vol. 3, p. 1251 - 1255.
[16] TRAN, T., VO, P., LE, B. Combining color and texture for a ro-bust interactive segmentation algorithm.IEEE RIVF International Conference on Computing and Communication Technologies, Re-search, Innovation, and Vision for the Future (RIVF). Hanoi (Viet-nam), 2010, p. 1-4.
[17] KULKARNI, M., NICOLLS, F. Interactive image segmentation us-ing graph cuts.Twentieth Annual Symposium of the Pattern Recogni-tion AssociaRecogni-tion of South Africa. Stellenbosch (South Africa), 2009, p. 1 - 6.
[18] ERIKSSON, A. P., BARR, O., ASTROM, K. image segmentation us-ing minimal graph cuts. InSwedish Symposium on Image Analysis. Ume˚a (Sweden), 2006, p. 45 - 48.
[19] WANG, X.A Course in Fuzzy Systems and Control.Upper Saddle River (NJ, USA): Prentice Hall, 1997.
[20] MARTIN, D., FOWLKES, C., TAL, D., MALIK, J. A database of human segmented natural images and its application to evaluat-ing segmentation algorithms and measurevaluat-ing ecological statistics. In 8thIEEE International Conference on Computer Vision. Vancouver
(Canada), 2001, p. 416 - 423.
[21] UNNIKRISHNAN, R., PANTOFARU, C., HEBERT, M. A measure for objective evaluation of image segmentation algorithms. InIEEE International Conference on Computer Vision and Pattern Recogni-tion. San Diego (CA, USA), 2005, vol. 3, p. 34 - 41.
[22] MARTIN, D.An Empirical Approach to Grouping and Segmenta-tion,Ph.D. dissertation. Berkeley (CA, USA): U. C. Berkeley, 2000.
[23] ZOU, K. H., WARFIELD, S. K., BHARATHA, A., TEMPANY, C. M. C., KAUS, M. R., HAKER, S. J., WELLS, W. M., JOLESZ, F. A., KIKINIS, R. Statistical validation of image segmentation quality based on a spatial overlap index.Academic Radiology, 2004, vol. 11, no. 2, p. 178 - 189.
[24] JULESZ, B. Textons, the elements of texture perception, and their interactions.Nature, 1981, vol. 290, no. 5802, p. 91 - 97.
[25] RAND, W. M. Objective criteria for the evaluation of clustering methods. J. Amer. Stat. Assoc., 1971, p. 846 - 850.
![Fig. 4. (a)-(f) Original images. (g)-(l) Segmentation using proposed method. (m)-(r) Segmentation using generic normalized graph cuts method [12], [13] considering individual image feature (i.e., brightness W b and color W c for gray scale and color images](https://thumb-us.123doks.com/thumbv2/123dok_us/365227.2540222/6.892.105.809.128.637/original-segmentation-proposed-segmentation-normalized-considering-individual-brightness.webp)