CVSscan: Visualization of Code Evolution
Lucian Voinea
Technische Universiteit Eindhoven
Wiskunde & Informatica
PO Box 513, 5600 MB Eindhoven
+31-402472480
Alex Telea
Technische Universiteit Eindhoven
Wiskunde & Informatica
PO Box 513, 5600 MB Eindhoven
+31-402475008
Jarke J. van Wijk
Technische Universiteit Eindhoven
Wiskunde & Informatica
PO Box 513, 5600 MB Eindhoven
+31-402474579
ABSTRACT
During the life cycle of a software system, the source code is changed many times. We study how developers can be enabled to get insight in these changes, in order to understand the status, history and structure better, as well as for instance the roles played by various contributors. We present CVSscan, an integrated multiview environment for this. Central is a line-oriented display of the changing code, where each version is represented by a column, and where the horizontal direction is used for time, Separate linked displays show various metrics, as well as the source code itself. A large variety of options is provided to visualize a number of different aspects. Informal user studies demonstrate the efficiency of this approach for real world use cases.
Categories and Subject Descriptors
D.2.2[Software Engineering]: Design Tools and Techniques; D.2.7[Software Engineering]: Maintenance, Enhancement;
H.5.2[User Interfaces]: Evaluation, Methodology;
General Terms
Management, Documentation, Design, Experimentation.
Keywords
Software evolution, Software visualization.
1. INTRODUCTION
Since its beginning, software visualization has proved to be an efficient tool for supporting the software engineering process. The ever-increasing complexity of software systems together with the advent of lightweight development methodologies, such as extreme programming [1], tends to shift development costs from early stages, such as architecture and design, towards later stages, such as maintenance. Industry surveys show that, in the last decade, maintenance and evolution exceeded 90% of the total software development costs [6], a problem referred to as the
legacy crisis [14]. This challenge is addressed on two fronts. The
preventive approach tries to improve the reliability of a system at design time. Many visual tools and techniques exist to improve the expressiveness of UML and visually assess design-time quality attributes [5], [9]. The corrective approach aims to facilitate the maintenance phase, and is supported by program and process understanding and fault localization tools, e.g. SeeSoft [4] AspectBrowser [8], or Tarantula [10]. With over 250 billion code lines in maintenance in 2000 [16] we position our work in this second area of interest.
Program and process understanding is an important aspect of software maintenance. Current industrial projects are often based on collaborative development of millions of code lines. Industry practice studies have shown that maintainers spend 50% of their time on understanding this code [17]. Many software visualization tools have been designed to help revealing the structure of software systems starting from the source code (e.g. [4], [18], [19], [20]). Most of such tools focus on visualizing high-level system abstraction, such as classes, modules, and packages, usually extracted from source code in a reverse engineering process. However, these tools do not show lower-level system changes, such as the many, minute source code edits done during debugging. Moreover, the focus is on a fixed system structural view that does not show all changes the code has undergone in time. Various graph drawing techniques, such as the one proposed by Collberg et al. [2], tried to overcome this limitation by showing the temporal dimension of software structures and mechanisms evolution. However, their still to be validated approach does not seem to scale well on real-life data sets. At the other end of the granularity spectrum, the SeeSoft tool of Eick et al. [4] uses a line-based approach: Source files are seen as a set of code lines, each of which is drawn as a pixel line. This allows visualizing many thousands of lines on a single screen. Several similar techniques and tools have been proposed (Aspect Browser [8], Bee / Hive [13], sv3D [12], Augur [7]). While these approaches succeed in revealing structure and change dependencies between code fragments, they only offer snapshots in time, and do not reveal changes in the global context of an entire project life span.
In this paper, we propose a new technique for visualizing the evolution of line-based software structures, semantics and attributes using space-filling displays. We use dense pixel displays to show the overall evolution, and integrate them in an orchestrated environment of correlated views to offer details-on-demand. We also introduce a novel concept, the bi-level code display that gives a detailed, yet intuitive, view of both the contents of a code fragment and its evolution in time. We validate our approach by analyzing the evolution of files spanning
thousands of lines along tens of versions, using data from real-life, industry-size CVS repositories.
The structure of this paper is as follows. In Section 2, we briefly review line-based visualization tools for software evolution and their challenges. In Section 3, we introduce CVSscan, a tool we developed to test and validate the visualization techniques we propose. Section 4 presents results of two case studies we performed. These studies show how our approach can be successfully used to investigate the evolution of files from real life software projects. Section 5 summarizes the novel contribution we bring to software evolution visualization and outlines future directions of research.
2. RELATED WORK
We define the challenge of line-based software-evolution visualization using the five dimensions proposed by Maletic et al. [11]: task, audience, target, medium, and representation. The main
task is to gain insight in the structure and operation of a software system by studying the evolution of changes in its source code organization, semantics and attributes. The intended audience is mainly composed of developers and maintainers. These usually face software in the late stages of its development process, and need to get an understanding of it, often with no other support than the code itself. However, our audience includes other roles too, as follows: Project managers can get an overview of source code producing activities, testers can identify the regression tests required at system change, new team members can get familiar with the software and set-up their social network based on relevant technical issues, and eventually architects can identify subsystems needing redesign. The target of line-based software-evolution visualization is the collection of source code files maintained by version control management (VCM) systems, such as CVS, Subversion, or Microsoft’s SourceSafe. Such systems maintain an archive of all intermediate versions of files and give, thus, access to a line-based history of changes. The intended
medium for visualization is the standard PC graphics display used for most software development environments. Finally, the
representation is formed by line-oriented, dense-pixel displays. Line-based software visualization has been addressed in a number of tools. SeeSoft, already introduced in Section 1, is the first tool we are aware of that proposes a direct code line-to-pixel line visual mapping [4]. Color is used to show code fragments that correspond to a given modification request. The Aspect Browser [8] uses regular expressions to locate specific artifacts (e.g. key words) and then it visualizes their distribution. Tarantula [10] uses color and a line-oriented display to represent the degree of success with witch a fragment of code passed a number of tests. Bee/Hive [13] and sv3D [12] use a 3D line-based code display. The z axis shows additional attributes (Bee/Hive) or is used to pack the line-based visualization more compactly (sv3D). Augur [7], a recent effort in the area, combines within one visual frame information about both artifacts and the activities of a software project at a given moment. Finally, UNIX’s gdiff and its Windows version WinDiff visualize code differences between two versions of a given file by depicting the line insertions, deletions, and modifications, as computed by the diff utility. However efficient for comparing pairs of files, these tools cannot deal with real-life file evolutions that often have hundreds of versions.
The above tools are successful in revealing the line-based structure of software systems, and uncover change dependencies at given moments in time. However, they do not provide insight into the code attributes and structure changes made throughout an
entire project duration. The approach we present here attempts to give a detailed overview of such an evolution in the context of source code maintained in a VCM system. In the next session, we detail our approach, and we introduce CVSscan, a tool we developed to validate the proposed visualization techniques.
3. METHODS AND TOOL DESCRIPTION
CVSscan is a visual tool we developed to support the program and process understanding for the maintenance of large software projects. Similarly to other line-based software visualization tools, CVSscan builds on the assumption that developers are comfortable with visualizations that present the code in the same spatial context in which they construct, i.e. write it [4]. Since software maintenance is mainly done at code level, we decided to use a line-based approach to visualize the software. In order to understand the software, developers can benefit from additional information regarding its evolution, such as time and authors of code changes. Such information facilitates team communication in collaborative projects, and also places investigations in the context of an entire project evolution, such as discovering that problems in a specific part of the code appear after another part was changed. Such insight is easier to get when visualizing the context of an entire project evolution. In contrast, intensive debugging and runtime analysis is needed to get it from a single code snapshot. Hence, we visualize in CVSscan the evolution of source-code structure and attributes across an entire project life span. Typical questions we try to answer with this are:- What code lines were added, removed, or altered and when? - Who performed these modifications of the code?
- Which parts of the code are unstable? - How are changes correlated?
- How are the development tasks distributed?
- What is the context in which a piece of code appeared?
We next detail the structure of the data we visualize (Section 3.1) and the visual mappings used to display it in our tool (Section 3.2).
3.1 Data Model
Our data comes from the CVS version control management (VCM) system. To decouple CVS from the visualization itself, data extraction is done by a separate tool: CVSgrab (Figure 1). In this way one can use our visualization tool with any VCM, once a suitable data extractor is implemented. The central element of a VCM system is a repository that stores all versions of a given file. A repository
R
is a set ofNF
files:{
F
i
NF
}
R
=
i=
1
..
Each fileF
iis defined as a set ofNV
iversions:{
ji i}
i
V
v
NV
version control management
system
data extractor visualization
CVSG
rab
CVSsc
an
CVS
Figure 1: Software-evolution visualization tool chain
Each version is a tuple containing the unique ID of the version, the author that contributed (committed) it to the repository, the time when it was committed, and its source code:
code
date
author
id
V
j,i=
,
,
,
Our visualizations will consider the files
F
iseparately, so we drop the file index in the following. To compare the source code)
(
V
jcode
andcode
(
V
j+1)
of two consecutive versionsV
j andV
j+1, we use a tool like UNIX’s diff, which reports the inserted and deleted lines inV
j+1with respect toV
j. All lines not deleted or inserted inV
j+1are defined as constant (not modified). Finally, lines reported to be both deleted and inserted in some version are defined as modified (edited). We denote by li the ithline of the version we talk about in some given context. Using diff, we can also find which lines in
V
j+1match constant (or modified) lines inV
j. For one such line, we call the complete set of matching occurrences in all versions (i.e. the transitive closure of the above match relation) a global line l. For every li,L
(
l
i)
denotes the global line associated with li. From these data, webuild several functional characterizations for the source code evolution at line level. The most important is the global line position:
( )
j
l
N
N
N
G
,
i:
×
→
We can explain
G
(
j
,
l
i)
by a graph analogy. For every global line l, we build a graph nodeN
(l
)
. Nodes are created by scanning versionsV
jin increasing order of j, and lines li in eachversion in increasing order of i. If lines li and li+1 are consecutive
in a given version, we set a directed arc from
))
(
(
L
l
iN
toN
(
L
(
l
i+1))
. Finally, when a nodeN
is inserted between two other nodesN
A andN
B, we set an arc from any already existing node betweenN
A andN
B toN
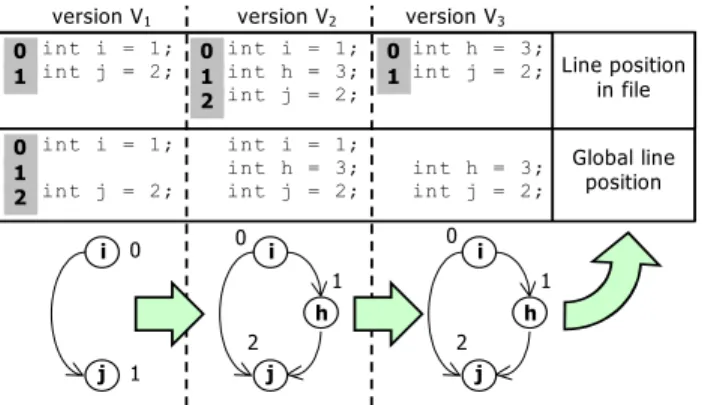
. Figure 2 shows three versions of a file and their corresponding graph. This graph is directed and acyclic, and gives a total order relation between all code lines. The node corresponding to the global linel before which no other line existed during the whole project is the only one having only outgoing arcs.
int i = 1; int h = 3; int j = 2; int h = 3; int j = 2; int i = 1; int j = 2; int i = 1; int h = 3;
int j = 2; int h = 3; int j = 2;
int i = 1; int j = 2; 0 1 2 0 1 0 1 2 0 1
version V1 version V2 version V3
i j j h i j h i Global line position Line position in file 0 1 0 1 2 0 1 2
Figure 2 Global line position and corresponding graph analogy
We label this ‘start node’ (e.g. node “i” in Figure 2) with zero and all other nodes with the maximal path length (defined as number of arcs) to the start node, e.g. by doing a topological sort of the graph (see [3]). We obtain then, for every line li in every
version
V
j, thatG
( )
j
,
l
i=
label
(
N
(
l
))
, wherel
=
L
(
l
i)
. This gives a unique label to all code lines written during development, keeps the partial line orders implied by the different versions in the project, and ensures that lines in different versions identified by diff as instances of the same global line have the same label.Next, we introduce the line status
( )
j
i
N
N
STATES
S
,
:
×
→
which characterizes the global position i in version
V
j.S
is computed by comparing the current line lC at global position i inversion
V
jwith the lines lP and lN having the same global position i in the previous and next versionsV
j−1 andV
j+1 respectively. The status can be one of the following:constant: lP exists in
V
j−1and is identical with lCmodified: lP exists in
V
j−1or lN exists inV
j+1, but differs from lC deleted: lP exists inV
j−1and lC does not exist inV
jor)
,
1
(
j
i
S
−
= deleted.inserted: lN exists in
V
j+1and lC does not exist inV
jor)
,
1
(
j
i
S
+
= insertedmodified by deletion: lC is modified, and
S
(
j
,
i
+
1
)
= deletedOR modified by deletion
modified by insertion: lN is modified, and
S
(
j
,
i
+
1
)
= insertedOR modified by insertion
Further information can be extracted from the source code. CVSscan uses a fuzzy parser with a customizable grammar to
extract information such as blocks, comments, preprocessor macros, and so on. This produces the construct attribute
( )
j
l
N
N
Grammar
C
,
i:
×
→
which describes, for every line li in every version
V
j, thegrammar construct that line belongs to. We use this information to visualize the structure of a given version (Section 3.2.1).
We next present the techniques we used to map these characterizations to visual elements.
3.2 Visual Mapping
Our main focus is to allow the user to easily perform his investigations by minimizing the cognitive overhead of multiple representations for the same data. For this, CVSscan uses a single-screen display of a file’s entire evolution.
3.2.1 Dimensions
Similarly to previous line-based software representations ([4], [8], [7]), we represent every line of code as a pixel line on the screen. For CVSscan, we took the decision to use a 2D representation. Our need to visualize many attributes together may first suggest using a 3D view. However, we chose for 2D in order to have a simple user interface, no occlusion problems, and a visual layout perceived as simple for code developers. The main questions we next had to answer were how to layout the line representations in a plane, and how to use color for encoding attributes.
Our layout approach is different in two main aspects from previous line-based layouts. First, we do not use indentation and line length to suggest code structure, but use a fixed-length pixel line for all code lines and color to encode structure (Figure 3).
a) b)
Figure 3: Line layout a) SeeSoft b) CVSscan
Secondly, we visualize on the same screen all versions that a file has during its evolution, instead of all files in a project at a given time (Figure 4). The horizontal axis represents thus evolution in time and the vertical one the line position li. Each version is
shown as a vertical stripe composed of horizontal pixel bars depicting lines of code (Figure 3). Finally, while other tools use line color to represent only one data attribute (e.g. line age in [4],[7]), we use it to encode the author, construct, and line status
attributes defined in Section 3.1 (Figure 5). Overall, our approach trades revealing the length of code lines off for offering a space-efficient filling to show files and their structure. This allows us to visualize more source code on the same screen.
Secondly, we focus on one file at a time, in order to deliver comprehensive view of its evolution, enabling users to make correlations between modifications in time.
For the vertical layout of lines within one version strip, we propose two approaches.
a) b)
File A File B
V1 V2 V3 V4 V5 File A
Line position in file
Time
Line position in file Project files
Figure 4: Use of horizontal axis in line-based visualizations a) files, in SeeSoft b) time, in CVSscan
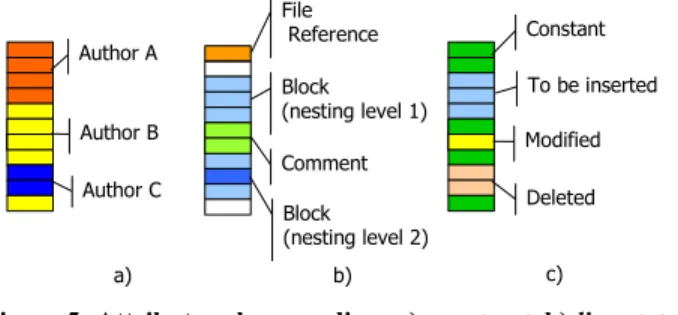
a) Comment File Reference Block (nesting level 1) Block (nesting level 2) Modified Constant To be inserted Deleted b) Author A Author B Author C c)
Figure 5: Attribute color encoding: a) construct; b) line status;
c) author
The first one, called file-based layout, uses as y coordinate the local line position li (Figure 6.a). This layout offers an intuitive
‘classical’ view on file organization and size evolution, similar to [4].
The second approach, called line-based layout, uses as y
coordinate the global line position
G
( )
j
,
l
i (Figure 6.b). While this preserves the order of lines of the same version, it introduces empty spaces where lines have been previously deleted or will be inserted in a future version. In this layout, each global line l has a fixed y position throughout the whole visualization. This allows easy identification of code blocks that stay constant in time, or get inserted or deleted.To show various attributes, CVSscan offers alternate color encodings of the author, construct and line status functional characterizations of a version. We use a fixed set of perceptually different colors to encode the authors (Figure 5a). For constructs (i.e. blocks, comments and references) we use a customizable color map, and modulate luminance to encode the block nesting level (Figure 5b). Finally, we use a customizable color map to indicate the status of lines in a given version (Figure 5c). At each moment, one color scheme is active, such that the user can study the time evolution of its corresponding data attribute. When interesting patterns are spotted, one can switch to another scheme to get more detailed insight in the matter.
a) Deleted lines Lines to be inserted b)
Constant line New lines
Legend
Local Line Position Discrete time (versions)
Global Line Position Discrete time (versions)
Figure 6: Line layout in CVSscan: a) file-based b) line-based
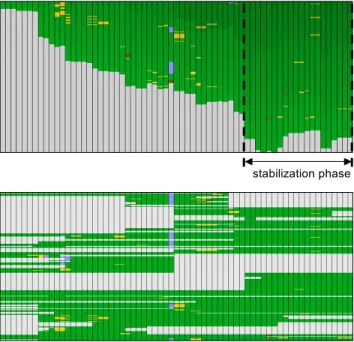
Figure 7 shows the CVSscan visualization of a file evolution through 65 versions. Color encodes line status: green denotes constant, yellow modified, red modified by deletion, and light blue modified by insertion respectively. Additionally, in the line-based layout (bottom), light gray shows inserted and deleted lines. The file-based layout (top) clearly shows the file size evolution and allows spotting the stabilization phase occurring in the last third of the project. Here, the file size has a small decrease corresponding to code cleanup, followed by a relatively stable evolution corresponding to testing and debugging. Yellow fragments correspond to areas that need reworking during the debugging phase.
stabilization phase
Figure 7: Line status visualization. File-based (top) and line-based (bottom) layouts
Figure 8 illustrates different color encodings on a zoom-in of the line-based layout in Figure 7 (bottom). In Figure 8.a, we use yellow to encode lines that suffer modifications when passing from one version to another, as shown in the highlight. Since the modification relation is symmetric (see Section 3.1), yellow lines always appear in pairs. Switching to the color scheme that encodes the construct attribute (Figure 8.b) enables the user to discover that the modified piece of code is in a comment, encoded by the dark green color. This means the modification does not actually alter the code functionality. Finally, the author attribute (Figure 8.c) shows the developer that performed the modification, e.g. the purple one in our highlight.
a) b) c)
Figure 8: Attribute encoding: a) line status; b) construct;
c) author
3.2.2 Multiple Views
A key factor in understanding the patterns revealed by evolution visualization is to correlate them with other information about the program. Besides the line-based visualization of code evolution we presented so far, CVSscan offers two additional metric views and a novel text view on selected code fragments (Figure 9).
code view metric view metric view
Figure 9: Multiple code views in CVSscan
The metric views encode per-version and per-global-line data and show these with vertical, respectively horizontal color bars to complement the evolution visualization. Different metrics are available. For example, two proposed horizontal metrics show, for each version, its number of lines or its author (Figure 10). A useful vertical metric shows the lifetime of a code line for a given global line position.
Discrete time
(versions) a)
b) Discrete time (versions)
Figure 10: Metric views: a) version size; b) version author
The code view offers a text look at the code. Users can select the code to be displayed by sweeping the mouse in the evolution view. Vertical brushing in the code evolution area scrolls through a version’s code, whereas horizontal brushing over the line-based layout (Section 3.2.1) goes through a given line’s evolution. An important issue we address in the design of CVSscan is how to correlate the code and evolution views, when the latter uses the line-based layout. The question is what to display when the user
brushes over an empty space in the evolution view. This space corresponds to deleted or inserted line status values, i.e. the code at the mouse position was deleted in a previous version or will be inserted in a future version (see e.g. the light gray areas in Figure 7). Freezing the code display would create a sensation of scrolling disruption, as the mouse moves but the text doesn’t change. Displaying code from a different version that the one specified by the mouse position, would have a negative impact on the context. We solve this problem by a new type of code display. We use two text layers to display the code around the brushed global line position both from the version under the mouse and from versions in which this position does not refer to an empty space (Figure 11). evolution view mouse position Layer A Layer B
Figure 11: Two-layered code view
While the first layer (A) freezes when the user brushes over an empty region in the evolution view, the second layer (B) pops-up, and scrolls through the code that has been deleted, or will be later inserted at the mouse location. This creates a smooth feeling of scrolling continuity during brushing. In the same time, it preserves the context of the selected version (layer A) and gives also a detailed, text level peek, at the code evolution (layer B). The three motions (mouse, layer A scroll, layer B scroll) are shown also by the figures 1, 2, and 3 in Figure 14.
2 1 first version last version lifetime
of line 1 of line 2 lifetime
Figure 12: Code view, layer B. Line 1 is deleted before line 2 appears (i.e. they do not coexist)
We must now consider how to assess the code evolution shown by layer B. The problem is that lines of code located at consecutive global positions might not coexist in the same version. In other words, layer B consecutively displays code lines that may not belong to one single version. We need a way to correlate this code with the evolution view. We achieve this by showing the lines’ lifetimes as dark background areas in layer B (Figure 12). Finally, we indicate the author of each line by colored bars near the vertical borders of the code view (Figure
11). Summarizing, the code view offers a detailed look on a specific global position in a selected version, including information about its evolution and the developers that make it happen.
3.2.3 Visual Improvements
Real life software projects contain large files of thousands of lines. The resolution of commodity graphic displays is not sufficient to fit the entire file evolution on one screen, unless more lines share the same physical screen pixels. This raises the question how to represent code lines that share pixels such that the user gets a consistent, comprehensible and complete image of the file evolution.
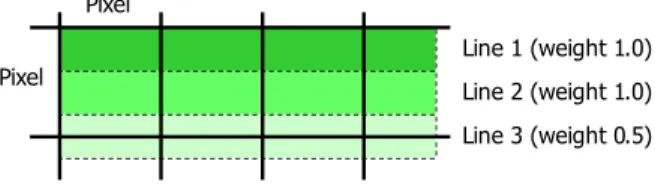
We address this issue in CVSscan by a position-based antialiasing algorithm. Antialiasing is used when the total number of lines to be displayed is larger than the available resolution. The algorithm computes the screen color of a number of overlapping lines by averaging their colors and weighting them according to their degree of overlap. That is, lines that fit inside one pixel location have a full weight, and lines that spread on more locations have a weight that equals the line percentage covered by the pixel location (Figure 13). Line 1 (weight 1.0) Line 2 (weight 1.0) Line 3 (weight 0.5) Pixel Pixel
Figure 13: CVSscan antialiasing algorithm
An alternative would be to compute the line weight based on attribute values. While this would help emphasizing lines based on their attributes, it may introduce structure inconsistencies when using different display magnification levels, so more research is needed to find out whether and/or how well this alternative would work.
3.3 User Interaction
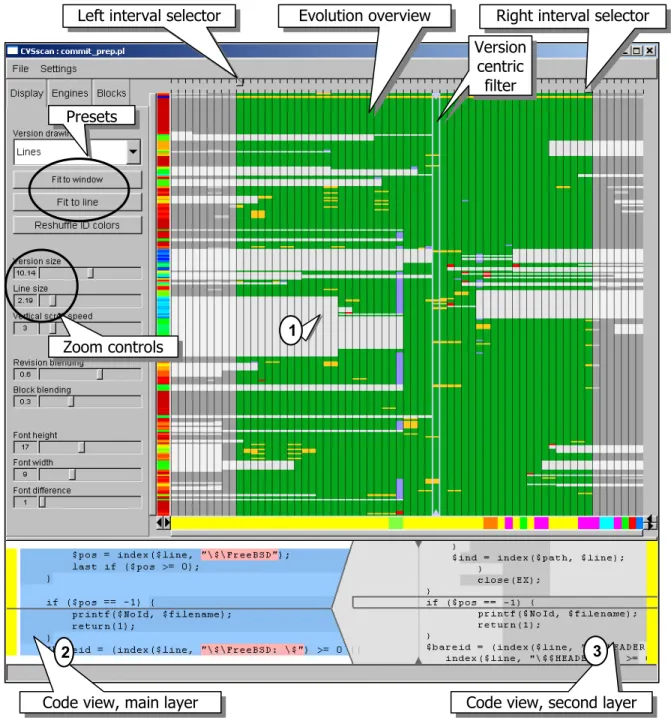
In addition to the visualization techniques described in Section 3.2, CVSscan offers a wide range of interaction means to facilitate the navigation of data. We describe below, using Shneiderman’s perspective [15], the repertoire of interactive exploration instruments we provide. All instruments are designed to use a point-and-click approach, making the entire exploration possible only by the use of a mouse. A tool snapshot illustrating these mechanisms is shown in Figure 14.
As explained so far, CVSscan offers an intuitive overview on the evolution of a program file in a single 2D image, even for files whose number of lines exceeds the available screen resolution (Section 3.2.3). To get more detailed insight in a specific region of the evolution, CVSscan offers zoom and panning facilities. This enables the user to drill down to more detailed representations, in which the evolution of each line of code may be assessed. The tool offers also two preset zoom levels that act as shortcuts to the global overview (fit all code to window size) and to the one-pixel-per-code-line level.
In order to support the file evolution analysis from the perspective of one given version, CVSscan offers a filtering mechanism by means of which all lines that are not relevant are removed from the visualization, i.e. lines that will be inserted after the selected
version, or lines that have been deleted before the selected version. Filtering enables the user to assess a version, selected by clicking on it, by clearly identifying its lines that are not useful and will be eventually deleted, and the lines that have been inserted into it since the beginning of the project. In other words, filtering provides a version-centric visualization of code evolution. Additionally, the tool gives the possibility to extract
and select only a desired interval to study the file evolution. This mechanism is controlled by two sliders (shown in Figure 14, top) similar to the page margin selectors in word processors. By choosing the starting and finishing version, one can remove from visualization the code that is not relevant, i.e. code deleted before the starting version, or code inserted after the finishing one. This
mechanism proved to be useful in projects with a long lifetime (e.g. over 50 versions) in which one usually identifies distinct evolution phases that should be analyzed separately.
CVSscan enables the user to correlate information about the software evolution with specific details of the source code and overall statistic information. By means of metric views, users can visually get statistic information about lines, e.g. the lifetime of a line at a given global position, or versions, e.g. a version’s author or size. The bi-level code view (Section 3.2.2) offers details-on-demand about a code fragment: the text body, the line authors and the text evolution. The user can select the fragment of interest by simply brushing the file evolution area.
Version
centric
filter
Presets
Zoom controls
Code view, main layer
Right interval selector
Code view, second layer
Left interval selector
Evolution overview
1
2
3
Although CVSscan is an exploration tool that does not alter the data it visualizes, it maintains a collection of state variables that may be externalized. This enables the user to keep a history of his actions and let him recover and reuse a specific visualization setting at a later time. In this direction, a simple extension that our users suggested so far was to add an annotation facility by which developers can add their own comments, and visualize added comments, to a given version or line position.
In the following section we present the results of two informal studies that show how the interaction mechanisms presented above and the visualization techniques described in Section 3.2 can be successfully used to investigate the evolution of files from real life software systems.
4. USE-CASES AND VALIDATION
The main target audience of the CVSscan tool is the maintenance community. They perform their tasks outside the primary development context of a project, and most of the times long after the initial development has ended. Therefore, the main activities a maintainer performs are related to context recovery, such as program understanding and team network building. CVSscan facilitates this process by visualizing file evolution from the perspective of different attributes and features, such as file structure, modifications, and authors.
In order to validate the visualization techniques and methods in CVSscan, we organized a number of informal studies. The aim was to record and analyze the experiences of software maintainers when they investigate completely new programs, i.e. programs of whose development they did not participate to, with no other support than CVSscan itself. We present below the outcome of two such studies of the larger set we organized. In both cases, the users participated first in a 15 minutes training session. During the session, the tool’s functionality was demonstrated on a particular example file. After that, each user was given a file for analysis, but no information about its contents whatsoever. A silent observer recorded both user actions and findings.
Case study 1: analysis of a Perl script file
In the first case, the user was given a script file from the FreeBSD distribution of Linux, containing 457 global line positions and spanning 65 versions. The user was familiar with scripting languages, but had no advanced knowledge about any of them. The user started CVSscan using the default file-based layout to visualize the evolution of file structure.
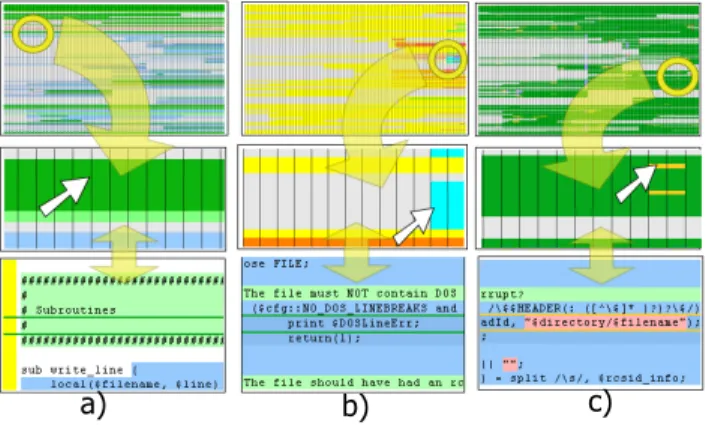
a) b) c)
Figure 15: Case study 1 - Analysis of a Perl script
The user brushed first over the green areas in the evolution view: “These are comments, right? Let’s see first what they say”. He started to brush from the beginning of the file, choosing first the comments that spanned over the entire evolution. In the same time he read the code fragments displayed in the code view.
“This is Perl. All Perl scripts have this path on the first line. This one looks like a file description. It reads that this script handles pre commits of files…“
Then while brushing over the comment fragments (Figure 15.a top
→
bottom ):“These are annotated textual dividers: Configurable options, Constants, Error messages, Subroutines, Main body. I use these too in my programs… Here are also some annotations…”
Further on, the user investigated also the large comment fragments that did not span over the whole evolution:
“It looks like the implementation was either not completed or the developers left a lot of garbage. There are some code fragments over here that are commented out.”
The user next selected the last version and brushed over the Subroutines area
“It looks like these lines do not belong to any block. Here is a blank line before the write_line procedure. Here a blank line before exclude_file. So there are white lines before every procedure? Yes, indeed: check_version, fix_up_file. So there are four procedures. It seems exclude_file is the most complex one as it has the highest nesting level”
At this point, the user had a high-level understanding of the file structure. He started to make inquiries about the developers that had worked on the file. For that, he switched back and forth between the construct and author attributes using shortcut buttons:
“The yellow developer, Dawes, did most of the work. However, the orange one, Robin, wrote that complex exclude_file procedure. He did that towards the end of the project, so probably that adds some extra functionality to the core. I see also that the cyan developer, Eich, did some significant work towards the end in the check_version procedure (Figure 15.b top
→
bottom). It seems that his concern was to rule out files containing DOS line breaks... So this script doesn’t handle DOS files?” The user then dismissed the authors that had only small contributions and switched to the line status visualization:“Apparently a major change took place in the middle of the project. It mainly affected the check_version procedure”. Then, selecting the version that followed the modified by insertion
lines of the major change, the user started to concentrate on the areas where modifications took place:
“I see a number of modifications between these two versions (Figure 15.c top
→
bottom). The first one replaces a file reference with a fully qualified name; the second does the same, the third too, the fourth, the fifth. Oh, they should have kept that file name in a separate variable!““Here they tuned the regular expressions”
The user continued to brush all areas where modifications appeared and tried to correlate them with the code and the authors that committed them. We interrupted the experiment after 15 minutes. At the end of the exercise, the user was familiar with the overall organization of the file, the focus of each individual contributor, the places that had gone through important modifications and what this modifications referred to.
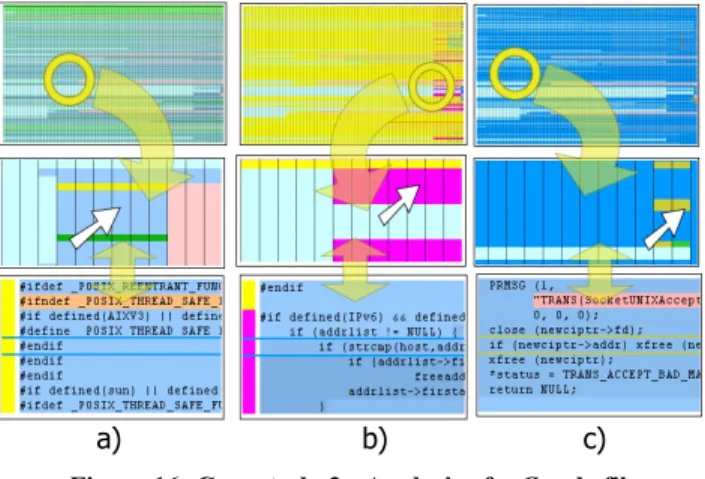
Case study 2: analysis of a C code file
In the second case, an experienced C developer was asked to analyze a file containing the socket implementation of the X Transport service layer in the FreeBSD distribution of Linux. The file had 2900 global line positions and spanned across 60 versions. We provided the user with a CVSscan version able to highlight C grammar constructs, such as #define, #ifndef, etc (see Section 3.1).
The second user started the tool in the default mode too, and tried first to look for commented fragments: “This is the copyright header, pretty standard. It says this is the implementation of the X Transport protocol, pretty heavy stuff… It seems they explain in this comments the implementation procedure…”
The user next switched his attention to the compiler directives: “A lot of compiler directives. Quite complex code, this is supposed to be portable on a lot of platforms. Oh, even Windows“.
Next, the user started to evaluate the inserted and deleted blocks: “This file was clearly not written from scratch, most of its contents has been in there since the first version. Must be some legacy code… I see major additions done in the beginning of the project that have been removed soon after that… They tried to alter some function calls for Posix thread safe functions (Figure 16.a top
→
bottom)… I see major additions also towards the end of the project… A high nesting level, could be something complex… It looks like code required to support IPv6. I wonder who did that?”a) b) c)
Figure 16: Case study 2 - Analysis of a C code file
The user switched then to the author visualization:
“It seems the purple use, Tsi, did that (Figure 16.b top
→
bottom). But a large part of his code was replaced in the final version by… Daniel. This guy committed a lot in the final version... And everything seems to be required to support Ipv6. The green user, Eich, had some contribution too… well, he mainly prints error messages.”Eventually, the user switched to the evolution of line status and used the predefined “Fit to line” setting to zoom in.
“Indeed, most work was done at the end… Still, I see some major changes in the beginning throughout the file... Ah, they changed the memory manager. They stepped to one specific to the X environment I assume. All memory management calls are now preceded by x (Figure 16.c top
→
bottom)… And here they seem to have given up the TRANS macro”.The user spent the rest of the exercise assessing the modifications and the authors that committed them. We interrupted the experiment after 15 minutes. At the end, the user did not have a very clear image of the file’s evolution. However, he concluded that the file represented a piece of legacy code adapted by mainly two users to support the IPv6 network protocol. He also pointed out a major modification: the change of the memory manager.
5. CONCLUSIONS
In this paper, we present a new approach for the visualization of software evolution using line-oriented displays, and we introduce CVSscan, a tool we developed to validate the proposed techniques. The main audience we target with our work is the software maintenance community. The goal is to provide them with support for program and process understanding.
Our novel approach uses multiple correlated views on the evolution of a software project. We use dense pixel displays to show the overall evolution of code structure, semantics and attributes, and we integrate them in an orchestrated environment to offer details-on-demand. We also introduce a novel type of code text display that gives a detailed, yet intuitive, view on both the composition of a fragment of code and its evolution in time. We also present in this paper the typical outcome of a number of user studies we did to validate our approach on data from real-life CVS repositories. Although informal, the studies show that the line-based evolution visualization of code supports a quick assessment of the important activities and artifacts produced during development, even for users that had not taken part in any way in developing the examined code. Our tool and datasets used in the two discussed case studies are available for download at
http://www.win.tue.nl/~lvoinea/soft/CVSscan_setup.exe.
So far, we only focused on the evolution of individual files. As future direction of research, we would like to extend our approach with higher-level overviews, such as whole-project evolution visualizations, to enable evolution analyses on entire systems. Finally, our aim is to integrate CVSscan in a toolset for code visualization and analysis in order to make it effectively and efficiently available to the software development process.
6. ACKNOWLEDGEMENTS
This research was part of the ITEA project Space4U, whose aim is to define a component based framework for the middleware layer of high volume embedded appliances (http://www.win.tue.nl/space4u)
7. REFERENCES
[1] Beck, K., Andres, C., Extreme Programming Explained: Embrace Change (2nd Edition), Addison-Wesley, 2004
[2] Collberg, C., Kobourov, S., Nagra, J., Pitts, J., Wampler, K. A System for Graph-Based Visualization of the Evolution of
Software, Proc. ACM SoftVis ‘03, ACM Press, NY, USA, 2003, 77 – 86.
[3] Cormen, T, Leiserson, C., Rivest, R., Introduction to Algorithms, 16th edition, MIT Press, 1996.
[4] Eick, S. G., Steffen, J. L., Sumner, E. E. SeeSoft --A Tool for Visualizing Line Oriented Software Statistics. IEEE Trans. on Software Engineering, 18(11),1992, 957 – 968. [5] Eiglsperger, M., Kaufmann, M., Siebenhaller, M. A
Topology-Shape-Metrics Approach for the Automatic Layout of UML Class Diagrams. In Proc. ACM SoftViz ‘03, ACM Press, NY, USA, 2003,189 – 198.
[6] Erlikh, L. Leveraging Legacy System Dollars for E-business. (IEEE) IT Pro, May-June 2000, 17 – 23.
[7] Froehlich, J., Dourish, P. Unifying Artifacts and Activities in a Visual Tool for Distributed Software Development Teams. In Proc. ICSE ‘04, IEEE CS Press, Washington DC, USA, 2004, 387 – 396.
[8] Griswold, W.G., Yuan, J.J., Kato, Y. Exploiting the Map Metaphor in a Tool for Software Evolution. Proc. ICSE ‘01, IEEE CS Press, Washington DC, USA, 2001, 265 – 274. [9] Gutwenger, C., Junger, M., Klein, K., Kupke, J., Leipert, S.,
Mutzel, P. A New Approach for Visualizing UML Class Diagrams, Proc. ACM SoftViz ‘03, ACM Press, NY, USA, 2003,179 – 188.
[10] Jones, J.A., Harrold, M.J., Stasko, J. Visualization of Test Information to Assist Fault Localization. Proc. ICSE ‘02, ACM Press, NY, USA, 2002, 467 – 477.
[11] Maletic, J.I., Marcus, A., Collard, M.L. A Task Oriented View of Software Visualization. Proc. IEEE VISSOFT ’02, IEEE CS Press, Washington DC, USA, 32 – 40.
[12] Marcus, A., Feng, L., Maletic, J.I. 3D Representations for Software Visualization. In Proc. ACM SoftVis ‘03, ACM Press, NY, USA, 2003, 27 – 36.
[13] Reiss, S.P. Bee/Hive: A Software Visualization Back End. In
Proc. of the Workshop on Software Visualization, ICSE ‘01, 44 — 48.
[14] Seacord, R. C., Plakosh, D., Lewis, G. A. Modernizing Legacy Systems: Software Technologies, Engineering Process, and Business Practices. Addison-Wesley, SEI Series in Software Engineering, 2003.
[15] Shneidermann, B., The Eyes Have It: A Task by Data Type Taxonomy for Information Visualization. Proc IEEE Symp. on Visual Languages (VL ‘96), IEEE CS Press, Washington DC, USA, 1996, 336 – 343
[16] Sommerville, I. Software Engineering (6th edition).
Addison-Wesley, 2000
[17] Standish, T.A. An Essay on Software Reuse. IEEE Trans. on Software Engineering, 10 (5), Sep. 1984, 494 — 497.
[18] Storey, M.A., Best, C., Michaud, J., Rayside, D., Litoiu, M., Musen, M. SHriMP Views: an Interactive Environment for Information Visualization and Navigation. Proc. CHI ‘02, ACM Press, NY, 520 – 521.
[19] Telea, A., Maccari, A., Riva, C. An Open Toolkit for Prototyping Reverse Engineering Visualization. In Proc. IEEE VisSym ‘02, The Eurographics Association, Aire-la-Ville, Switzerland, 2002, 241 – 251.
[20]
Tilley, S.R., Wong, K., Storey M.A.D., Muller, H.A.
Rigi: A visual tool for understanding legacy systems.
In
International Journal of Software Engineering and