Y Shen & K Karimi
Understanding the roles of urban configuration on spatial heterogeneity and submarket regionalisation of house price pattern in a mix-scale hedonic model: The case of Shanghai, China
98:1
Understanding the roles of urban configuration on
spatial heterogeneity and submarket regionalisation
of house price pattern in a mix-scale hedonic model:
The case of Shanghai, China
Yao Shen
Space Syntax Laboratory, The Bartlett School of Architecture, UCL
Kayvan Karimi
Space Syntax Laboratory, The Bartlett School of Architecture, UCL
Abstract
Hedonic model is a powerful tool to investigate the important factors featuring cities’ house markets globally; but the development of a local regression approach named as ‘Mixed Geographically Weighted Regression’ (MGWR) has brought a new insight into urban studies in the field of house price modelling with a proper consideration of spatial heterogeneity, which enables urban planners to know valuable local and global information about elements that factor the property value. In this paper, we proposed a two-step framework to understand the spatial heterogeneity and submarket regionalisation via MGWR in a case study of Shanghai. In the first step, a mixed GWR hedonic model is adopted with the incorporation of globally fixed effect and local factors. In this manner, the influence surface of spatial configuration and land use settings on house price patterns are measured by controlling other elements. Compared with the outputs of ordinary least squares (OLS) analysis and purely local model, the results of specified model in this study are more promising, indicating that the spatial heterogeneity of house price is a complex urban system. In the second stage, a data-driven approach is adopted to detect the spatially homogeneous submarkets based on the coefficients of accessibility indices obtained from MGWR instead of the raw data. Comparison of a regular cluster analysis using housing structural information and the prosed approach is conducted. The results suggest that spatial accessibility and function accessibility are key factors in shaping spatially continuous housing sub-markets on multiple scales with other elements. The findings finally reveal that multi-level modelling procedures provide additional and useful insights into the varying relationships between spatial layouts and the housing price distribution and that urban configuration not only affects house price pattern but also influence shifting housing submarkets.
Keywords
Y Shen & K Karimi
Understanding the roles of urban configuration on spatial heterogeneity and submarket regionalisation of house price pattern in a mix-scale hedonic model: The case of Shanghai, China
98:2
1. Introduction
The hedonic model has been well established in modelling house price distribution at different spatial levels. However, some obvious restrictions remain in this parametric modelling approach (Helbich et al., 2014). First, the spatial heterogeneity of house price over the built environment is ignored or oversimplified. Second, this approach is based on predefined spatial units for the proposed analysis. Moreover, different types of accessibility measurements have not been sufficiently considered in existing models to reflect the influence of fine-scale urban spatial and functional distributions on house price. To address these gaps, the current study focuses on the roles of urban configuration on spatial heterogeneity and submarket regionalization of a house price map. An urban house price map is recognised as spatially varied across a geographic landscape. To prevent the limitation of ignorance in spatial variation, spatially weighted regression methods have been developed and adopted in spatial regression analysis. For example, the locally weighted regression (LWR) method developed by Cleverland and Devlin (1988) and the geographically weighted regression (GWR) method promoted by Fotheringham et al. (2002) are the most well-known approaches that can be considered in the hedonic model, assuming that all the variables have spatial variations for predicting house price. Nevertheless, not all the variables vary geographically, or only some parameters influence house price according to spatial locations (Wei and Qi, 2012). This condition is considerably close to the reality at the intra-city level, wherein several governmental policies and the structural features of properties are relatively common. Thus, the determined real price should include global and local factors. Consequently, spatially homogeneous factors and heterogeneous elements should be considered simultaneously to understand the house price pattern. Hence, we propose that the mixed geographically weighted regression (MGWR) model is appropriate for modelling the influence of various factors at multiple levels.
The definition of housing submarkets is important in identifying homogeneous groups within a market. Although the existence and roles of housing submarkets are remain debatable, this concept will increase the predictability of the house price model and further benefit the delivery of housing policies and the management of properties (Whitehead, 1999). In previous studies, administrative areas have been used as the objective definition of submarkets to reflect political jurisdiction (Bourassa et al., 2003; Watkins, 2001). However, the dynamics and changing pattern of housing submarkets are absent in these up-down methods. Moreover, structural and demographical features have been used to explore the changing nature of housing price submarkets. For example, housing characteristics (e.g., size, type, etc.) and socioeconomic dimensions (e.g., income, race portions, etc.) are combined to classify housing submarkets (Goodman and Thibodeau, 2007). However, this type of approach can still be improved because of its limitation, i.e., only a few endogenous features are considered. In this regard, other data-driven approaches, including component analysis (Watkins, 1999), clustering algorithms (Bourassa and Hoelsi, 1999), and so on, have been proposed to model shifting housing submarkets based on an extensive series of attributes. However, the spatial continuity of emergent housing clusters limits the interpretation of the results generated by using these approaches. The spatial continuity of housing submarkets can be addressed effectively by MGWR hedonic model because the outputs of MGWR do not only reflect statistical relationship but also geographic relationship. Therefore, the proposed study investigates housing submarket segmentation based on a data-driven classification method for spatial relationships between house price and various independent variables.
Spatial configuration, including urban network pattern and land use configuration, is significant in urban movement and further influences house price. However, only a few studies have explored these exogenous factors in house price prediction and housing submarket regionalization, except for several efforts on the space syntax community (Chiaradia et al., 2009; Yang, 2012; Law et al., 2013).
Y Shen & K Karimi
Understanding the roles of urban configuration on spatial heterogeneity and submarket regionalisation of house price pattern in a mix-scale hedonic model: The case of Shanghai, China
98:3 However, the local effects of spatial and functional accessibilities1 on house price have not been considered in existing studies. By contrast, the accessibility patterns measured by a street network and land use distribution, which repress the location-based similarity of accessibility, will help objectively define spatially continuative housing submarkets. Therefore, this study proposes a novel framework, in which MGWR is used to model house price pattern and explore the role of urban configuration in the spatial heterogeneity and housing submarket segmentation of Shanghai City, China. In particular, points of interest (POIs) and road networks are employed to compute spatial and functional accessibilities, respectively; then, the findings are utilized to understand the spatial autocorrelation of house price through MGWR. Based on the coefficients generated from MGWR instead of raw data, we use spatially constrained k-means clustering analysis to regionalize housing submarkets by considering spatial constraints. Therefore, the effects of urban configuration on the spatial heterogeneity and submarket regionalization of the house price pattern in a mix-scale hedonic model are explicitly revealed.
2. Methodology
2.1 Hedonic model
The origin of the hedonic model could be traced back to consumer behaviour theory, which was developed by Lancaster (1966) and formally built by Rosen (1974). The central idea of this model is that the individual characteristics of a house contribute to its price, rather than the house itself. The formal equation used to express this idea is as follows:
In this study, we propose a specified model with three types of variables, namely, location factors ( ), structural variables ( ), and demographic variables ( ). , , and denote the corresponding coefficients of these three elements, respectively. The proposed model is a typical model with globally fixed effects that are reflected by the coefficients.
2.2 MGWR
Based on the observed spatial non-stationary relationships across a geographic landscape, various approaches have been developed to deal with spatially varying coefficients. Among which, GWR is the most widely adopted method in relevant literature. This approach provides a refined and easily understandable means to model such relationships. Although the regular GWR model helps interpret promising local information on spatial variation, a widely recognized issue in GWR is that not all factors will present significant spatial variability across space. In reality, both global and local effects may be found in one place. Therefore, the purely local regression model may not always be the best approach to explore the relationship between response and explanatory variables. Some studies have discovered that socioeconomic attributes are suitable to be treated as global variables, whereas structural features are likely local factors with significant geographical variations (Fotheringham et al., 2002). An appropriate solution to this issue is applying a regression model where both local and global effects are properly defined and positioned. MGWR is one such model,
1
In this study, spatial accessibility refers to the configurational proximities between streets, whereas functional accessibility refers to configurational proximities between streets and land use points.
Y Shen & K Karimi
Understanding the roles of urban configuration on spatial heterogeneity and submarket regionalisation of house price pattern in a mix-scale hedonic model: The case of Shanghai, China
98:4 in which coefficients that are proven to be non-fluctuant across locations will be kept constant, and thus, prediction efficiency is improved. Therefore, the pure local GWR model is extended to be a multi-scale model to reflect real spatial complexity in an urban system. The MGWR model can be formulated based on the regular GWR model, as follows:
where and denote the total amount of global and local parameters of the variables, respectively; refers to the global variables; stands for the local variables; and is the
th parameter associated with the global explanatory variables at all locations.
The adoptability of MGWR relies on a calibration procedure, in which a multiple stepwise regression algorithm is used to test the geographic variability of each variable. This process is conducted through model comparisons among all pairs of the fitted GWR model, namely, purely local GWR and a modified model where only the kth coefficient is fixed globally. Through comparison with the difference measured by the Akaike information criterion (AIC), we can decide further which local factor should be regarded as global.
2.3 Accessibility computation
Accessibility has been recognised as a key factor in modelling house price. Traditionally, the distance to CBD is the exclusive determinant of the cause of spatial variation based on the monocentric Alonso–Muth–Mills model (Anas et al., 1998). However, the ideal monocentric model has been criticised for its concept and failure to modelling real polycentric urban systems. In this study, we use both spatial accessibility measured according to space syntax theory as well as model and functional accessibilities calculated in a land use system based on a street network. That is, these two types of accessibility measurement reflect urban grid configuration and street-connected land use configuration, respectively.
2.3.1 Space syntax measurements
Space accessibilities are computed according to space syntax theory. Segmental angular integration and choice are both included (Hillier and Lida, 2005; Hillier et al., 2012). The platform used to calculate these two types of spatial accessibility is Depthmap, which has been developed by Turner (2001) and Varoudis (2012). The spatial accessibility indices assigned to the point-based site of house price are the integration and choice values of the nearest segments to the house avenue. Several typical radii, including 1000, 2500, 5000, and 10000 m, are used. These radii represent spatial accessibility at various levels.
2.3.2 Street-based functional accessibility
Apart from space syntax measurements, we also compute reachable land use configuration to reflect the influence of observed land use organization on house price. Several indices are developed according to the study of Shen and Karimi (2014), who have developed a framework for combining urban density, diversity, and mean configurational distance as a single measurement to reflect different aspects of urban function accessibility. Based on geographic research and the space syntax mode, density index is defined as the amount of point-based land uses that is metrically reachable for a location. Similar algorithms can be also found in the previous studies conducted by Stahle, Marcus and Andres (2005), and Peponis et al (2008). The diversity index is modeled as the normalised information entropy of various land use types within an accessible area for place i.
Y Shen & K Karimi
Understanding the roles of urban configuration on spatial heterogeneity and submarket regionalisation of house price pattern in a mix-scale hedonic model: The case of Shanghai, China
98:5 Furthermore, we propose a diversity measurement based on information entropy of active land uses within a metrically reachable area from place i. The mean configurational distance is defined as the mean angular depth required to reach all metrically reachable land use sites. These values are computed in the self-developed toolkit in ArcGIS 10.2. Considering land use interaction that occurs at relatively local scales, local and semi-local radii are used, including 1000 m and 2500 m.
2.4 Spatially constrained cluster analysis
We also propose to use unsupervised cluster analysis to understand submarkets. Many studies have adopted similar approaches to detect the potential submarkets of house price. We use k-means clustering equipped with a spatial constraint. The well-known problem of k-means clustering is the pre-definition of a number of clusters. In this study, we employ the Calinski–Harabasz pseudo-F index as the validation measurement to evaluate the most suitable number of clusters. This index, which has been developed by Calinski and Harabasz (1974), denotes the ratio of inter-cluster variance to intra-cluster variance. Then, we will test the extent to which our method can improve house market predictability.
2.5 Framework of the study
The study design is illustrated in Figure 1. The framework includes a stepwise research procedure. In the first step, the collected house price data are randomly selected to generate a random sample and then spatially joined with computed accessibilities based on street networks and POIs. In the next stage, the dimensions of the data are reduced and multicollinearity is removed based on the variance inflation factor (VIF) value in the OLS model. All the remaining variables are inputted in the MGAR model to generate regression predictions, which are then compared with the OLS results to prove the effectiveness of the MGWR model. Meanwhile, the role of urban configuration on the spatial heterogeneity of house price is evaluated using the regression results. Then, the coefficients of the factors are used in a spatially constrained k-means clustering analysis to partition a market into several submarkets. We use the pseudo-F index to select the optimal number of clusters. Finally, OLS for house price prediction in each submarket is conducted to determine the prediction accuracy of the emergent housing submarket. K-means clustering analysis is performed within R (Team, 2013).
3. Study area and data
3.1 Study area
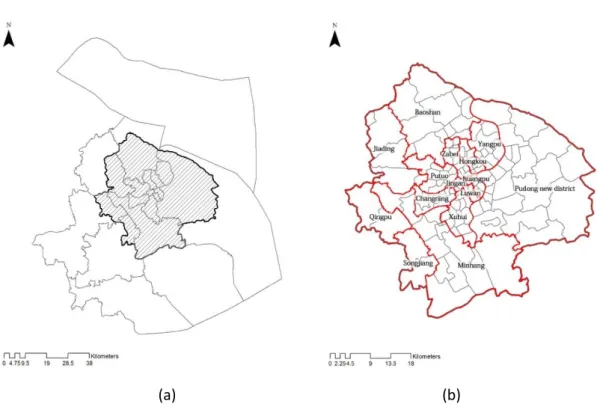
We focus on the central section of the Shanghai Metropolitan Area (SMA) as an example to conduct our empirical study. Shanghai is the economic centre and one of the biggest municipalities in China, along with Beijing, Tianjin, and Chongqing. Given its geographic location, Shanghai was also the first city to experience modernization in China starting in the 1860s (i.e., after the Second Opium War). Since the implementation of the Open Door Policy in 1979, Shanghai has been growing significantly and has transformed into a mega city. At present, the city has 23 million residents living in the 6340 km2 administrative area. We did not study the entire metropolitan area in this case; instead, we focused only on the house price at the intra-urban scale within the central area, wherein census units are considerably smaller and highly urbanized. In this manner, the inner city and its context are considered simultaneously.
Y Shen & K Karimi
Understanding the roles of urban configuration on spatial heterogeneity and submarket regionalisation of house price pattern in a mix-scale hedonic model: The case of Shanghai, China
98:6
Y Shen & K Karimi
Understanding the roles of urban configuration on spatial heterogeneity and submarket regionalisation of house price pattern in a mix-scale hedonic model: The case of Shanghai, China
98:7
(a)
(b)
Figure 2: Study areas in SMA: (a) the location of study area in SMA; (b) the census distribution of central area)
3.2 Property value data from open data source
The house price dataset is collected from online websites of local sales agents of properties using the data mining approach. Hence, we obtain the asking price data rather than the actual transition records for houses. Considering data availability in China, these datasets are the most detailed and cover an extensive urban landscape with sufficient information. Previous studies have also validated these records by comparing them with the actual selling prices of houses and by asserting the reliability of these datasets (Chandler and Disney, 2014). Our datasets cover the period from October 2014 to December 2014. The sample size is 8262 with 3818 unique locations after removing duplicate records. Figure 2 shows that the house price distribution is generally followed by a decay surface from the downtown to the suburban areas. The house price distribution indicates that the highest price cluster emerges at the city centre and the decay trend is extremely significant because of the large value of the alpha parameter. In addition, location information and detailed records on house typology, size, year built, green ratio of the neighbourhood, orientation, and total price are also provided for each property. The overall data framework is presented in Section 2.4.
Y Shen & K Karimi
Understanding the roles of urban configuration on spatial heterogeneity and submarket regionalisation of house price pattern in a mix-scale hedonic model: The case of Shanghai, China
98:8
(a) (b)
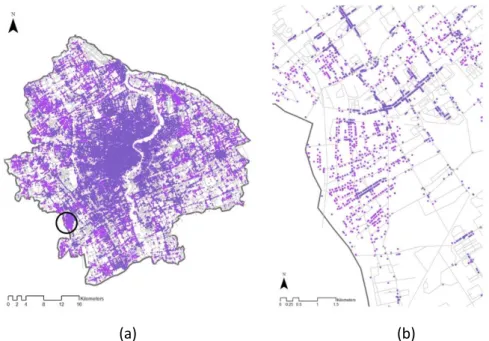
Figure 3: House price map of central area in Shanghai (a) and the corresponding cumulative distribution probability (CDF) pattern (b)
3.3 Road network and POIs
The urban road network and POIs are collected from a navigation company in China. The segmental map has 92,920 segments after being redrawn and converted from an axial map, while the POI dataset consists of 191,035 point-based land use avenues. The POIs are reclassified into 11 main types of active land use to reflect complementarity among land uses. Active land uses include retail, catering, hotel, office, recreation, public service, park, education, hospital, culture, and transportation. Other types of land use are classified as “others.” All land uses are used to compute urban density, whereas active land uses are employed to calculate urban diversity. The two datasets are utilized to measure spatial accessibility and functional accessibility, respectively. The sample road network and POIs are shown in Figure 4.
(a) (b)
Figure 4: Roadwork and POIs in study area: (a) road network overlapped with POIs in study area; (b) road network and POIs in a sample area
Y Shen & K Karimi
Understanding the roles of urban configuration on spatial heterogeneity and submarket regionalisation of house price pattern in a mix-scale hedonic model: The case of Shanghai, China
98:9 3.4 Covariates
Three types of variables are adopted in this study to model house price. The structural properties of each house avenue include the features of the building and the characteristics of the neighbourhood. As mentioned earlier, spatial accessibility indices are computed at multiple levels, whereas land use accessibility indices are calculated at local and semi-local scales.
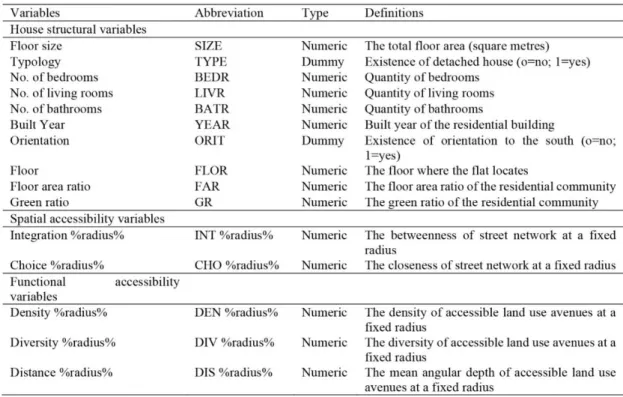
Table 1: Descriptive statistics of housing structural, configurational and functional variables
4. Empirical results in shanghai
4.1 Preliminary findings on the spatial heterogeneity of house price
4.1.1 Density of transactions
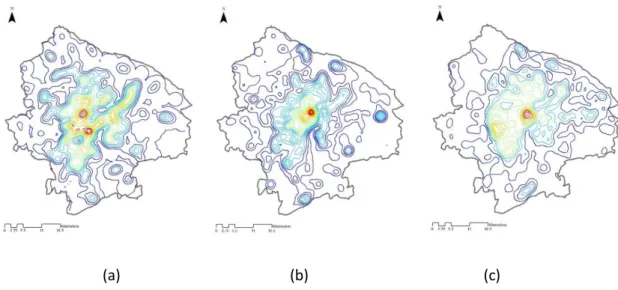
Before conducting regression analysis, we first compare the contour maps in terms of the transaction density of house asking price, POI density, and road density. In Figure 5, the central area of Shanghai is highlighted and generally identified in all the density maps. The figure illustrates that the areas where more houses are claimed to be sold also have higher morphological density. However, based on our temporal house price dataset for 3 months, only a few houses are for sale in the business area around Nanjing Road, which is the most popular pedestrian business street in Shanghai. A possible explanation for this phenomenon is that only a few houses for sale are available online because of its popularity. Although a general correlation can be recognized among different density maps, the detailed correspondence is inconsistent. This finding implies that house price distribution is a complex pattern and the relationship between house price and urban accessibilities will benefit when this complexity is revealed.
Y Shen & K Karimi
Understanding the roles of urban configuration on spatial heterogeneity and submarket regionalisation of house price pattern in a mix-scale hedonic model: The case of Shanghai, China
98:10
(a)
(b) (c)
Figure 5: Contour maps in terms of transaction density (a), density of POIs (b) and road density (c)
4.1.2 Urban configuration and house price
In this study, the initial result of the relationship between accessibility indices and house price is explored through linear regression. As expected, house price can be generally predicted well at nearly 40%, according to previous studies. However, in the case of Shanghai, we determine that land use configuration can also explain house price distribution from various perspectives. The best fit between integration and house price (0.336) is at 10,000 m, which suggests that the overall house price pattern is related to network centrality at a large scale. Nevertheless, land use configuration exerts a relatively local influence on house price. Land use density at the semi-local scale is positively related to house price, with the highest degree of correspondence (0.363). The mean configurational distance to land uses at 2500 can explain the 13% change in house price. The variation exhibits a clear relationship with house value despite a correlation coefficient of only 0.07. These initial findings suggest that land use system and street configuration interact with each other at different spatial levels, and thus, house price is affected.
Figure 6: House price as the interaction between urban configurations
4.1.3 Spatial autocorrelation of house price
Spatial dependence is a fundamental character of geographically distributed phenomena, as well as an evidence of the existence of spatial heterogeneity. Once a significant spatial dependence is identified, spatial autocorrelation is assumed to be present in the sample (house price in this study). Consequently, classic statistical regression methods are inadequate to account for spatial
Y Shen & K Karimi
Understanding the roles of urban configuration on spatial heterogeneity and submarket regionalisation of house price pattern in a mix-scale hedonic model: The case of Shanghai, China
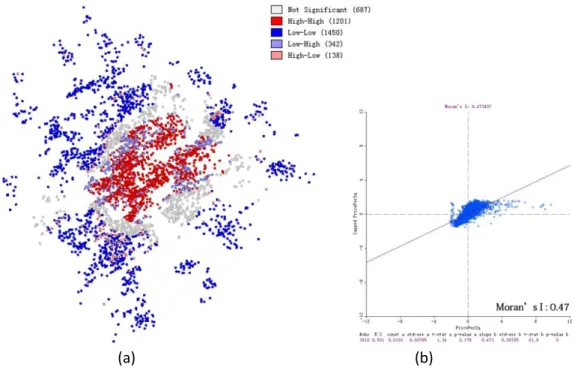
98:11 autocorrelation in the variables. Therefore, spatial regression methods have been developed to address such inadequacy. In this study, we first performed Moran’s I analysis to examine the existence of spatial autocorrelation in the data. Using the toolkit called GeoDa developed by Anselin (2004), we calculated the value of the global Moran’s I and generated a map of the local Moran’s I by conducting local indicators of spatial association analysis. According to the results presented in Figure 6, significant spatial heterogeneity is discovered in the house price pattern in Shanghai, as well as in the house price pattern at the point level. The global Moran’s I2 value for all the sites in SMA is 0.47 (the p-value is equal to 0.001 by running the permutation test 999 times), which suggests a dramatic clustering of house price. Low-low clusters are recognized in the suburban areas, whereas high-high clusters mainly occupy the central area. Significant spatial autocorrelation and specific local variations suggest the possibility of spatial heterogeneity in the spatial relationships. Thus, MGWR is adopted to study house price patterns in Shanghai.
(a) (b)
Figure 6: Spatial autocorrelation analysis for house price map: (a) LISA analysis map; (b) Moran’s I scatter plot diagram
4.2 MGWR modelling of house price
4.2.2 Detecting local and global variables
Before running the MGWR model, we first use the OLS model to remove the detected variables and achieve significant multicollinearity with other factors. Our method is straightforward considering that it removes the variables with a VIF value bigger than 10. Hence, 4 variables are removed from our model, namely, CHO10000, CHO5000, INT5000, and INT2500. All the remaining variables are inputted into the geographic variability tests of the local coefficient to detect and distinguish between local and global variables. The standard for filtering global from local factors is the change in AIC scores. If the AIC score is significantly reduced by converting a local variable to global, then
2
Moran’s I value is an index for analyzing spatial autocorrelation or geographic difference in spatial variables. When the value is high, the spatial autocorrelation is significant.
Y Shen & K Karimi
Understanding the roles of urban configuration on spatial heterogeneity and submarket regionalisation of house price pattern in a mix-scale hedonic model: The case of Shanghai, China
98:12 this variable will be appropriately classified as global rather than local. We use minimized CV to determine the optimal adaptive bandwidth that includes 171 neighbouring properties. A total of 8 variables are extracted from the 20 variables. Through comparison with the pure local GWR model, the AIC score is decreased, which suggests that the MGWR model is favourable because bias is reduced. Table 2 presents the MGWR model and its global and local counterparts.
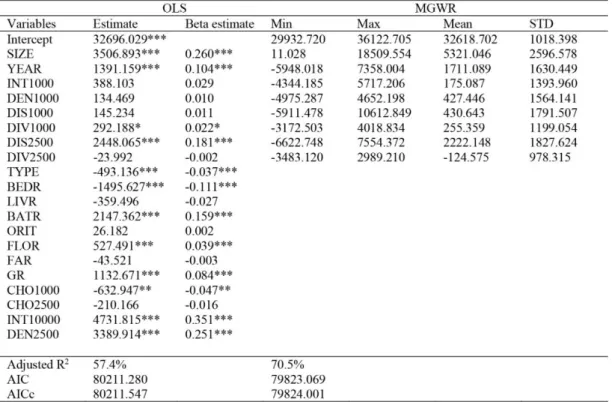
Table 2: Estimation results of MGWR
4.2.3 Comparison with the OLS model
The OLS and MGWR models are estimated to evaluate the effectiveness of the proposed semi-local regression model. As shown in Table 2, the explanatory power of MGWR is 13% higher than that of the global model. Hence, spatial heterogeneity is addressed and prediction accuracy is enhanced when spatial variation is considered.
In the OLS model, INT10000, DEN2500, SIZE, and YEAR are the most important factors that are statistically significant for predicting change in house price. The first two variables (INT10000 and DEN2500) are globally dominant, which implies that global spatial accessibility at R10000 m and local land use density at R2500 m are the powerful forces in increasing house price. Meanwhile, Shanghai citizens will be willing to pay a high amount of money for a large and newly built house with various amenities. Furthermore, the price of housing properties is recognized as negatively related to the intensity of thorough movement. This finding may be attributed to the fact that people tend to avoid noise and traffic congestion and wish to maintain their privacy. Moreover, the mean distance to proximal urban facilities is also clearly vital to house pricing. This finding indicates that the improvement of service delivery efficiency measured by a mean angular change in all reachable POIs at 2500 m will increase willingness to pay a high house price. In addition, people will be willing to pay a high house price for more bathrooms. Although some structural variables are important, the OLS results show that the effects of the co-presence of geometric accessibility and geographic accessibility are statistically significant.
Y Shen & K Karimi
Understanding the roles of urban configuration on spatial heterogeneity and submarket regionalisation of house price pattern in a mix-scale hedonic model: The case of Shanghai, China
98:13 The MGWR model performs better than the OLS model by relying on the reduced AIC and the enhanced and adjusted R2. A considerable change in the local coefficients indicates that house buyers value housing characteristics unequally across space. Among all the local variables, two structural variables and six elements reflect the diverse aspects of urban configuration. SIZE is the only variable that exerts a positive influence at all times, although its influence varies dramatically. Other variables exhibit both positive and negative effects depending on the specified locations.
Y Shen & K Karimi
Understanding the roles of urban configuration on spatial heterogeneity and submarket regionalisation of house price pattern in a mix-scale hedonic model: The case of Shanghai, China
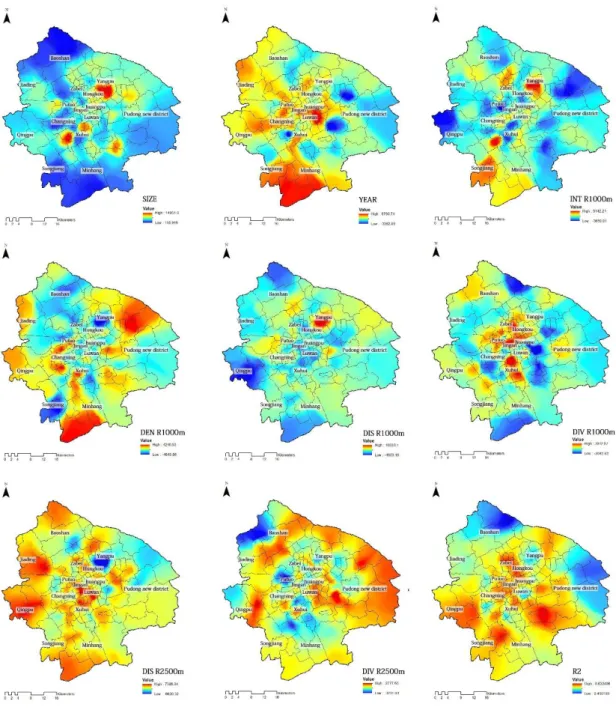
98:14 4.2.4 Interpreting the MGWR results
Figure 7 illustrates the parameter estimates of eight selected non-stationary covariates that are interpolated by the ordinary Kriging algorithm. The R2 coefficients vary from 0.45 to 0.83. As expected, positive clusters and negative patchworks emerge. In terms of house size, four areas are particularly important in house price increase. The positive effect of house size is reduced in other areas, although a positive relationship remains. In terms of variables that reflect urban configuration, scale preference is expressed. The historical centres located at the west side of the Huangpu River are characterized by the positive effects of urban diversity at 1000 m and mean angular distance to all reachable land uses at 1000 m. By contrast, the new Pudong District is highlighted by the positive effects of urban diversity at 2500 m. This phenomenon may be related to the intensity of interaction among active land uses. The old city centres, rather than the newly planned district, generate urban interaction at the lower level. Therefore, the results of MGWR indicate local information with different spatial similarities based on the coefficient change, which can be a fundamental finding in submarket identification.
4.3 Submarket segmentation
4.3.1 Spatially constrained k-means clustering via spatial coefficients
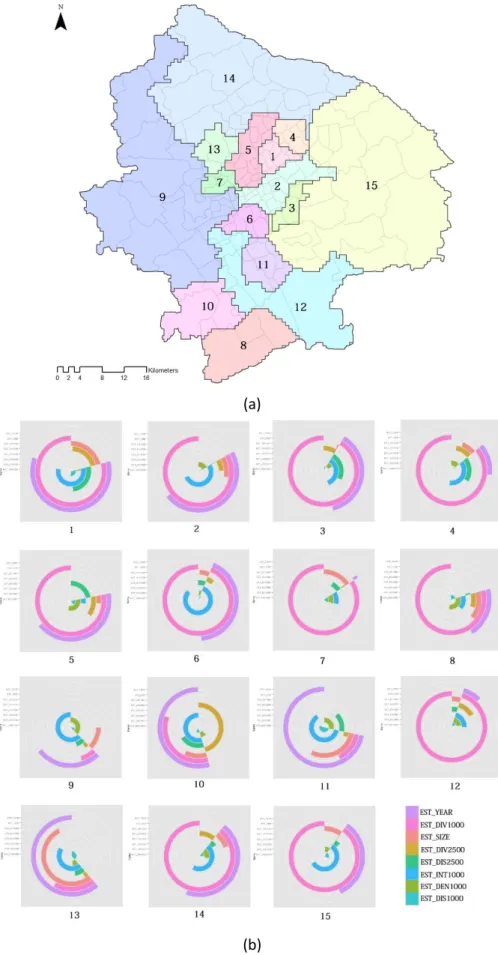
The spatial coefficients of nine local variables are used in k-means clustering analysis to segment the entire urban landscape. A model-driven determination of the number of submarkets, i.e., the Calinski–Harabasz pseudo-F index, suggests that 15 is the best number for running cluster partition. The final submarket partition of Shanghai is provided in the right panel of Figure 8. Compared with all the other variables, Cluster 2 has a relatively high house price, as well as two central areas, including the Pudong CBD area and the south part of the traditional colonial areas. Other well-known districts are also effectively identified. For example, Xujiahui, which is a popular shopping destination located at the lower middle section of the study area, is described in Cluster 6. Cluster 1 comprises the Nanjing Road business district, which is the most popular shopping and tourist destination in Shanghai. Meanwhile, Cluster 4 covers most of the Wujiao Square area around Tongji University. We overlap the final submarket partition with the administrative boundaries of census units and discover that some of the generated clusters can match the boundaries to a large extent. In particular, Cluster 3 only occupies three units, whereas Cluster 9 covers a large area in the west of the city. Although housing submarkets reflect the economic dimension of the built environment, urban subsidies in various governmental areas may vary, and thus, the boundaries of housing markets will represent the distribution of policy implementation.
Y Shen & K Karimi
Understanding the roles of urban configuration on spatial heterogeneity and submarket regionalisation of house price pattern in a mix-scale hedonic model: The case of Shanghai, China
98:15
(a)
(b)
Figure 8: Generated submarkets: (a) Distribution of 15 defined submarkets and (b) the polar diagram showing the difference between clusters (the clockwise direction denotes to the positivity of the value; the anticlockwise direction refers to the negativity of the value; and the length of arc represents the absolute value)
Y Shen & K Karimi
Understanding the roles of urban configuration on spatial heterogeneity and submarket regionalisation of house price pattern in a mix-scale hedonic model: The case of Shanghai, China
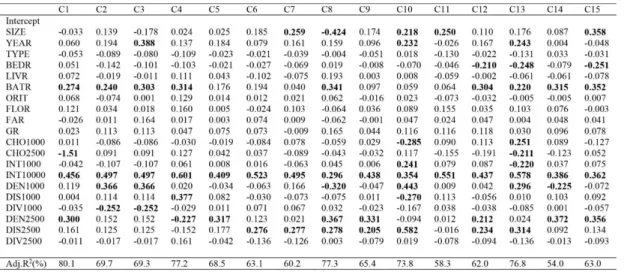
98:16 4.3.3 Validation
The objective of identifying housing submarkets is to increase the possible accuracy of human prediction through statistical tools. Thus, an appropriate means to validate our results is to redo the OLS regression for each cluster. By doing so, variations in the effects of variables on house price can be reduced. That is, if the spatial coefficient based on submarkets is promising, then the R2 of the specific model should be higher for most clusters. Table 3 shows the single equation model for each submarket. The proposed cluster seems to address the spatial heterogeneity of house price pattern satisfactorily, which reveals that the interaction among structural features, spatial configuration, and land use distributions influences the economic performance of submarkets. The significant coefficients are highlighted in the table. Global integration obviously influences all the submarkets dramatically. Another globally strong factor is the number of bathrooms. The negative effects from streets with high selection and urban diversity are also evident, which confirms the general finding of the overall single equation model. Compared with the structural features of houses, the role of urban configuration is more significant because of the complexity of co-presence between urban grids and land uses.
Table 3: Single equation model for each segmented submarket
In the central area (C1 to C5), the interplay between urban density and diversity is the key element in house price. However, urban diversity is not preferred. In the urban areas between downtown and suburban areas (C6 to C10), the co-presence between global to movement and configurational distance to semi-local land uses is a dominant factor. In the suburban areas (C11 to C15), urban density and diversity at the semi-local level are relatively important. Thus, co-presence among accessibilities generated by urban confirmation can be a vital clue in characterizing submarkets. Consequently, urban configuration, including spatial and functional components as well as their relationship, strongly influences house price prediction and submarket regionalisation.
5. Discussion
This study presents a data-driven framework for understanding the effects of urban spatial and functional structures on spatial heterogeneity and submarket identification of house price in Shanghai using MGWR. The spatial and functional configurations are measured by road network and POIs. The entire research includes the following processes. In the first part, the spatial variation of house price distribution is detected through spatial autocorrelation analysis. Second, MGWR is employed to measure the varying spatial effects of accessibilities, which are defined based on spatial configuration and land use patterns. Then, using the relationship generated from MGWR, we apply the spatially constrained k-means clustering algorithm to identify different submarkets. The findings
Y Shen & K Karimi
Understanding the roles of urban configuration on spatial heterogeneity and submarket regionalisation of house price pattern in a mix-scale hedonic model: The case of Shanghai, China
98:17 suggest that location situations affected by street network and land-use setting at various levels are the dominant factors in emergent housing submarkets.
5.1 General model
We propose an ideal model to present the understanding on the role of urban configuration in house price change. Urban performance is the result of urban interaction among different components of urban configuration. Considering the change in urban configuration as a form of dynamics in urban evolution, we can use the most significant urban elements of the general urban configuration system, i.e., street network and land use distribution, as basic concepts. The interaction between these two key components provides various types of co-presence among accessibilities at different levels. The overall effects will be understood by house buyers, developers, and designers who will select a suitable house or design and build ideal houses for an improved price in the market. The house price pattern, including spatial heterogeneity and submarkets regionalisation, is simultaneously influenced by these complex urban interactions. The entire process is triggered by urban configuration, which is influenced by urban interaction.
Figure 9: The mechanism of the transformation of house price distributions
5.2 Potential bias and limitation
Although the empirical results of this study imply the merits of the proposed method, several limitations exist. First, only the claimed house price dataset is used in this research, which may not refer to the real price of housing transactions. Nevertheless, online claimed house price data are widely used in house price modelling in Chinese cities. The reliability of the data has also been proven in previous studies (Chandler and Disney, 2014). Second, the urban density of land use is estimated by counting the reachable number of various types of avenues for urban activities. In reality, however, the actual quality or popularity of different sites will be unequal. With increasing data availability, POIs should be weighted through their quality by using floor area or other alternative datasets from social media (e.g., geo-tagged tweets, check-ins). Third, additional empirical tests are necessary to prove the effectiveness of the proposed approach and confirm the dominant roles of urban configuration on the prediction of spatially varied house price and submarket segmentation. Lastly, other variables can be considered for this framework, such as the demographic characteristics of buyers. All these limitations will be addressed in a future work to enhance the efficiency and accuracy of the proposed approach.
Y Shen & K Karimi
Understanding the roles of urban configuration on spatial heterogeneity and submarket regionalisation of house price pattern in a mix-scale hedonic model: The case of Shanghai, China
98:18
6. Concluding remarks
The contributions of this study mainly lie in the following aspects. First, we reveal the relationship between urban configurational accessibilities and the spatially varied house price pattern based on MGWR. Second, ubiquitous datasets of road network and POIs are used to compute various indices of accessibility, which demonstrates the possibilities of using volunteered geographical information data. Third, the coefficients obtained from MGWR are used to segment housing submarkets instead of raw data. This method is practically effective in generating spatially constrained housing submarkets, which is validated to enhance prediction accuracy effectively compared with regular methods. This framework is ideal for investigating a spatially clustered house price pattern and its partitions, as well as the influence of urban configuration.
The established data-driven framework for measuring the roles of urban network and land use configuration on house price distribution in Shanghai City can be applied to, but not limited to, the following aspects. First, this framework can provide information to urban planners and decision makers in designing urban configuration and land use planning according to a specified housing submarket to ensure socioeconomic equality. Furthermore, emergent spatially constrained submarkets can be used to understand and compare other potential communities, such as administrative areas. Moreover, the proposed method can be used as a training algorithm to model the entire landscape from a small sample and further contribute to identifying submarkets and revealing their evolution.
Acknowledgement
The sincere thanks are given to China Scholarship Council for the finance sponsor (No.201206250011) by the first author.
Reference
Anas, A., Arnott, R. and Small, K. A. (1998), ‘Urban spatial structure’, Journal of Economic Literature, Vol. 36, p. 1426-1464.
Anselin, L. (2004), ‘Exploring spatial data with GeoDaTM: a workbook’, Urbana, Vol. 51 (2004), p. 61801. Anselin, L. (2010). ‘Thirty years of spatial econometrics’. Papers in regional science, Vol. 89(1), p.3-25.
Bourassa, S. C., Hamelink, F., Hoesli, M., and MacGregor, B. D. (1999), ‘Defining Housing Submarkets’, J. Housing Econ. Vol. 8, p.160-183.
Bourassa, S.C., Hoesli, M. and Peng, V.S. (2003), ‘Do housing submarkets really matter?’, Journal of Housing Economics, Vol. 12 (1), p.12–28.
Chandler, D., and Disney, R., (2014), ‘Measuring house prices: a comparison of different indices’, Institute for Fiscal Studies, London, 2014.
Caliński, T., & Harabasz, J. (1974). ‘A dendrite method for cluster analysis’. Communications in Statistics-theory and Methods, Vol. 3(1), 1-27.
Chiaradia, Alain J., Bill Hillier, Yolanda Barnes, and Christian Schwander. (2009), ‘Residential Property Value Patterns in London: Space Syntax spatial Analysis’, In Proceedings of the 7th International Space Syntax Symposium, Stockholm: KTH.
Cleveland, W. S., and Devlin, S. J. (1988). ‘Locally weighted regression: an approach to regression analysis by local fitting’. Journal of the American Statistical Association, Vol. 83(403), p.596-610.
Fotheringham A., Brunsdon C., and Charlton M. (2002), Geographically weighted regression: the analysis of spatially varying relationships, Chichester, West Sussex, England: Wiley.
Goodman, A., and Thibodeau, T.G. (2007), ‘The spatial proximity of metropolitan area housing submarkets’, Real Estate Economics, Vol. 35(2), p.209–232.
Helbich, M., Brunauer, W., Vaz, E., and Nijkamp, P. (2014), ‘Spatial Heterogeneity in Hedonic House Price Models: The Case of Austria’, Urban Studies, Vol. 51(2), p.390-411.
Hillier, B., and Lida, S. (2005), ‘Network effects and psychological effects: a theory of urban movement’, Proceedings of 5th International Space Syntax Symposium, p. 553-564, Delft.
Hillier, B., T. Yang, and A. Turner. (2012), ‘Normalising Least Angle Choice in Depthmap and How It Opens up New Perspectives on the Global and Local Analysis of City Space’, Journal of Space Syntax, Vol. 3(2), 155–193.
Y Shen & K Karimi
Understanding the roles of urban configuration on spatial heterogeneity and submarket regionalisation of house price pattern in a mix-scale hedonic model: The case of Shanghai, China
98:19
Peponis, J., Sonit, B., and Zhang, Z. (2008), ‘The connectivity of streets: reach and directional distance.’
Environment and planning. B, Planning & design Vol. 35 (5), p.881.
Shen, Y., and Karimi, K. (2014), ‘Measuring streetbased function accessibility with urban network and points of interest: a case study of shanghai’, 2014 Annual Congress of the Association of European Schools of Planning (AESOP). Utrecht, Netherlands.
Ståhle, A., Marcus, L., and Karlström, A. (2005). ‘Place Syntax: Geographic accessibility with axial lines in GIS.’ In
Proceedings, Fifth international space syntax symposium, Delft: University of Technology, p.131-144. Law, S., Karimi, K., Penn, A., and Chiaradia, A. (2013), ‘Measuring the influence of spatial configuration of the
housing market in metropolitan london’, In Proceedings of the Ninth International Space Syntax Symposium, Seoul.
Team, C., (2013). ‘R: A language and environment for statistical computing’. Vienna, Austria, R Foundation for Statistical Computing. Available at: http: R-project. org.
Turner, A. (2001). A program to perform visibility graph analysis. In Proceedings of the 3rd Space Syntax Symposium, Atlanta, University of Michigan, p. 31-1.
Varoudis T. (2012), 'depthmapX MultiPlatform Spatial Network Analysis Software’, Version 0.30 OpenSource, htt p://varoudis.github.io/depthmapX/
Watkins, A. (1999), ‘Property valuation and the structure of urban housing markets’, Journal of Property Investment and Finance, Vol. 17(2), 157-175.
Watkins, C. (2001), ‘The definition and identification of housing submarkets’, Environment and Planning A, Vol. 33(12) 2235 – 2253.
Wei, C. and Qi, F. (2012), ‘On the estimation and testing of mixed geographically weighted regression models’,
Economic Modelling, Vol. 29, p. 2615-2620.
Whitehead, C. (1999), ‘Urban housing markets: theory and policy’, Handbook of Regional and Urban Economics
(eds P. Chesire and E.S. Mills), Vol. 3. Elsevier, Amsterdam.