International Publications Key Workplace Documents
2015
Restructuring in the Public Sector
Restructuring in the Public Sector
Eurofound
Follow this and additional works at: https://digitalcommons.ilr.cornell.edu/intl Thank you for downloading an article from DigitalCommons@ILR. Thank you for downloading an article from DigitalCommons@ILR.
Support this valuable resource today! Support this valuable resource today!
This Article is brought to you for free and open access by the Key Workplace Documents at DigitalCommons@ILR. It has been accepted for inclusion in International Publications by an authorized administrator of
DigitalCommons@ILR. For more information, please contact [email protected].
If you have a disability and are having trouble accessing information on this website or need materials in an alternate format, contact [email protected] for assistance.
helping to sustain demand in the European economy. However, by 2010, significant restructuring was underway in the public sector in several Member States. In contrast to restructuring in the private sector, public sector restructuring affects much of the population, and so generates a great deal of political interest and some controversy. It is also particularly complicated, and often problematic - not least on account of the numbers of people involved, the tradition of strong employment protection and high levels of trade union representation. The rationale for public sector restructuring is also very different to that in the private sector, one important factor being that it is not motivated by a decrease in demand for its services. Recent public sector restructuring has almost exclusively been triggered by the dire state of public finances in many Member States.
Just as the recession has had very different impacts in various Member States, so too has the extent of recent public sector restructuring. This is, of course, largely due to the different rates of public debt, which have varied considerably from one Member State to another. However, it is also the case that Member States that initiated significant public sector restructuring in the 1990s had less need to restructure post-2008.
Keywords Keywords
public services, public sector, public debt, Europe
Comments Comments
Suggested Citation Suggested Citation
European Foundation for the Improvement of Living and Working Conditions. (2015). Restructuring in the public sector. Dublin: Author.
Eurofound
Restructuring in the public sector
Eurofouhd
ERM ANNUAL REPORT 2014
Restructuring in the public sector
Wyattville Road, Loughlinstown, Dublin 18, Ireland - Tel: (+353 1) 204 31 00 - Fax: (+353 1) 282 42 09 / 282 64 56 email: [email protected] - website: www.eurofound.europa.eu
Authors: Funda Celikel-Esser, John Hurley, Donald Storrie, Elias Gerogiannis and Andrea Broughton
Research Managers: Donald Storrie and Funda Celikel-Esser
Eurofound project: European Restructuring Monitor
© European Foundation for the Improvement of Living and Working Conditions, 2015.
For rights of translation or reproduction, applications should be made to the Director, European Foundation for the Improvement of Living and Working Conditions, Wyattville Road, Loughlinstown, Dublin 18, Ireland.
The European Foundation for the Improvement of Living and Working Conditions (Eurofound) is a tripartite European Union Agency, whose role is to provide knowledge in the area of social and work-related policies. Eurofound was established in 1975 by Council Regulation (EEC) No. 1365/75, to contribute to the planning and design of better living and working conditions in Europe.
European Foundation for the Improvement of Living and Working Conditions Telephone (+353 1) 204 31 00
Email: [email protected] Web: www.eurofound.europa.eu
Europe Direct is a service to help you find answers to your questions about the European Union.
Freephone number (*): 00 800 6 7 8 9 10 11
(*) Certain mobile telephone operators do not allow access to 00 800 numbers or these calls may be billed.
Cataloguing data can be found at the end of this publication.
Luxembourg: Publications Office of the European Union, 2015
ISBN 978-92-897-1310-8 doi:10.2806/92093
Printed in Luxembourg
Cover image: © Shutterstock
The paper used in this book is chlorine-free and comes from managed forests in Northern Europe. For every tree felled, at least one new tree is planted.
BE Belgium BG Bulgaria CZ Czech Republic DK Denmark DE Germany EE Estonia IE Ireland EL Greece ES Spain FR France HR Croatia IT Italy CY Cyprus LV Latvia LT Lithuania LU Luxembourg HU Hungary MT M alta NL N etherlands AT Austria PL Poland PT Portugal RO Romania SI Slovenia SK Slovakia FI Finland SE Sweden UK United Kingdom iii
Country clusters used in the report
Continental (AT, BE, DE, FR, LU, NL)Eastern European (PL, CZ, HU, SK, SI, RO, BG, EE, LT, LV, HR)
Liberal (UK, IE)
M editerranean (PT, ES, IT, EL, CY, MT)
Nordic (DK, SE, FI)
Main acronyms used in the report
EMCC European Monitoring Centre on Change
ERM European Restructuring Monitor
EU LFS European Labour Force Survey (Eurostat)
NACE European industrial activity classification (Nomenclature statistique des Activites economiques dans la Com m unaute Europeenne)
NPM New Public M anagem ent
SES European Union Structure of Earnings Survey
US-CPS US Current Population Survey
Executive summary 1
Introduction and summary 5
Part A: Recent labour market trends
Chapter 1: Labour market and restructuring trends 13
Background 13
Restructuring and employment shifts by economic sector 16
Flows out of employment and reasons why 21
Data and methodology 21
General trends 23
Reasons for the transitions from employment to non-employment 25
Conclusion 30
Part B: Restructuring in the public sector
Introduction 35
Chapter 2: Mapping restructuring in the public sector 41
Descriptive statistics 41
Characteristics of public services employment 41
Extent of public services/public sector employment 43
Recent employment trends in the main public service sectors 46
Qualitative implications of recent employment shifts in public services 49 Recent restructuring in the public sector - evidence from the ERM 52
Chapter 3: Motives for restructuring in the public sector 57
Impact of austerity m easures 58
Impact of reforms and efficiency drives 60
Demographic factors 61
Chapter 4: Processes and actors 63
Financial agencies 63
International actors 64
Role of trade unions 65
Role of citizens 67
Role of ex-ante impact assessm ents 68
Chapter 5: Restructuring practices 71
Introduction 71
Quantitative adjustments on wages and working time 75
Quantitative adjustments on headcount 77
Phased/early retirement 78
Restructuring tools as an alternative to quantitative adjustments 80
Privatisation/Outsourcing/External service delivery 85
New forms of employment within the public sector 88
Chapter 6: Effects of public sector restructuring on stayers and leavers 93
Introduction 93
Impact of public sector restructuring on ‘stayers’ 94
Impact of job loss for the dismissed employees 99
Chapter 7: Conclusions 105
Bibliography 109
Annexes 115
In the immediate aftermath of the recession in 2008, employment in the public sector continued to grow, helping to sustain dem and in the European economy. However, by 2010, significant restructuring was underway in the public sector in several Member States. In contrast to restructuring in the private sector, public sector restructuring affects much of the population, and so generates a great deal of political interest an d some controversy. It is also particularly complicated, and often problematic - not least on account of the num bers of people involved, the tradition of strong employment protection and high levels of trade union representation. The rationale for public sector restructuring is also very different to that in the private sector, one important factor being that it is not motivated by a decrease in dem and for its services. Recent public sector restructuring has almost exclusively been triggered by the dire state of public finances in m any Member States.
Just as the recession has had very different impacts in various M ember States, so too has the extent of recent public sector restructuring. This is, of course, largely due to the different rates of public debt, which have varied considerably from one Member State to another. However, it is also the case that M ember States that initiated significant public sector restructuring in the 1990s h ad less need to restructure post-2008.
Policy context
The overarching policy context is that of austerity, prompted by the perceived need to cut public debt in order to m aintain not only an individual Member State’s financial stability, but also the existence of the single currency. The Stability and Growth Pact provides the framework for the coordination of national fiscal policies in the European Union. Its primary objective is to safeguard sound public finances. In terms of preventive action, it requires that M ember States outline their medium-term budgetary plans, using the Excessive Deficit Procedure. In recent years, the issue of public debt has been a central issue in the European Semester. The legal ability for European institutions to dictate m atters of public finances has been particularly strong in M ember States that have come under extreme financial distress, particularly the programme countries in receipt of loans from the Troika (International M onetary Fund, European Central Bank and European Commission).
The European Quality Framework on Restructuring (QFR) was launched in 2013 to provide guidelines for restructuring organisations, based on the real experiences of companies. The Commission has called on Member States ‘to explore ways of applying the proposed QFR to public sector employees’. Indeed, the general thrust of the QFR is the involvement of a wide range of actors in the process, something that should be particularly relevant for public sector restructuring.
The other broad policy context is that of demographic ageing, both as regards the ability to meet the dem and for more care an d health services in the immediate future, an d as regards the very significant increase in the age of the workforce in these sectors. All ageing policy initiatives have particular relevance for the public sector.
Key findings
• Employment in the large public services - health and education - continues to grow but there is evidence of an increasing share of private employment in these sectors.
• 800,000 net job losses have been recorded in the core public sector (public administration), which has contracted faster than the overall workforce since 2008. Nineteen of the 28 M ember States
have experienced declining employment levels in the core public sector: the sharpest decline has been in Latvia (-29%), with declines of more than 10% recorded in the UK and France.
• More than one-third of public service workers in Europe are now aged over 50, and the share of older workers has increased by more than five percentage points since 2008 in both the health and public adm inistration sectors. As most job loss occurred in the m ale-dom inated core public sector, public sector employment has become significantly more female-dominated overall.
• Pay reductions or freezes have been most common in the programme countries, Spain, the UK and the Baltic countries, and least common in the Nordic countries and Germany.
• Employment levels in public services are relatively high in the Nordic countries and relatively low in those economies most affected by the crisis - Greece, Ireland, Italy, Portugal and Spain.
• W hile the num ber of workers taking early retirement has declined somewhat in the private sector since the onset of the economic crisis, it has increased in the public sector.
• In terms of the impact of change on the public sector employees, the overall assessm ent from senior public sector executives is quite negative. Out of 16 performance dimensions, 2 of the lowest scores were related to staff motivation and attitudes towards work and the attractiveness of the public sector as an employer. Assessments were particularly negative for these dimensions in France, Italy, Spain an d the UK.
• Evidence from the European W orking Conditions Survey shows that the already comparatively high levels of psychosocial risk in the public sector increase when restructuring h as taken place.
• M uch of the research on recent public sector restructuring finds that the decisions were not well prepared: the processes were carried out in a hasty manner, often not transparent and with limited consultation with the social partners including, in some cases, the employers. There were, of course, exceptions. The very extensive, but consultative, public sector restructuring in Ireland is perhaps the best case at national level.
• The case study evidence indicates, however, that carefully planned and consultative restructuring processes can lead to relatively positive outcomes across m any types of public sector activity and in various institutional settings.
Policy pointers
• It is clear that the public sector will continue to be a topic of major policy concern. The profile of dism issed employees (or those who leave voluntarily) suggests that skills shortages have worsened. Moreover, the demographic challenges are particularly severe in the sector. However, the sector does have great potential to increase its efficiency through more widespread use of information and communication technology.
• The lack of experience of restructuring in the public sector m eans that both the social partners and the labour m arket authorities lack the necessary expertise an d infrastructure to facilitate positive labour market transitions. There are m any positive examples - for example, the public sector job security councils in Sweden - from which valuable lessons could be learnt.
• W hile the public sector has a long tradition in granting staff working time flexibility, job rotation, work sharing, and various career developments, these m easures should be partially re-oriented towards m anagem ent tools for implementing workforce transformation.
• Efforts should be m ade to ensure the skills of dism issed public sector employees are more transparent for potential em ployers. The qualification-based approach should be oriented towards the actual skills of employees.
W hile the public sector provided a buffer for the sharp decline in employment in the immediate aftermath of the recession in 2008, the last five years have seen unprecedented employment decline in parts of the public sector in m any EU Member States. Restructuring in the public sector, the theme of the 2014 European Restructuring Monitor, is not only an extremely topical issue but is also a distinctly different phenom enon from restructuring in the private sector: it is carried out for quite different reasons, it has a very different legal basis and institutional context, and it affects a much wider range of interests in society. It is thus highly political and sometimes controversial.
Indeed, the very nature of employment in the public sector is, in m any respects, quite different from the private sector. This is particularly the case with the activities that have historically constituted the public sector, such as the adm inistration of the state, defence and the observance of the law and the m aintenance of essential infrastructure (transport and utilities). Issues of control, trust and loyalty make very close state involvement logical and, indeed, this is the case in practice in all M ember States. It was this need for control, trust and loyalty that led to the very particular labour codes, wage structures and employment contracts in these core public services. Seniority wages and relatively generous pensions served to promote trust and loyalty. These deferred rewards were made credible by employment contracts that often meant, in practice, a job for life.
After the Second W orld W ar, the public sector grew rapidly with the rise of the welfare state into fields such as social security, social welfare services, education and health. The last two sectors, in particular, grew to employ a very significant portion of the labour force. The reason behind the growth of these services is somewhat different to that of the traditional public services m entioned above. It was, ultimately, driven by the ever-increasing dem and from citizens as incomes grew, or more precisely, by a high income dem and elasticity. The motive for public ownership of these services was based on the one h a n d on the notion that a fair distribution of these services was considered essential for the welfare of citizens and on the other han d from the difficulty in creating competitive markets for such services, where tendencies to monopoly and information asymmetries between consumers and producers were key. In addition, there are significant positive externalities to health an d education that m eant that pure m arket provision would result in a lower level of consum ption than that which was considered socially optimal.
The incorporation of these welfare services into the public sector after the Second W orld W ar led to the partial adoption (with significant variation among Member States) of the employment conditions of the core public services including - and this is of great relevance for this report - considerable employment security. A further com m onality betw een core public services and welfare services is that, unlike the private sector, the reasons behind restructuring are seldom consum er-dem and driven. Indeed, it is often the case that, when overall dem and in the economy declines, the need for m any public services increases. Thus, if austerity-driven public sector restructuring leads to fewer public employees, it can potentially have quite serious consequences for both the remaining staff and the citizens. This is not the case in the private sector when staff are dismissed due to a fall in product demand. The other distinctive feature of public sector restructuring is that the public sector has a higher - in some Member States, appreciably so - trade union coverage than the private sector. This obviously has implications for restructuring processes.
It is very difficult to define the precise nature of the public sector, especially in the case of welfare services and utilities. However, the state is almost always involved, in some way, in ensuring the provision of welfare services - if not by direct service delivery then by subsidising consumption and the regulation of production. In addition, in some countries such as Germany, non-governmental
organisations play a key role and have a somewhat intricate interrelationship with public funding. Moreover, in m any M ember States, the distinction between public and private sectors is becoming increasingly blurred. W hile welfare services and utilities are highly unlikely to be efficiently run and equitably provided by profit-maximising firms alone, private involvement in welfare services has increased significantly in m any cases. This has not been the case for core public services where the role of private actors is obviously less appropriate, and where the opportunities for profits would appear to be significantly less than in, for example, health an d education - where there is a clearly identifiable and in recent times increasing consumer demand. Similar tendencies can be found in the provision of utilities.
Estimates of the num ber of people employed in the public services differ considerably depending on w hether we use the broad, functional definition of ‘services of general interest’ (30%, EU28 - 2013) as indicated in European policy documents, or a narrower focus on those in the core public administration/civil service (7%). In practice, the biggest and fastest-growing employing sectors in the public services are health and education, but evidence points to an increasing share of private employment in these two sectors.
Large cross-country variation in the shares of public service employment relates mainly to different shares of combined education and health sector employment: relatively modest in some lower GDP per head countries such as Romania (<10%) but much larger in higher GDP per head countries, especially those with strong social democratic traditions, such as Denm ark (28%). The share of employment in the core public service does not vary much between Member States, ranging between 5% and 11%, and this share has little correlation with national wealth. Interestingly, those Member States requiring Troika programme assistance (Cyprus, Portugal, Ireland and Greece) or those that faced escalating sovereign debt financing costs in the context of the euro crisis (notably Italy and Spain) tend to have relatively m odest public service employment shares.
There has been a marked divergence in employment trends between the core public sector and the predom inantly state-funded sectors of health and education since 2008. Around 800,000 net job losses have been recorded in the core public sector, which has contracted faster than the overall workforce in this period. This was reflected in the European Restructuring M onitor, which saw a sharp increase in the share of announced job loss in public adm inistration in 2010-2011 when the sector accounted for more than a quarter of all large-scale restructuring job losses. Some 19 of the EU28 have experienced declining employment levels in the core public sector since 2008 with the sharpest decline experienced in Latvia (-29%) and contractions of more than 10% recorded in the UK and France. Meanwhile, the education and health sectors have continued to expand during the peak years of the crisis and afterwards, though at a slowing pace since 2011.
Employment in the public services is skewed towards relatively well-paying jobs and, in particular, jobs requiring well-educated staff. The biggest single job (an occupation in a sector at 2 digit level) in the public services - teaching professionals (education sector) - alone employs almost 10 million people in the EU28, nearly 5% of total employment. During the initial years of the Great Recession (2008-2010), the public services served to stabilise the economy, expanding employment, while the private sector workforce experienced severe job losses. This expansion of employment took place across all job-wage quintiles but with a strong bias towards well-paid jobs. Since 2011, the picture has changed considerably with net job losses experienced in public services, especially in middle-wage jobs. Continued employment growth in well-paying jobs has increasingly been in the private sector rather than the public sector - again, a predictable outcome of fiscal retrenchment and pressures on the public pay bill.
Since public administration is predom inantly male (54%), and the education and health sectors are overwhelmingly female (over 70%), the gender effects of the divergent recent employment trends within the public sector are similar to those in the workforce as a whole. Mainly male sectors have borne the brunt of numerical adjustm ents. The composition of public services employment has, as a result, become more female since the onset of the crisis.
It has also become significantly older, most likely as a consequence of the slowing intake of younger staff, resulting from hiring freezes or widespread implementation of replacem ent ratios for retiring workers. More than one third of public service workers in Europe are now over 50 and the share of older workers has increased by more than five percentage points since 2008 in both the health and public adm inistration sectors. The shrinkage of younger age cohorts in the public services in particular, is likely to negatively affect the generational transm ission of knowledge, in both age directions, with consequences also in terms of the attractiveness of the public services as an employer and ultimately in terms of the efficient delivery of public services.
This report has also looked at the forms and consequences of recent public services restructuring from the point of view of employees and management.
According to data from the fifth European W orking Conditions Survey (EWCS), a higher share of public th an private sector workers (41% v 35%, EU27) reported ‘su bstantial restructuring’ in the previous three years at their w orkplace. From the employee point of view, restructuring in the public sector is associated with m ixed outcom es. On the one h an d, already com paratively high levels of psychosocial risk in the public sector have increased w here restructuring has taken place. A likely contributing factor w as the timing of the survey (2010): after a period of sharp recession, dem ands on em ployees in m any public services are likely to have been high at precisely the time th at staff resources were becom ing limited. On the other hand, restructuring is strongly associated with an increased prevalence of some characteristic ‘high perform ance work organisation’ (HPW O) practices - formal assessm ent, team work, increased work autonom y and a focus on h um an capital developm ent - although public service workers continue to be m uch less likely to report the forms of variable perform ance pay increasingly com m on in the private sector.
Some interesting findings also emerge from the COCOPS survey of senior public service executives.1 One significant finding was that the typical ‘new public m anagem ent’ reforms such as privatisation, flexible employment and contracting out were less likely to be considered important, while measures more associated with a network-oriented understanding of government (cooperation among public sector actors, digital e-government as well as transparent open government) were considered of greater importance.
Unsurprisingly, countries where the fiscal crisis hit h ardest tended to be those in which senior public sector executives indicated the m ost extensive recourse to m easures limiting the public sector pay bill. Two of the four programme countries - Ireland and Portugal - as well as Spain feature at the top of the list for public sector pay cuts or pay freezes, and near the top of the list for hiring freezes. Generally, there was a hierarchy in the prevalence of m easures, which appears to reflect greater political acceptability of, for example, hiring freezes over staff lay-offs, and of pay freezes over pay cuts.
1 COCOPS (Coordinating for Cohesion in the Public Sector of the Future) is a project of the European Commission’s Seventh Framework Programme (FP7).
Cross-country variation was much greater in the pay flexibility m easures (pay cuts and pay freezes - in most cases pay cuts in real terms) than the numerical flexibility m easures (staff lay-offs and hiring freezes). Pay flexibility was much more likely in the programme countries, Spain, the UK and the Baltic countries, and was much less likely in the Nordic countries and Germany.
Recourse to staff lay-offs was the most idiosyncratic of the four m easures in its reported incidence across countries, a n d seem s largely uncorrelated with the other three m easures. Levels were relatively high in the Nordic countries and relatively low in those economies m ost affected by the crisis - Greece, Ireland, Italy, Portugal and Spain.
In terms of the impact of public sector change on the sector employees, the overall assessm ent from the COCOPs data is quite negative. Of 16 performance dimensions, two of the lowest scores related to staff motivation an d attitudes towards work an d the attractiveness of the public sector as an employer. Assessments were particularly negative for these dimensions in France, Italy and Spain an d the UK.
The overall picture to emerge from the different data sources is of an ageing, increasingly feminised public service contracting in terms of its scope of activities and losing some of its former attractiveness as an employer, with workplaces just as likely to be undergoing intensive organisational change as those in the private sector, and where reforms are more likely to be assessed negatively than positively - both in terms of overall job satisfaction of employees and in terms of their perceived effectiveness in improving the delivery of public services.
Just as the motives for public sector restructuring differ from those in the private sector, so do both the processes enacting restructuring and the actors involved. In both these respects, the principal characteristic is th at the public sector is inherently much more political. W elfare services and education are extremely important matters for their clients who make up the entire electorate. Thus all political parties and other interest groups see such matters as being of common concern. Similarly, the social partners, regardless of their sector affiliation, have a wider interest in the welfare services part of the public sector. The industrial relations context is also quite different. The particular nature of employment contracts needs to be noted, as does the fact that trade union density in all Member States is often appreciably higher in the public sector than in the private sector. However, it is the dual role of the state as legislator an d ultimately the employer, the precise nature of which can vary significantly between M ember States and sectors, that sets the entire public sector apart. The distinguishing feature of recent public sector restructuring, in terms of processes and actors, is the impact that the financial crisis and the economic governance of the euro has had on public debt levels and structural deficits. W hile it may be hard to link this governance precisely to specific cases of public sector restructuring, it is reasonable to assum e that there has been some general impact. The impact is, of course, clearer (but still far from conclusive) for the Member States that received loans from the European Commission, the European Central Bank and the International M onetary Fund.
As underlined above, the rationale for public sector restructuring is more complex and affects a wider range of actors than in the private sector, where the profitability of a single com pany is the main driver. This, together with the requirem ents of the political process (including possibly new legislation an d public budgetary decisions) w ould suggest that all likely costs and benefits for all involved parties, including alternative scenarios, should be presented in an objective and transparent way before decisions are taken (Vaughan-W hitehead, 2013). International literature
shows examples of major public restructuring in Sweden and Canada in the 1990s, where making ex-ante programme reviews has provably led to both countries meeting increasing efficiency targets and generating maximum am ount of savings (OECD, 2011). Such well docum ented assessm ents should also be an im portant elem ent in explaining the often complex restructuring rationale for the employees, which the Innovative Restructuring European Network of Experts (IRENE) shows to be of particular relevance in public sector restructuring (IRENE, 2013). Finally, m any of the distinguishing features of public sector restructuring m entioned above, such as the high level of job security, the need for political decisions (possibly legislation) and the broad range of stakeholders may lead to a much longer implementation period in a publicly owned organisation com pared with the restructuring of a private enterprise. The fact that union density is relatively high can both speed up and delay the process.
Labour market
and restructuring trends
Background
Labour markets in Europe appear finally to be stabilising after six years of recession or stagnation. Six million fewer people were at work in the EU28 in 2013 com pared with 2008, an unprecedented decline in employment in the history of the European project. The EU28 unemployment rate has been falling since M ay 2013 although, at 10.4% (April 2014), it rem ains more than four percentage points higher than the US rate. There have also been stark divergences in m acroeconom ic and labour market performance in the EU, especially within the euro zone. A small num ber of countries have experienced a disproportionate share of employment losses during the crisis. There have been declines of at least 10% in seven Member States (Spain, Greece, Portugal, Ireland, Bulgaria, Croatia and Latvia). By sector, m anufacturing and construction were particularly affected (more than eight million jobs lost between them).
These large-scale quantitative transformations of European labour markets have also h ad significant qualitative impacts on the structure of employment. Through its disproportionate impact on male workers, the crisis has accelerated the trend towards more equal gender shares in employment. It has also accentuated the impacts of existing demographic trends on the workplace. It has, for example, raised the age profile of employment: employment growth has occurred in all five-year age groups aged 45 and over (such as 45-49, 50-54) while employment has contracted in all five-year groups aged 45 and under. It has also raised the education profile of workers, as job losses were concentrated among those with middle and low educational attainm ent and new jobs are more likely to be for those people who are higher-skilled. Finally, it has sharpened employment polarisation, principally through its impact on mid-paying jobs prevalent in the sectors where employment fell most dramatically (Eurofound, 2013d).
Figure 1: Part-time and full-time employment growth quarterly year-on-year (,000s), EU28
V N r V fv] ' ;J ' N r \ / /vl V N r V fvl V N r V /v] V N r \ l /v] V N r \ l /vl V N O ' O O O O ' O O O O ' O O O O ' O O O O ' O O O O ' O O O O ' O ^ \ c o c o c o c o o y o y o y o y O O O O ' ~ - ' ~ - ' ~ - ' ~ - ^ V ^ V ^ V ^ V ^ - ) ^ - ) ^ - ) ^ - ) ' s ? ' O O O O O O O O O * * * * * * * * * * * * * * * * * -o o o o o o o o o o o o o o o o o o o o o o o o o o r V rV rV rV rV rV rV rV rV rV rV rV rV rV rV rV rV rV rV rV rV rV rV rV rV rV 4,000 -6,000 -8,000 j Source: EU LFS.
1
13Finally, the crisis has, in particular, significantly reduced the ranks of those with a ‘standard’ or typical job (full-time with a perm anent contract) even in the public sector, as this study will show in the next chapter. New jobs during the crisis have been more likely to be part-time. Indeed, as Figure 1 above illustrates, part-time employment has increased by more than 10% since the crisis began, in the same period as full-time employment decreased by 5%. As part-time work is generally of lower quality, in terms of pay and entitlements, this has negative implications for aggregate job quality. It also implies that real labour inputs (in full-time equivalent terms) have declined by even more than the figure of six million net job losses suggests.
On a positive note, one indicator that employers are beginning to express greater confidence in a durable recovery is that full-time employment grew more than part-time employment in 2014Q1 (year-on-year) for the first time since 2008. This report uses the ERM restructuring events database data, as well as Eurostat’s EU Labour Force Survey, to summarise briefly recent labour market and restructuring developments in the EU. W hile the EU LFS is the most reliable source of information on em ployment levels in Europe, the m ain objective of the ERM is to monitor the employment impact of large-scale restructuring events in European countries, covering both job creation and destruction. Based on media reports across all EU27 countries, it is the single best publicly available source of EU data on the employment impacts of large-scale organisational restructuring.
ERM and redundancies
The ERM defines job loss in restructuring in a similar fashion to the European Directive on Collective Redundancies (98/59/EC) in that it refers to intended redundancies.2 However, the intended redundancies do not have to be notified to any public authority but rather 'announced', either in the media or some other public domain. The thresholds for redundancies are at least 100 jobs or involving sites employing more than 250 people and affecting at least 10% of the workforce. Unlike the Directive, however, there is no stipulation regarding the time in which the intended job loss is to occur.
The ERM dataset comprises more than 18,000 individual restructuring events captured between 2002 an d 2014Q2 a n d a ro u n d 120-150 new cases are ad ded each m onth. The descriptive analysis that follows gives a sum m ary of the most recent developm ents (from 2013Q1 to 2014Q2 inclusive) with some d ata from the earlier post-crisis (2008-2012) and pre-crisis (2002-2007) period for com parison. Between 2013Q1 and 2014Q2, the ERM recorded 2,165 cases of large- scale restructuring in M em ber States, as well as 103 transnational cases. The num ber of cases of an nou n ced job loss was more than 50% higher than th at of ann o u n ced job creation (1,331 cases of anno u nced job loss as opposed to 860 cases of annou n ced job gain).3 Total announced job destruction associated with these cases was more or less proportionately greater than that of job gain (481,000 com pared with arou nd 298,000). Figure 2 below shows the evolution in the m agnitudes of both announced job losses and gains.
2 Council Directive 98/59/EC of 20 July 1998 on the approximation of the laws of the Member States relating to collective redundancies. This directive consolidates Directives 75/129/EEC and 92/56/EEC.
3 Reflecting, in part at least, the fact that the database only started capturing ‘business expansion’ cases during 2004/2005.
Figure 2: Announced restructuring job loss and job gain (,000s) by semester, 2008-2014Q2
Job loss Job gain
Source: ERM.
The most recent data for the first six months of 2014 reflect improving labour market conditions as announced job gains and job losses balance each other out for the first quarter since before the onset of the global financial crisis in 2007/2008. During the peak restructuring period of late 2008 and early 2009, announced job losses were 200,000 to 250,000 greater per semester than job gains. Their recent convergence is mainly attributable to a steady decline in job destruction since the second half of 2012.
Table 1: Share of announced job loss by type of restructuring (%)
Bankruptcy/ closure
Internal restructuring
M erger/
acquisition O ffshoring Relocation O ther Total 2002-2007 15.1 71.7 4.4 5.6 2.9 0.4 100 2008-2012 19.8 72.4 2.9 3.0 0.9 1.1 100 2013-2014 23.4 68.5 3.7 3.1 1.2 0.2 100
Source: ERM, 2002-14q2.
W ith regard to the form of restructuring, one catch-all, residual, category ‘internal restructuring’ accounts for a majority of cases in the ERM dataset before and after the crisis. Around 70% of job losses are attributable to internal restructuring.4 Restructuring due to bankruptcy or closure has continued to account for an increased share of job loss post-crisis com pared to pre-crisis (23% compared with 15%). There were 18 cases of bankruptcy/closure involving at least 1,000 announced job losses recorded on the ERM in 2013-2014. The largest case involved Austrian retail group Dayli whose closure in July and August 2013 followed the largest retail sector insolvency in the country in more than 20 years. Nearly 3,500 jobs were lost.
Cases of offshoring, outsourcing and /or relocation represented a m odest 4% of job loss post-crisis com pared with 9% beforehand. These forms of restructuring, which can involve significant fixed
4 In part, this is because of the way internal restructuring is defined for ERM purposes: where a company ‘undertakes a job-cutting plan, which is not linked’ to the other forms of job-loss restructuring listed in Table 1 above. Correspondents also tend to classify restructuring cases as internal where there may be a mix of restructuring types - such as the closure of some units, offshoring of certain functions - including larger restructuring cases affecting multiple sites or establishments.
investment (in cases of greenfield relocation or offshoring) as well as high-risk strategic commitments (in cases of outsourcing/offshoring), are less likely to have been undertaken in a context of post crisis economic uncertainty. There is some m odest evidence of an increase in offshoring/relocation since 2012. Similarly, the recent share of job loss attributable to merger/acquisitions suggests that corporate merger activity may be strengthening after a crisis-induced lull.
Table 2: Largest cases of job loss/gain by type of restructuring, 2013-2014
Announced Com pany Job loss/
gain Sector
Country/ units affected
Type of
restructuring Notes Nov 2013 Barclays -7,000 Financial
services UK
Internal restructuring
Initial announcem ent o f 1,700 U K job losses expanded to 7,000 in Feb 2014. Jul 2013 Dayli -3,468 Retail AT Bankruptcy Declared bankruptcy in Ju ly 2013 w ith debts
o f € 49.5 m illion. No w h ite knight found. Feb 2014 Mory
Ducros -2,850 Road transport FR
Merger/ Acquisition
Arising from merger of Arcole Industries and Mory Ducros. Dismissed employees supported by an adviser until re-employed
w ith financial support to maintain their form er salary level up to one year. Oct 2013 Lufthansa
Systems -1,000 IT services
DE (Flensburg, Kelsterbach)
Outsourcing Outsourcing o f computer centre and call centre jobs to reduce business costs. M ay 2013 Aviva -800 Call centres
UK (Norwich, Sheffield,
Y o rk, M anchester)
O ffshoring 800 jobs to be offshored to India.
M ar 2013 Astra Zeneca -700 M anufacture: pharmaceuticals UK (Cheshire, London) Relocation
As part of planned relocation from the Alderley Edge and London sites to a new €400m research hub in Cambridge, operational from 2016. 300 jobs also to go to
existing sites outside UK. Sep 2013 GDF Suez 8,000 U tilities FR Business
expansion
Under 'generation contracts' in which w orkers older than 55 are offered a 20%
w orking tim e cut w ith no salary cut in exchange for th eir commitment to engage in on-the-job training for young recruits (<35
years). Tran sn atio nal job loss case
M anufacture: computers
and other technological
hardw are
Major reorganisation as part o f group's 'Vision 2020' plan which envisages savings M ay 2014 Siemens 11,600 W O Internal of €1bn a year by 2016. Job losses to affect restructuring 7,600 positions in sector coordination and 4,000 people w orking on regional cluster
analysis.
Source: ERM 2013-2014.
In terms of case size, medium and small restructuring cases account for an increasing share of total job loss. Large-scale restructurings (>1,000 job losses) accounted for 59% of aggregate ERM job losses in 2002-2007, 51% in 2008-2012 and 38% in 2013-2014. A very similar pattern is also observed for cases of business expansion with a decreasing share of overall announced job creation in large-scale cases (>1000 job gains) and a growing share in smaller and mid-sized cases.
Restructuring and employment shifts by economic sector
M anufacturing is the broad sector that accounts for most announced job losses and job gains in the restructuring events database. By virtue of its case size eligibility thresholds, manufacturing is over-represented in the dataset and accounts for 36% of announced job loss on the ERM in 2
2014 and 31% of announced job gains. Its share has tended to decrease, in particular as regards announced job creation - reflecting its contracting share of overall employment. Around one in six European jobs is now in m anufacturing com pared with one in four in 1980.
Other recent developments regarding job losses have been:
• the increased share of the retail sector post-crisis;
• the major increase in the share of public administration in 2008-2012 (mainly in 2011-2012, coinciding with fiscal retrenchm ent - ‘austerity’ - in m any Member States);
• a significant increase in the share of financial services job losses in 2013-2014, which could be a delayed reaction to the troubles experienced by the sector during the global financial crisis.
Figure 3: Share of announced job loss/gain by broad sector, 2002-2014 (%)
100 90 80 70 60 50 - 40 - 30 - 20 10 0 Job loss 2002- 2008- 2013- 2002- 2008-2007 2012 2014 2007 2012 2013 2014 Job gain ■ Transport/ communication ■ Retail ■ Public administration
■ Other private services
■ Other
■ Manufacturing
■ Financial services
Source: ERM 2002-2014.
On the job gain side, the most obvious development, other than the declining share of manufacturing, has been the growing share of ‘other private services’ (for example, other than retail or financial services), which in 2013-2014 accounted for 27% of announced new jobs. Professional services has been the main engine of employment growth in recent years.
The retail sector h as also been undergoing intensive restructuring activity since 2008 as consum ption p attern s shifted aw ay from established superm arket chains to m ass discount retailers. A com bination of relatively u nconstrained m arket forces, narrow margins an d cross border competition has seen the collapse of some major established retailers such as W oolworths, Arcandor and Dayli an d the rapid rise of groups such as Aldi, Lidl and Ikea. The overall employment outcom e of the ‘creative destruction’ observed in the retail sector has been a net loss of some one million retail jobs (just over 3% of sector employment) since 2008, as can be seen from the EU LFS data in Table 3, below.
Table 3: Employment by sector, EU28, 2008-2013
Sector
Em ploym ent (,000s) Share of to tal emp 2008 2013 D iff % change 2008 2013 A - A gricu ltu re, forestry and fishing 11533 10567 -966 ■ -8 5.2 4.9 B - M ining and quarrying 919 854 -65 -7 0.4 0.4
C - M a n u fa c t u r in g , o f w h ic h 3 8 1 4 3 3 3 4 0 6 -4 7 3 6 H -12 17.1 15.4 CA - M anuf: food, beverages and tobacco 5117 4871 -246 -5 2.3 2.2 CB - M anuf: textiles, clothing, leather 3255 2406 -849 -26 1.5 1.1 CC - M anuf: w ood, paper and printing 3321 2548 -772 -23 1.5 1.2 CD - M anuf: coke, p etroleu m products 244 208 -36 -15 0.1 0.1 CE - M anuf: chemicals 1463 1286 -177 H -12 0.7 0.6 CF - M anuf: pharm aceuticals 800 782 -18 -2 0.4 0.4 CG - M anuf: rubber, plastics etc 3396 2892 -504 -15 1.5 1.3 CH - M anuf: basic m etals 5789 4765 -1024 -18 2.6 2.2 CI - M anuf: computers etc 1731 1580 -151 -9 0.8 0.7 CJ - M anuf: electrical equipm ent 1576 1357 -220 -14 0.7 0.6 CK - M anuf: m achinery etc 3327 3181 -146 -4 1.5 1.5 CL - M anuf: transport 4312 3956 -356 ■ -8 1.9 1.8 CM - M anuf: oth er and repair 3811 3573 -238 ■ -6 1.7 1.6 D - Electricity, gas, steam and air conditioning 1559 1631 72 ■ 5 0.7 0.8 E - W ater supply; sew erage, w aste m anagem ent 1601 1659 59 ■ 4 0.7 0.8 F - Construction 18660 15032 -3628 -19 8.4 6.9 G - W holesale and retail trad e; repair o f motor
vehicles and motor cycles 31657 30669 -988 1 -3 14.2 14.1 H - Transportation and storage 11584 11143 -441 ■ -4 5.2 5.1 I - Accom m odation and food service activities 9400 9715 316 1 3 4.2 4.5 JA - Publishing, broadcasting 2005 1919 -86 -4 0.9 0.9 JB - Telecomms 1435 1121 -314 -22 0.6 0.5 JC - IT and info services 2805 3217 412 15 1.3 1.5 K - Financial and insurance activities 6613 6467 -146 1 -2 3.0 3.0 L - Real estate activities 1666 1769 103 6 0.7 0.8 M A - Legal, accounting, architecture, engineering 7408 8038 630 H 9 3.3 3.7 MB - Scientific research and developm ent 856 902 46 5 0.4 0.4 MC - O ther prof scientific, technical 2173 2532 359 17 1.0 1.2 N - Adm inistrative and support service activities 8067 8786 720 H 9 3.6 4.0 O - Public ad m inistration and defence; compulsory
social security 15737 14962 -774 ■ -5 7.1 6.9 P - Education 15492 16107 615 ■ 4 7.0 7.4 Q A - Hum an health services 12740 13328 589 5 5.7 6.1 QB - Residential care and social w o rk activities 8456 9763 1307 15 3.8 4.5 R - Arts, en tertain m en t and recreation 3442 3547 104 3 1.5 1.6 S - O ther service activities 5405 5432 26 0 2.4 2.5 T - Activities o f households as employer 2543 2583 40 2 1.1 1.2 U - Activities o f extraterrito rial organisations 172 193 21 H 12 0.1 0.1
N o n r e s p o n s e / s e c t o r n o t id e n t if ie d 7 7 6 1 6 1 9 8 4 3 109 0.3 0.7 A ll sectors 222847 216964 -5883 -3 100.0 100.0
Source: EU LFS.
The representative data from the EU LFS confirms m any of the trends at sector level observed in the ERM restructuring data. Since the onset of the crisis in 2008, the largest declines in em ploym ent have taken place in m anufacturing (4.7 million), construction (alm ost 3.6 million), agriculture a n d retail (around 1 million) an d public adm inistration (approaching 800,000). In term s of balancing gains, the only sector to record net em ploym ent growth of more th an one million jobs was residential care an d social work activities (+1.3m). The majority of service sectors continued to add employment though, with some notable exceptions including core governm ent functions (such as public adm inistration a n d defence) which suffered a 5% decline, an d the telecom m unications sector which shed 22% of pre-crisis employment. Growth was fastest in IT and information services (+15%), and in other professional, scientific and technical activities, as well as residential care and social work activities.
W ithin the m anufacturing sector, em ploym ent losses have been m ost severe (>15% of total employment) in basic, low-tech subsectors such as basic metals, textiles, clothing and leather, and wood, paper an d printing while m achinery, food/beverages and pharm aceuticals suffered more m odest employment declines (<5%).
Trends in manufacturing
Much has been written about the recent 'manufacturing renaissance' in the US (see, for example, Celasun et al, 2014; McKinsey Global Institute, 2012). Some modest employment growth since 2010 has seen 800,000 net new jobs created in the sector, and manufacturing output has recovered faster from the Great Recession than in previous (less severe) recessions going back to the early 1980s. Some see this as the re-emergence of a more resilient manufacturing presence in the US, whose supporting props are reduced energy costs (shale), a relatively weak dollar, declining relative labour costs and increasing reluctance to offshore production due to transport costs and strategic reasons (such as production/research and development synergies, proximity to market). There is even some evidence of previously offshoring companies reshoring or backshoring production to the US (The Economist, 2013).
The data from Table 3 shows an altogether gloom ier picture for European manufacturing employment: there has been a contraction of employment in every one of the main sub-sectors since 2008. Even if we exclude the peak crisis period of 2008-2010 and look only at subsequent developments since 2010, only three of the featured sectors in Table 3 have recorded net employment gains (machinery, auto/ transport and computers). These are also the main sectors contributing to the US
manufacturing rebound.
As Figure 4 confirms, manufacturing employment has mounted a modest recovery since 2010 in the US after suffering a sharp contraction in 2008-2010. In the EU, it has continued to decline.
Figure 4: Manufacturing employment, 2008-2013, EU and US 40 35 -30 25 20 15 -10 2008 2009 2010 employment EU % EU (RHS) 18 17 16 2011 2012 2013 --- employment US ...% US (RHS) Source: EU LFS, US-CPS. Note: RHS = right-hand side.
But to look only at recent trend growth ignores some important differences. First, there are more than twice as many workers in manufacturing in the EU28 as there are in the US (33.4 million versus 14.9 million, 2013). This is, in part, due to the EU being more populous and having more people in employment, and partly due to a significantly higher manufacturing share of employment (15.4% of total employment compared with 10.3% in the US in 2013). The accession of CEE countries in 2004-2007, with their extensive industrial infrastructure, not only added substantially to the EU's manufacturing headcount (+9.5m), it may also have served to slow the rate of decline of manufacturing employment in the EU. Cost advantages facilitated the transfer of productive activity within the enlarged EU, which might otherwise have gone elsewhere. Different trends in manufacturing employment in the US and EU may relate to differential cost advantages for labour and energy but, given the declining share of both these factors in overall production costs, a simpler and more likely explanation may be the better labour market and macroeconomic performance in the US in recent years. The modest US manufacturing recovery should also be seen in the context of the sharp rate of contraction of manufacturing employment in the pre-crisis period from 2000-2007 as well as during the peak crisis years, 2008-2010. The recent addition of manufacturing jobs in the US may
merely be a correction after excessive job-shedding, pre- and post-crisis.
Ultimately, the capacity for high productivity growth in manufacturing is the reason for the decline in relative and absolute employment in the developed world, as it was at the beginning of the twentieth century for agriculture. The secular trend is one of contracting manufacturing employment. With new waves of innovation in robotics and automation, the pace of technological change, and associated productivity improvements, is more likely to quicken than to slow down. Technology will continue to displace production jobs and may begin to encroach on other high-skill manufacturing jobs.
In this perspective, the strategic importance of manufacturing is not as a source of employment itself but its value as a stimulus to employment in other sectors both upstream and downstream through strong multiplier effects, as well as its crucial contribution to aggregate productivity growth.
Flows out of employment and reasons why
The recent financial and economic recession led to a strong and persistent increase in unemployment in m any European countries. These effects were sizeable and involved job losses for a large number of people. Overall, the increase in unem ploym ent was mainly due to m any more people exiting employment, whereas reduced transitions from unemployment back into the labour market played a minor role (ECB, 2012).
The aim of this section is to m ap labour m arket dynam ics through an analysis of flows from em ploym ent to non-em ploym ent and, particularly, the reasons why currently non-em ployed individuals left their previous job. In this context, involuntary separations such as those resulting from restructuring are of particular interest. The study will cover a large num ber of M ember States during the last decade (2002-2012).5
There are m any different motivations to explain why individuals change their labour market status and it is worth investigating the reasons for exiting employment. First, the transition from employment to non-employment may be important for individual welfare, since dismissals have been shown to lead to greater instability in future em ployment and earnings and may also lead to worse health outcomes and higher mortality (Eurofound, 2012b; OECD, 2013; Davis and von W achter, 2011). Such negative effects are less likely when the transition to non-employment is made for personal reasons, such as family responsibilities or retirement.
Second, the reasons for transitions to non-em ploym ent are likely to have been strongly affected by the crisis and it is worth attem pting to explore in w hat ways. Third, the relevant information in Eurostat’s Labour Force Survey (LFS) data on the reasons for employment exit has not, to the authors’ knowledge, been comprehensively analysed in previous research. This LFS data has been exploited by Eurofound (Eurofound, 2006), but the present report will conduct a more in-depth analysis with updated data in order to try to address this gap.
Data and methodology
The m ain aim of this analysis is to estimate flows out of employment and, in addition, give the reasons for transitions to non-em ployment according to those interviewed in the EU LFS. In the box below, the methodology applied to estimate transitions from employment to non-employment is explained, as well as other challenges presented by the data.
5 The calculation of the transition rates and other results in this section were performed by Dr Ronald Bachmann and Hanna Frings from Rheinisch-Westfaelisches Institut fuer Wirtschaftsforschung (RMI).
Transition rates from employment to non-employment
The point of departure for the estimate of the transition rates in the EU LFS is a retrospective question enquiring about the labour market status of survey respondents one year before the interview. With labour market status information available for the same person at two points on a timeline, it is possible to calculate transition rates. For example, the transition rate from employment to non-employment is defined as the number of people who were not employed in year t (the year of the interview) who state that they were employed the previous year (t-1) divided by the number employed in t-1. For example:
Transition rate = People not employed in (t) who were employed in (t-1) People employed in (t-1)
While the labour market status information in t-1 is very limited, the information on the destination status (in period t) is much richer. For example, transition to non employment can be disaggregated into transitions to unemployment and to inactivity. Moreover, the EU LFS has further questions addressed only to the non-employed that can be used to specifically ask the reason for leaving that job.
Some caveats are in order regarding the use of the EU LFS data to estimate these transition rates. Ideally, labour market transitions would be best studied by using longitudinal information on individuals over time. Instead, the LFS is a yearly survey conducted each time on a different panel of individuals, who provide information on their current labour market status and retrospective information on their status the previous year. The use of retrospective information means that it is only possible to identify transitions, for example, from employment to non-employment for employees who did not find a new job before the interview took place; in other words, those who remained non-employed for long enough to be observed in that state one year later. Consequently, transition rates from employment to non-employment are underestimated, since those individuals leaving a job but quickly finding a new one before the interview takes place will be coded as employed and their previous transition from employment to non-employment will not be registered in the data.
The weights supplied by Eurostat ensure that the sample is representative over time and between countries. Unfortunately, the labour market status in the previous year is missing for some country/year combinations - and this distorts the cross-country representativeness of the dataset. First, absolute weighted numbers are generally too low and second, insofar as the development in a country with many missing values might have been different to the EU average development, the results may be biased (cross-country representativeness). Therefore, the weights are adjusted according to the number of missing observations. The entire procedure rests on two core assumptions. First, the missing observations are randomly distributed; for example, the same distribution of explanatory variables is achieved through the weighting procedure as would actually be observed. And second, missing years can be modelled as a linear trend between the non-missing years in terms of explanatory variables and in terms of observed labour market transitions.
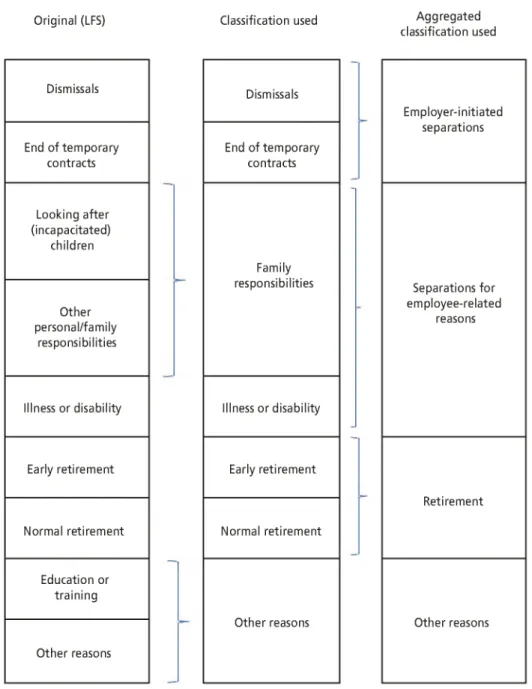
The reasons in the survey are clustered at two levels of aggregation whenever the empirical analysis requires it (due to small sample issues), as set out in Figure 5.
Figure 5: Worker's self-reported reasons for leaving last job
Original (LFS) Classification used Aggregated classification used Dismissals Dismissals Employer-initiated End of temporary contracts End of temporary contracts separations Looking after (incapacitated) children Family Other personal/family responsibilities
responsibilities Separations for employee-related
reasons
Illness or disability Illness or disability
Early retirement Early retirement
Retirement Normal retirement Normal retirement
Education or training
Other reasons Other reasons Other reasons
The analysis will be solely based on Eurostat’s LFS data. But due to data restrictions, especially in the main variable of interest (reason for leaving last job), only 21 EU countries will be covered (EU27 except Ireland, Bulgaria, M alta, Belgium, the N etherlands and Slovakia). The chosen period is that of 2002-2012, permitting a distinction between a ‘pre-crisis period’ (2002-2007) and a ‘post-crisis period’ (2008-2012).
General trends
This section will briefly present some data on transitions from em ployment to non-em ployment. The averages of the yearly transition rates are displayed in Table 4, separately for the pre-crisis
(2002-2007) and the crisis period (2008-2012). The average transition rate from employment to unem ploym ent in the pre-crisis period am ounted to 2.85%, which m eans that 2.85% of all workers who were employed the year preceding the survey were unemployed in the year of the survey during the pre-crisis period. Transition rates into inactivity were slightly higher before the crisis.
Table 4: Yearly transition matrix, before and during crisis (transition rates in %)
D estination
Em ploym ent Self-em ploym ent Unem ploym ent In activity Before crisis 93.03 1.02 2.85 3.1 During crisis 92.32 0.93 3.43 3.32
Source: EU LFS; calculations by Ronald Bachm ann and H anna Frings (RMI).
The crisis has clearly increased transition rates out of employment. W hile a lower proportion of employees moved into self-employment, more of them moved into unem ploym ent an d inactivity, with a significantly greater increase to unemployment.
The logistic regression model was used to quantify the specific effect of various factors on the probability of an employee making such a transition, while keeping constant the effect of all other variables considered in the model. The results can be summ arised as follows:6
• Younger employees (mainly those aged 15-24, but also those aged 25-34) and, especially, employees older than 54 have much higher odds of making a transition out of employment than do mid-age employees.
• Compared with those with mid-levels of education, those employees with a lower (higher) level of education have higher (lower) odds of making a transition out of employment.
• Females show a higher likelihood than males (37% higher) to make a transition out of employment in this multivariate context. However, as will be shown below, men h ad a higher likelihood of making employment to non-employment transitions.
• Compared with employees in the m anufacturing sector, the highest odds of making a transition out of employment are found in extraterritorial organisations, agriculture, construction and the hotel and restaurant sectors. The likelihood is lowest in sectors which are either public or in which the public sector has a large presence (public administration, health, education), electricity, gas and water supply and financial sectors.
• Country dummies are generally very statistically significant. Compared with Austria, the likelihood of making a transition out of employment is greatest in Spain, Latvia, Lithuania and Poland and smallest in Romania, Sweden, Luxembourg and Slovenia.
• Compared with the pre-crisis period, the likelihood of experiencing a transition from employment to non-employment was 15% higher during the crisis period.
• An extended version of the model including household variables was run for countries with available data. Results show that those individuals living with other people who have moved out of unem ploym ent in the same household show higher odds of making a transition out of employment themselves.
6 Detailed results are available from Eurofound upon request.
Reasons for the transitions from employment to non-employment
The reasons people leave their jobs are of great interest as they may have different impacts on the employee’s welfare. For instance, the literature points out that an involuntary job loss (such as a dismissal or as consequence of illness) has large negative consequences for earnings and em ployment probabilities, both in the short and longer term (Eurofound, 2012b; OECD, 2013). This has been shown for a num ber of countries, such as Germany (Bender and von W achter, 2006), Sweden (Eliason an d Storrie, 2006) an d the US (Davis and von W achter, 2011; Farber, 2011). Furthermore, there is evidence that workers who have been displaced in the past are more vulnerable to subsequent m acroeconomic shocks (Eliason and Storrie, 2006), and that the macroeconomic conditions at the time of displacem ent greatly affect the costs of displacem ent (Davis and von W achter, 2011). W ith respect to involuntary reasons for leaving the previous job, the literature highlights the importance of the end of temporary contracts. In particular, workers on a temporary contract are generally more prone to becoming unem ployed than workers on regular contracts (Verick and Islam, 2010). In contrast, leaving a job voluntarily, for instance to take up another job, due to family reasons or in order to retire, may well lead to an improvement in welfare. Moreover, since the business cycle influences individuals’ labour market behaviour, it is likely also to affect the reasons behind different labour market transitions.
In this section, the reasons for leaving a job to non-em ployment are analysed using the relevant data in the EU LFS, which, to date, has been barely exploited. Figure 6 presents the average annual transition rates in the pre- and post-crisis periods for EU21. Even before the crisis the highest transition rates were due to dismissals and temporary job endings and these same two categories are the ones registering the strongest increase during the crisis. The transition rates due to family responsibilities, own illness or disability, early and normal retirement were at a lower level before the crisis and barely increased during the crisis (only own illness or disability did so in a meaningful way). It is particularly relevant, and striking, that the crisis did not lead to an increase in early retirement. W hile this can be surmised from other data (for example, the strong employment performance of older workers in recent years), this analysis provides hard evidence.
Figure 6: Transition rates from employment to non-employment, by reasons for leaving a job (%)
. I
Dismissals Family responsibilities Early retirement
■ pre-crisis X during crisis
Source: EU LFS; calculations by Ronald Bachm ann an d H anna Frings (RMI).