Liu, Yonqian and Sun, Ying and Infield, David and Zhao, Yu and Han,
Shuang and Yan, Jie (2016) A hybrid forecasting method for wind power
ramp based on Orthogonal Test and Support Vector Machine (OT-SVM).
IEEE Transactions on Sustainable Energy, PP (99). pp. 1-7. ISSN
1949-3029 , http://dx.doi.org/10.1109/TSTE.2016.2604852
This version is available at http://strathprints.strath.ac.uk/57940/
Strathprints is designed to allow users to access the research output of the University of Strathclyde. Unless otherwise explicitly stated on the manuscript, Copyright © and Moral Rights for the papers on this site are retained by the individual authors and/or other copyright owners. Please check the manuscript for details of any other licences that may have been applied. You may not engage in further distribution of the material for any profitmaking activities or any commercial gain. You may freely distribute both the url (http://strathprints.strath.ac.uk/) and the content of this paper for research or private study, educational, or not-for-profit purposes without prior permission or charge.
Any correspondence concerning this service should be sent to Strathprints administrator: [email protected]
Abstract-- In an electric power system with a high penetration of wind power, incoming power ramps pose a serious threat to the power system. To adopt suitable response strategies for wind power ramps, it is important to predict them accurately and in a timely manner. Since power ramps are caused by various factors, their occurrence have irregular characteristics and vary by location, bringing great difficulty in forecasting. To solve this problem, a hybrid forecasting model OT-SVM (Orthogonal Test and Support Vector Machine) was developed in this paper, which combines an orthogonal test with a support vector machine. A novel factor analysis method was established based on the theory of the orthogonal test (OT), and applied to determine the optimal inputs of a support vector machine (SVM). The effectiveness of OT-SVM was tested with three wind farms in China, while comparing the results with other related methods. The results show that the proposed OT-SVM has the highest accuracy covering different input numbers and time resolutions. In addition, a novel evaluation index MAI (Mean Accuracy Index) was proposed, considering both the missed ramps and false ramps, which can be used as a supplementary index for CSI.
Index Terms—Wind power ramp forecasting, Multi-factor analysis, Large-scale integration of wind power, Meteorological factors, Orthogonal test, Statistical analysis, Support vector machine
I. INTRODUCTION
With the continuous increase of wind power penetration into electric power systems around the world, wind power fluctuation has the potential to undermine the safe and stable operation of a power system. Large changes in wind power generation, namely wind power ramps, may be fed into a power system within a short time period, which can affect the balancing of the grid, and at worst cause large-scale blackouts. Power system operators can offset these challenges by holding more generation reserve or energy storage [1-7], but this is
This work was supported in part by National Nature Science Foundation of China (Grant No. 51376062) and technological project from State Grid Corporation of China.
Y. Q. Liu is with Renewable Energy School, North China Electric Power University, Beijing, China. ([email protected])
Y. Sun is with Renewable Energy School, North China Electric Power University, Beijing, China. ([email protected])
D. Infield is with the department of Electronic and Electrical Engineering, University of Strathclyde, UK. ([email protected])
Y. Zhao is with Renewable Energy School, North China Electric Power University, Beijing, China. [email protected])
S. Han is with Renewable Energy School, North China Electric Power University, Beijing, China. ([email protected])
J. Yan is with Renewable Energy School, North China Electric Power University, Beijing, China. ([email protected])
costly. In order to adopt the most suitable response strategies for wind power ramps [8-13], it is important to predict them accurately and in a timely manner.
There are two main approaches to wind power ramps forecasting: indirect forecasting and direct forecasting. For the indirect method, conventional wind power forecasting is applied and the information denoting wind power ramps is extracted. A wind power prediction model, based on a neural network method, was established by Cui et al. [14] which forecasts wind power for different scenarios, so as to provide wind power ramp statistics for ramp swing, ramp start time and ramp duration. For the direct method, the wind power ramp rate, or a parameter related to wind power ramps, is forecast directly. Support Vector Machines (SVM) were found to be the most accurate method by Zheng and Kusiakm after comparison of five different algorithms [15]. A combinatorial forecast method known as atom sparse decomposition (ASD) and a back propagation neural network (BPNN) was proposed by Cui et al. [15, 16]. This method avoids the effect of instability of the original signal on the predicted result and greatly improves the precision by decomposing the original signal before its prediction and replacing the residual signal for the original signal as an input to the BPNN. On this basis, Zareipour et al. [17], predicted the severity classification of wind power ramps directly using a SVM as a classifier, providing useful power ramp information for power system scheduling.
So far, the main reason for the low accuracy of wind power ramps forecasting, is that the occurrence characteristics of wind power ramps are not yet well understood. Sevlian and Rajagopal analyzed the probability distribution of key ramp parameters (ramp rate, ramp swing and duration of ramps) and their joint probability distribution [18]. Heckenbergerova et al. focused on changes in wind power and wind speed immediately before a ramp event occurs, providing a new basis for its detection and forecasting [19]. As for extreme wind power ramps with the greatest impact on the power system, two extreme value analysis methods (Annual Maxima Series method and Peaks Over Threshold method) were proposed by Ganger to analyze their probability distribution [20], which overcame the limitations of the traditional analysis method and makes the analysis more precise. Wind power ramps are influenced by various factors such as weather conditions, time of year, time of day, etc. The distribution of wind power ramps in different seasons and time of the day, were statistically analyzed by Kamath, who pointed out that the rules are different for different geographical locations [21]. The connection between wind power ramps and extreme weather
A hybrid forecasting method for wind power
ramp based on Orthogonal Test and Support
Vector Machine (OT-SVM)
conditions was proposed at an early stage by Ferreira et al. [22], and several extreme weather conditions were proposed that may trigger wind power ramps: frontal systems, thunderstorms and low level jets. Using principal component analysis (PCA) and cluster analysis, Couto et al. [23] identified that six types of weather system predominantly trigger wind power ramps. The effect of switching process between these weather systems on wind power ramps were also discussed, providing an effective basis for a wind power ramps warning system. In addition to the weather factors discussed above, wind power ramps are also affected by many other factors such as geographical location. Several factors, which are more closely related to wind power ramps were explored by Kamath using a data mining feature extraction technique [24].
In conclusion, wind power ramps are affected by various factors [25-27], which vary by location. The identification of the dominant factors of wind power ramps will greatly improve their forecasting accuracy. However, there is a great lack of research in this area.
To address these issues, a hybrid forecasting model OT-SVM (Orthogonal Test-Support Vector Machine) was developed in this paper by combining an orthogonal test (OT) with a support vector machine (SVM). Section describes the definition of wind power ramps. Section presents the proposed OT-SVM model as well as its theoretical basis. The effectiveness of OT-SVM was tested by comparing it with other models, alongside 3 case studies, which are presented in Section . Finally, some conclusions are drawn in section .
II. WIND POWER RAMPS
In as early as 2008, the Canadian scholars Focken and Lange pointed out that wind power ramps events refer to the large fluctuations in wind power output over a very short period of time, typically half an hour to several hours [28]. Although
there isn’t an agreed definition of what constitutes a wind power ramp [29-31], it is most common to specify the ramp time interval and ramp range. In this paper, an empirical and most commonly used definition was adopted as follows. Definition: when the change of wind power surpasses a set threshold value,
P
threshold , during the time interval
t
, i.e.threshold P t t P t P t t P t P(), ( )]min[ (), ( )] max[ (1)
it is considered to be a wind power ramp event.
In the above definition, the time interval
t
usually ranges from 30 minutes to 4h in the literature; the ramp amplitude threshold,P
threshold , is usually set as a certain percentage of wind power installed capacity. In this paper, the time interval
t
is taken as 30 minutes, whereas thresholdP
thresholdis adopted as 10% of the installed wind capacity.
Although definition (1) is one of the most commonly used definitions in the forecasting of wind power ramps, it has some disadvantages and needs to be improved in future, which has been mentioned in Section . In this paper, our forecasting goal is to determine if there are any fluctuations in wind power output surpassing 10% of the installed capacity in the next 30 minutes.
Wind power ramps forecasting model OT-SVM A. OT (Orthogonal Test)
Orthogonal tests are an effective means of multi-factor analysis [32], and lend themselves in assessing the impact of relevant factors on an experimental index, to rank them in terms of their effect. Orthogonal tests are undertaken by selecting a representative sample of test points from a large amount of data, having the characteristics of being evenly dispersed across the data set and being easy to compare. An orthogonal test is designed based on an orthogonal table, which has an advantage of being easy to implement, for comparing the effective strength of different factors to be compared quantitatively [33-34].
There are two types of orthogonal test design: the Range Analysis method (also called intuitive analysis) and the Variance Analysis method (also known as statistical analysis). Compared to the latter, the former avoids a series of complicated processing calculations without reducing the statistical significance, making it more practicable and widely applied in industry and agriculture. Hence, the Range Analysis method was chosen for the analysis and it is presented here. B. SVM (Support Vector Machine)
Suppose a set of data {(xi, yi)}(i=1,2,...,m), where xi is the input vector, yi is output data for the corresponding target, and N is the size of the samples. The estimating function takes the form as follows:
b
x
w
x
f
(
)
(
(
))
(2)where is the weight vector while b is a deviation. There are two training parameters. But the nonlinear mapping function
)
(x
is generally selected by trial and error and chosen fromseveral templates.
This leads to the optimization problem for standard SVM.
T i i i m i x x f y L c m c R 2 1 ) ), ( ( 1 ) , ( 1 (3) here the first part is the experience error term and the second part is regularization. The regularization constant c is used to balance the relationship between the two errors, in which: others x f y x f y x f y x x f y L , ) , ( ) ( , 0 ) ( ) ), ( ( (4)
Because the dimension of the feature space is too large and the objective function is not differentiable, it is almost impossible to solve the above equations directly. Introducing the kernel function K(x,xi) which can transform the problem above into the dual problem, the equations can be solved by usage of a double programming method:
m j i i i m j i i i j j m i m j i i a ai i a a a a kxx a a y a a 1 1 1 1 * , ( *)( *) ( , ) ( *) ( *) 2 1 max (5)
] , 0 [ * , 0 *) ( . . 1 c a a a a t s i i m j i i (6)Therefore, the original regression function expression can be written as follows:
b
x
x
k
a
a
a
a
x
f
i m i i i i i
)
,
(
*)
(
*)
,
,
(
1 (7) where K(x,xi) are the kernel functions. The selection of kernel function determines the characteristics of the spatial structure. Generally, the commonly used kernel function is selected, based on the best experience. In this paper, a RBF kernel function is applied.C. OT-SVM model
For wind power ramps forecasting, the accuracy can be greatly affected by selecting the inputs to the forecasting model. However, the dominant characteristics of wind power ramps vary significantly by location. To solve this problem, this paper presents a hybrid prediction method OT-SVM (Orthogonal Test and Support Vector Machine) that utilizes a combination of an orthogonal test (OT) and a support vector machine (SVM). An orthogonal test (OT) is applied to select the factors with closest relation to wind power ramps, and optimize the inputs to the SVM model, in order to achieve the highest accuracy of wind power ramp forecasting.
The procedure of the OT-SVM model is described below, which is composed of five specific steps:
Step 1 (Data preprocessing): Some fluctuations of wind
power are intentional such as power curtailment, and maintenance and repair of wind turbines. Some result from faulty transducers or data transfer. Erroneous data caused by the factors above, need to be adjusted according to the wind turbine power curve [12]. In this way, the consecutive and representative power series can be obtained.
Step 2 (Factors expansion): More parameters are explored,
which affect the fluctuation features of the meteorological information. These can be calculated as follows:
Assume M(t)is a time series of a meteorological parameter (wind speed, wind direction, temperature, pressure, or relative humidity). To explore more meteorological information based on the given NWP meteorological data, the following parameters are calculated:
Mean value:
N i t M N t M 1 ) ( 1 ) ( (8) Range value: )] ( ), ( min[ )] ( ), ( max[ ) (t M t t M t M t t M t MR (9) Standard deviation: 2 1 )) ( ) ( ( 1 ) ( M t Mt N t M N i sd
(10) Difference value: M(t)M(t)M(tt) (11) Where M(t) can be the wind speed (v), wind direction (
), temperature (T), pressure (P), or relative humidity (H) at time point t,
t
is the time interval as given in definition (1) and N is the number of time points during a time interval
t
.Step 3 (Ramp calculation): Based on the wind power data,
ramp series can be obtained as follows:
)] ( ), ( min[ )] ( ), ( max[ ) (t Pt Pt t Pt P t t r (12)
where r(t) refers to power ramp at time point t;
)]
(
),
(
max[
P
t
P
t
t
andmin[
P
(
t
),
P
(
t
t
)]
indicate themaximum value and minimum value of wind power respectively.
Step 4 (Factor analysis with orthogonal test): Compare the
impact of various meteorological parameters on the ramp value quantitatively, based on orthogonal test theory.
Take each time point as a trial of the whole orthogonal test, where the meteorological parameters can be seen as the factors, and the ramp value can be seen as the test results. The sample size of the time sequence is the number of trials. In this way, the impact of these factors on wind power ramps can be quantitatively compared from an extensive database of experiments based on orthogonal test theory, and their importance can be ranked.
After the factors (meteorological parameters) of the experimental index (wind power ramp) is determined, these factors can be classified into a number of grades according to specific requirements. Then, the orthogonal table can be designed, which is based on Combinatorial Mathematics theory [35]. In the orthogonal table, the first column indicates the experiment number and the first row indicates the factors to be analyzed (wind speed, wind direction, pressure and relative humidity etc.). The remaining numbers indicate the grade number assigned to each factor. The orthogonal table is designed according to the principle that all the possible situations are considered for any two factors. An example of a 3 factor-2 grade level orthogonal test is shown in table 1.
TABLEI
Orthogonal Table of 3 Factor - 2 Level
factor test A B C Result 1 1 1 1 y 111 2 1 2 2 y 122 3 2 1 2 y 212 4 2 2 1 y 221
After the orthogonal test is completed, the effect of various factors on wind power ramps can be quantitatively analyzed as follows:
Assume Kjm as the mean value of power ramp when the
factor j is at its mth grade, then its range value for different grades can be calculated.
Define Rj as the range of
K
jm for factor j:)
,
,
min(
)
,
,
max(
j1 j2 jm j1 j2 jm jK
K
K
K
K
K
R
(13)Rj reflects the impact strength of factor j on the wind power ramp; the larger Rj, the larger the difference in ramp values at its different grades, indicating the greater influence of factor j on the wind power ramps. In this way, the various factors can be ranked in terms of effect strength according to Rj.
Step 5 (Ramp prediction with SVM): A number of important
factors are taken from the data as the inputs to the SVM to predict the wind power ramp events (the inputs number can be determined according to the specific case).
The schematic diagram of the proposed forecasting model is depicted in Fig. 1.
Meteorological information Wind power
Orthogonal test Expanded factors information Wind power ramp series
Importance order of the factors
Predicted ramp Select the first i
factors
SVM model
Accuracy meets the requirement?
Finish i = i + 1 Input = i i = 1 Yes No Outputs Inputs Data prepocessing Factors expansion
Fig. 1: Flow diagram of OT-SVM
III. CASE STUDY
Three cases in this section were applied to illustrate the proposed model; the first case of which is presented in detail, and the other two are briefly introduced in the last part of this section.
A wind farm in Northern China has been used in Case 1 with the measured power and predicted meteorological data from NWP (Numerical Weather Prediction) from 1st January, 2014 to 31st December, 2014 with a time interval of 10 minutes. The meteorological information includes wind speed, wind direction, temperature, pressure, and relative humidity. A. Data processing
From the 5 meteorological parameters obtained in Case 1 (wind speed, wind direction, temperature, pressure, and relative humidity), 25 meteorological parameters were available as the inputs of the prediction model, including 5 original parameters and 20 (
4
5
20
) additional ones obtained by formulae (8) - (11).B. Models comparison
In addition to the Orthogonal Test (OT), there are some other methods of factor analysis. Currently, the most common factor analysis methods are: Correlation Coefficient Analysis, Grey Correlation Degree Analysis, and Principle Components Analysis. To test the effectiveness of the proposed OT-SVM model, these three other methods have been applied for comparison purposes as follows:
S-SVM (Spearman-Support Vector Machine): uses the
spearman correlation to select the parameters most related to
the ramp series as the inputs of SVM, and then predicts the future ramp values based on SVM.
GCD-SVM (Grey Correlation Degree-Support Vector
Machine): uses the grey correlation to select the parameters most related to the ramp series as the inputs of SVM, and then predicts the future ramp values based on SVM.
PCA-SVM (Principal Components Analysis--Support
Vector Machine): uses PCA to identify the principal parameters among all the given meteorological parameters, and then predicts the future ramp values based on SVM with these principal parameters as the inputs.
It is clear that the only difference among these models lies in the input selection technique, making them easy to compare. C. Evaluation indices
In contrast to wind power forecasting, RMSE (Root Mean Square Error) cannot capture the sudden change of wind power effectively, and so cannot reflect the accuracy of wind power ramp event identification properly. In this case, three evaluation indices aimed at ramp events forecasting are applied: FA (Forecast Accuracy), RC (Ramp Capture) and CSI (Critical Success Index), and a new evaluation index MAI (Mean Accuracy Index) is proposed [36].
Among the indices mentioned above, FA, RC, and CSI are defined, based on three outcomes of each observed/predicted ramp events as percentages:
TF (True Forecast): a ramp event is observed and predicted
within a specific time interval.
FF (False Forecast): a ramp event is predicted but not
observed.
MR (Missed Ramp): a ramp event is observed but not
predicted.
Henceforth, the definitions are as follows: MR TF TF RC (14.a) FF TF TF FA (14.b) MR FF TF TF CSI (14.c) RC and FA can reflect the hit percentage of the observed ramps and the correct percentage of the predicted ramps, respectively. In general, there is an inverse relationship between RC and FA, meaning that the highest RC and FA cannot be achieved at the same time, and neither of them can be used to indicate the accuracy of ramp events forecasting alone. Compared to RC and FA, CSI can assess the accuracy of ramp events forecasting more comprehensively, which considers both the false and missed ramps. However, it is affected much more severely by the lower values of RC and FA. To overcome this problem, a new accuracy evaluation index MAI (Mean Accuracy Index) has been proposed:
) ( 2 1 FA RC MAI (15) D. Result analysis
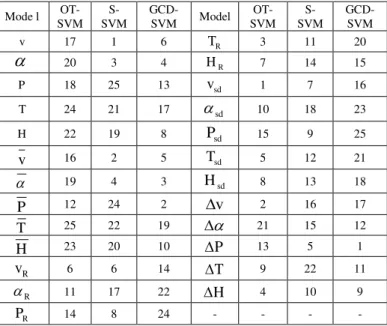
The importance order of 25 parameters obtained through OT-SVM, S-SVM, and GCD-SVM are shown in table (for the PCA-SVM model, the most dominant parameters can be
obtained, but their importance order cannot be seen after coordinate transformation).
TABLE
IMPORTANCE ORDER OF 25 METEOROLOGICAL PARAMETERS OBTAINED IN
EACH MODEL
(In this table, V,
, T, H, P refer to wind speed, wind direction, temperature, relative humidity and pressure, respectively. M ,M,M , and R M refer to original value, mean value, standard deviation, range value and fist difference value, respectively. The numbers indicate the order of importance)
Mode l OT-SVM S-SVM GCD-SVM Model OT-SVM S-SVM GCD-SVM v 17 1 6 TR 3 11 20
20 3 4 HR 7 14 15 P 18 25 13 vsd 1 7 16 T 24 21 17
sd 10 18 23 H 22 19 8 Psd 15 9 25 v 16 2 5 Tsd 5 12 21 19 4 3 Hsd 8 13 18 P 12 24 2
v
2 16 17 T 25 22 19
21 15 12 H 23 20 10 P 13 5 1 R v 6 6 14 T 9 22 11 R 11 17 22 H 4 10 9 R P 14 8 24 - - - -It is shown in Table that the fluctuation features of the meteorological parameters have a great effect on wind power ramps, which could be useful in wind power ramp prediction. Different importance orders are obtained for the 25 meteorological parameters in different models.
To compare their effectiveness, the first few factors obtained in each model were selected as the inputs to the SVM to predict the ramp events, and the results are summarized in Table III with 12 hours forecasting resolution. Due to that the input number also has an effect on the prediction accuracy, the effective of these models were compared with 8, 9, and 10 inputs, respectively.
TABLE III
RAMP EVENTS PREDICTION WITH 12H-RESOLUTION
input Index RC (%) FA (%) CSI (%) MAI (%) 8 inputs OT-SVM 98.6 93.6 92.4 96.1 S-SVM 92.0 95.8 88.5 93.9 GCD-SVM 95.4 94.6 90.5 95.0 PCA-SVM 86 96.5 83.4 91.3 9 inputs OT-SVM 98.6 93.6 92.4 96.1 S-SVM 93.7 98.1 89.4 95.9 GCD-SVM 96.0 94.4 90.8 95.2 PCA-SVM 91.2 96.4 88.2 93.8 10 inputs OT-SVM 99.2 93.9 93.2 96.6 S-SVM 92.0 95.3 88.0 93.7 GCD-SVM 96.9 94.1 91.4 95.5 PCA-SVM 87.5 93.9 82.7 90.7
It is shown in Table III that there is an obvious difference of the forecasting accuracy among these four models. The comprehensive evaluation indices (CSI and MAI) are highest for the OT-SVM model with different input numbers. With all these input numbers, OT-SVM has higher RC value than FA, showing that it has less chance to miss the real ramp event than capture a false ramp event.
Besides, the optimal input number for the models above is different, for achieve the highest accuracy of ramp events forecasting. OT-SVM and GCD-SVM have the highest forecasting accuracy with 10 inputs, while S-SVM and PCA-SVM have highest accuracy with 9 inputs. It means that there is no positive relationship between the accuracy and input number, so the optimal input number needs to be determined based on the specific forecasting models.
To further compare the forecasting effectiveness of these four methods for ramp events, figure 2 (a) and figure 2 (b) depict the comprehensive evaluation index CSI and MAI for ramp events forecasting under different time resolutions with 12 inputs, respectively.
Fig. 2 (a):CSI for different forecasting methods under different resolution
Fig. 2 (b):MAI for different forecasting methods under different resolution
Fig. 2 shows that with the increase of time resolution from 0.5 hour to 24 hours, the comprehensive evaluation indices values (CSI and MAI) have both improved for all the four methods.
From the distribution of CSI and MAI, it can be seen that under each resolution, OT-SVM has the highest accuracy for ramp events forecasting, demonstrating that OT can better determine the key factors of wind power ramp events and select the suitable inputs for the SVM model, so as to improve its accuracy. And OT-SVM has the most obvious advantage over other methods for a time resolution of 12 hours. Besides, the CSI and MAI have the similar tendency to change with the
time resolution increases for all the models, indicating that the proposed MAI can be used as the additional evaluation index for ramp events forecasting.
To further verify the effectiveness of OT-SVM, data from two other wind farms was used, which are located in the north and east of China, respectively. The measured power and NWP predicted meteorological data used in Case 2 and Case 3 were from 1st January, 2011 to 31st December, 2011 and 1st May, 2011 to 30th April, 2011, respectively, with a time interval of 5 minutes. The forecasting results of these two cases were shown in table IV.
TABLE IV
(A) RAMP EVENTS PREDICTION (CASE 2)
Resolution OT-SVM S-SVM GCD-SVM PCA-SVM 6h CSI 87.0% 74.9% 86.8% 86.8%
MAI 93.5% 87.5% 93.4% 93.4% 12h CSI 98.3% 89.0% 98.1% 98.2% MAI 99.2% 94.5% 99.0% 99.1%
(B) RAMP EVENTS PREDICTION (CASE 3)
Resolution OT-SVM S-SVM GCD-SVM PCA-SVM 6h CSI 71.4% 66.3% 69.1% 69.2%
MAI 85.7% 83.1% 84.6% 84.6% 12h CSI 90.9% 85.7% 90.0% 90.0% MAI 95.5% 92.5% 94.9% 95.0%
It is shown in table IV that for Case 2 and Case 3, OT-SVM still has a higher CSI and MAI than other models with different time resolutions, demonstrating the advantage of OT-SVM in power ramps forecasting.
From all the cases above, it can be seen that the forecasting accuracy of wind power ramps is different for the different wind farms, which is caused by the different errors brought by NWP. Besides, it should be noted that in Case 2 and Case 3, only the predicted wind speed and wind direction data were
provided, that’s why the advantage of OT-SVM over other models were not as obvious as Case 1.
IV. CONCLUSIONS
In this paper, a hybrid forecasting model OT-SVM is presented for power ramp events, and a novel evaluation index is also presented. The feasibility and effectiveness of the proposed model was illustrated with three wind farms in China. The main conclusions are drawn as follows:
(1) Compared to the other three models, OT-SVM has the highest accuracy for ramp events forecasting with different input numbers in all the wind farms.
(2) With the increase of time resolution from 0.5 hour to 24 hours, the forecasting accuracy can be improved for each method. And OT-SVM has the highest accuracy at each time resolution, demonstrating that OT can determine the key factors of wind power ramp events among these four factors analysis methods, in order to select the optimal inputs of SVM. (3) The proposed forecasting evaluation index MAI (Mean Accuracy Index) can assess the accuracy of ramp events prediction comprehensively and accurately, considering both
the missed ramps and false ramps, which can be used as a supplementary index for CSI.
(4) The ramp events are not only affected by the meteorological parameters themselves but also by their variation characteristics. More meteorological information is necessary to improve their forecasting accuracy.
The proposed model is generally applicable and not constrained to specific geographical and meteorological conditions, making it possible to guarantee the accuracy of wind power ramps forecasting for different wind farms, in order to provide valuable information and assist the operation of power systems with high wind penetrations.
The future work is focused around the application of better definitions of wind power ramps in order to detect and forecast complex patterns. In order to provide more detailed forecasting information for the power system, one feasible method is to use multiple-scale detections (models of different resolutions) to yield more accurate and dependable results.
V. ACKNOWLEDGMENT
The authors gratefully acknowledge the financial support from National Nature Science Foundation of China (Grant No. 51376062) and technological project from State Grid Corporation of China.
VI. REFERENCES
[1] G. M. España et al., “Power-Capacity and Ramp-Capability Reserves for Wind Integration in Power-Based UC,” IEEE Trans. Sustainable Energy., vol. 7, no. 2, pp. 614–624, Apr. 2016.
[2] Y. Z. Qi and Y. T. Liu, “Ramping coordination control of wind
generation based on competitive game theory,” Proceedings of the
CSEE, vol.34, no. 25, pp. 4341-4349, Sep. 2014.
[3] Y. Z. Qi and Y. T. Liu, “Finite control of high risk wind power
ramping,” Proceedings of the CSEE, vol.33, no. 13, pp. 69-74, May. 2013.
[4] M. O. Vazquez and D. Kirschen, “Estimating spinning reserve requirements in systems with significant wind power generation
penetration,” IEEE Trans. Power Syst., vol. 24, no. 1, pp. 114–124, Feb. 2009.
[5] H. Holttinen et al., “Methodologies to determine operating reserves due
to increased wind power,” IEEE Trans. Sustain. Energy, vol. 3, no. 4, pp.
713–723, Oct. 2012.
[6] L. Yang and C. C. Zhang, Study on control strategy of wind power ramping, Electrical Measurement Instrumentation, vol. 52, no. 7, pp. 30-34, Apr. 2015.
[7] Y. Wang, K. F. Zhang, J. Y. Fu, et al., “Optimization control method of
wind /storage system for suppressing wind power ramp rate,”
Automation of Electric Power Systems, vol. 37, no. 13, pp. 17-22, Jul. 2013.
[8] L. Soder et al., “Experience and challenges with short-term balancing in
European systems with large share of wind power,” IEEE Trans. Sustain.
Energy, vol. 3, no. 4, pp. 853–861, Oct. 2012.
[9] N. Navid and G. Rosenwald, “Market solutions for managing ramp
flexibility with high penetration of renewable resource,” IEEE Trans.
Sustain. Energy, vol. 3, no. 4, pp. 784–790, Oct. 2012.
[10] Estanqueiro, L. Rodrigues, and A. Couto, “Experimental study on the
wind power variability and smoothing effect,” Elect. Eng. Res., p. 9, Jul.
2013, to be published.
[11] L. Li, Y. Q. Liu, Y. P. Yang, S. Han., Y. M. Wang, “A physical approach of the short-term wind power prediction based on CFD
pre-calculated flow fields,” Journal of Hydrodynamics, vol. 2, no. 1, pp. 56-61, Feb. 2013.
[12] Y. F. Wang and N. Chen, “Impact of WRIG and DFIG wind generation
ramping down on independent power systems,” Proc. IEEE PES/IAS
[13] M. J. Cui, et al., “Wind power ramp event forecasting using a stochastic
scenario generation method,” IEEE Trans. Sustain. Energy, vol. 6, no. 2,
pp. 422–433, Apr. 2015.
[14] H. Zheng and A. Kusiak, “Prediction of wind farm power ramp rates: A data-mining approach,” J. Solar Energy Eng., vol. 131, no. 3, pp. 031011–031018, Jul. 2009.
[15] M. Cui, J. Zhang, A. R. Florita, B. M. Hodge, D. Ke, Y. Sun, “An Optimized Swinging Door Algorithm for Identifying Wind Ramping
Events,” IEEE Trans. Sustain. Energy, vol. 7, no. 1, pp. 150–162, Jan. 2016.
[16] M. J. Cui, Y. Z. Sun, and D. P. Ke, “Wind power ramp events forecasting based on atomic sparse decomposition and BP neural
networks,” Automation of Electric Power Systems, vol. 38, no. 12, pp.
6-11, Jun. 2014.
[17] H. Zareipour, D. Huang, and W. Rosehart, “Wind power ramp events
classification and forecasting: A data mining approach,” in Proc. IEEE
Power Energy Soc. Gen. Meeting, 2011, pp. 1-3.
[18] R. Sevlian and R. Rajagopal, “Detection and statistics of wind power
ramps,” IEEE Trans. Power Syst., vol. 28, no. 4, pp. 3610–3620, Nov. 2013.
[19] J. Heckenbergerova, et al., “Analysis of wind speed and power time
series preceding wind power ramp events,” in Proc. Of Electric Power
Engineering. Conf. Expo., Brno May. 2014, pp. 279–283.
[20] D. Ganger, “Statistical Characterization of Wind Power Ramps Via
Extreme Value Analysis”, IEEE Trans. Sustain. Energy, vol. 29, no. 6,
pp. 3118-3119, Nov. 2014.
[21] C. Kamath, “Understanding wind power ramp events through analysis
of historical data,” in Proc. Transm. Distrib. Conf. Expo., New Orleans, LA, USA, 2010, pp. 1–6.
[22] C. Ferreira, J. Gama, L. Matias, A. Botterud, and J. Wang, “A survey on
wind power ramp forecasting,” Technical report, Argonne National
Laboratory (ANL), 2011.
[23] A. Couto, et al., “Impact of Weather Regimes on the Wind Power Ramp
Forecast in Portugal,” IEEE Trans. Sustain. Energy, vol. 6, no. 3, pp.
934–942, Jul. 2015.
[24] C. Kamath, “Associating weather conditions with ramp events in wind
power generation,” in Proc. Power Syst. Conf. Expo. (PSCE), Mar. 2011, pp. 1–8.
[25] J. C. Pe˜na, M. Aran, J. Cunillera, and J. Amaro, “Atmospheric
circulation patterns associated with strong wind events in Catalonia,”
Nat. Hazards Earth Syst. Sci., vol. 11, no. 1, pp. 145–155, Jan. 2011. [26] P. Chen, T. Pedersen, B. Bak-Jensen, and Z. Chen, “ARIMA-based time
series model of stochastic wind power generation,” IEEE Trans. Power
Syst., vol. 25, no. 2, pp. 667–676, May. 2010.
[27] R. J. Davy, M. J. Woods, C. J. Russell, and P. A. Coppin, “Statistical downscaling of wind variability from meteorological fields,” Boundary -Layer Meteorol., vol. 135, no. 1, pp. 161–175, Jan. 2010.
[28] U. Focken and M. Lange, “Wind power forecasting pilot project in
Alberta, Canada: Final Report,” Energy and Meteo Systems, GmbH,
Tech. Rep., May. 2008. [Online]. Available: www.uwig.org/Final report emsys lv.pdf
[29] Y. Li, “Improving wind power ramp predictions using gabor filtering
and stastical scenarios,” Ph.D. dissertation, University of Alberta, 2014.
[30] A. Bossavy, R. Girard, and G. Kariniotakis, “Forecasting ramps of wind
power production with numerical weather prediction ensembles,” Wind
Energy, vol. 16, no. 1, pp. 51–63, 2013.
[31] N. Cutler, “Characterising the uncertainty in potential large rapid
changes in wind power generation,” Ph.D. dissertation, School Elect.
Eng. Telecommun., Univ. New South Wales, Sydney, Australia, Jul. 2009, p. 290.
[32] Orthogonal Test Method. Math by the Chinese Academy of Sciences Mathematical Statistics Unit. People's Education Press, 1975(12). [33] K. L. Lee and S. A. Billings, “Time series prediction using support
vector machines, the orthogonal and the regularized orthogonal least
squares algorithms,” Int. J. Syst. Sci., vol. 33, no. 10, pp. 811–821, 2002.
[34] S. Chen, X. Hong, and C. J. Harris, “Sparse kernel regression modeling using combined locally regularized orthogonal least squares and
d-optimality experimental design,” IEEE Trans. Autom. Contr., vol. 48,
no. 6, pp. 1029–1036, Jun. 2003.
[35] M. H. Brown, “Algorithm animation: techniques, a system and a novel
application,” Workshop on Computational Support for Discrete Mathematics, 1992.
[36] C. G. Castillo, A. C. Tejero, O. L. Garcia, “A review on the recent history of wind power ramp forecasting,” Renewable & Sustainable Energy Reviews, vol. 52, pp. 1148–1157, Dec. 2015.
VII. BIOGRAPHIES
Yongqian Liu received a PhD degree in Production Automation at Nancy 1 University in France and a PhD in Hydropower Engineering in 2002, under a joint doctoral program between Huazhong University of Science & Technology, Wuhan, China, and University of Henri Poincare Nancy 1, Nancy, France. He is one of the founders of the Bachelor’s program “Wind Energy and Power Engineering” in China. Currently, he is a professor in the School of Renewable Energy in North China Electric Power University. His research interests include Wind Power Prediction, Wind Farm Design and Operation Technologies, as well as Condition Monitoring and Diagnoses for Wind turbine Generator Systems.
Ying Sun received a B.S. degree in Wind Energy and Power Engineering at North China Electric Power University, Beijing, China, in 2014. Currently, she is pursuing the M.S. degree in Wind Energy and Power engineering at the School of Renewable Energy, North China Electric Power University. Her research interests include Wind Power Ramps Forecasting, Power Forecasting, and Characteristics Analysis of Wind Speed.
David Infield received a B.A. degree in mathematics and physics from the University of Lancaster, Lancaster, U.K. and the Ph.D. degree in applied mathematics from the University of Kent, Canterbury, U.K. He worked for the Rutherford Appleton Laboratory in Oxfordshire, U.K., from 1982 to 1993 researching into wind electricity systems. From 1993 to 2007, he was with Loughborough University, Leicestershire, U.K., where he established CREST, the Centre for Renewable Energy Systems Technology. He is now Professor of Renewable Energy Technologies with the Institute for Energy and Environment within the Department of Electronic and Electrical Engineering, University of Strathclyde, Glasgow U.K.