INCORPORATING TRAFFIC CONTROL AND SAFETY
HARDWARE PERFORMANCE FUNCTIONS
INTO RISK-BASED HIGHWAY SAFETY ANALYSIS
goal. Over the past few decades, many analytical methods, models, and tools have been developed and refined to realistically estimate vehicle crashes on a highway segment. In addition, they quantify the expect-ed benefits of safety improvement projects, and prior-itize the economically feasible projects under budget constraints to ensure achieving the maximized safety benefits to users on the highway system. The various categories of traffic control and safety hardware, such as traffic signs, lighting, signals, pavement markings, guardrails, barriers, and crash cushions require holis-tic management with the highway facilities, vehicles, drivers, and the environment to collectively reach ef-fective safety performance. The required analytical methods for traffic control and safety hardware are an important and non-separable part for holistic and effi-cient safety analysis and management.
The interaction of factors relating to highway facil-ities, vehicles, drivers, and environment, contribute to the occurrence of a vehicle crash on a highway segment. Over the past few decades, researchers have studied the categories of geometric design, consistency of design standards, pavement conditions, and roadside features for detailed analysis of safety issues attributable to highway segments [1, 2, 3, 4, 5]. Meanwhile, the condition of the traffic control and safety hardware has a significant impact on the safety of the users. In fact, the service lives of major high-way facilities contributing to the safety performance ABSTRACT
Traffic control and safety hardware such as traffic signs, lighting, signals, pavement markings, guardrails, barriers, and crash cushions form an important and inseparable part of highway infrastructure affecting safety performance. Sig-nificant progress has been made in recent decades to de-velop safety performance functions and crash modification factors for site-specific crash predictions. However, the exist-ing models and methods lack rigorous treatments of safety impacts of time-deteriorating conditions of traffic control and safety hardware. This study introduces a refined meth-od for computing the Safety Index (SI) as a means of crash predictions for a highway segment that incorporates traffic control and safety hardware performance functions into the analysis. The proposed method is applied in a computation experiment using five-year data on nearly two hundred ru-ral and urban highway segments. The root-mean square er-ror (RMSE), Chi-square, Spearman’s rank correlation, and Mann-Whitney U tests are employed for validation.
KEY WORDS
traffic control; safety hardware; safety performance func-tion; highway safety; risk analysis;
1. INTRODUCTION
Highway analysis and management have evolved over the years to become an all-encompassing effort with safety of the users included as an over-arching
Safety and Security in Traffic Original Scientific Paper Submitted: 5 Jan. 2016 Accepted: 16 Nov. 2016 ZONGZHI LI, Ph.D.1 (Corresponding Author) E-mail: lizz@iit.edu HOANG DAO, Ph.D.1 E-mail: hdao@hawk.iit.edu HARSHINGAR PATEL, Ph.D.1 E-mail: hpatel93@hawk.iit.edu YI LIU, PH.D.2 E-mail: liuy87@hotmail.com BEI ZHOU, Ph.D.3 E-mail: bzhou2007@gmail.com
1 Department of Civil, Architectural and Environmental
Engineering, Illinois Institute of Technology 3201 South Dearborn Street, Chicago, IL 60616
2 School of Navigation, Wuhan University of Technology
1178 Hepindadao, Wuchang, Wuhan, Hubei, 430063, China
3 College of Highways, Chang’an University
South Middle Section, 2nd Ring Road, Xi’an, Shaanxi,
of the system are significantly longer than the useful service lives of different categories of traffic control and safety hardware. This leads to more frequent re-placement of traffic control and safety hardware, add-ing to relatively high maintenance costs of the safety hardware system. Researchers have attempted to in-corporate the concept of performance-based analysis relying on the condition of facility preservation and impacts of changes in the facility condition on the per-formance for safety analysis and project evaluation. Madanu et al. [6] developed a methodology incorpo-rating the life-cycle cost analysis for refined estimation of impacts of the traffic control and safety hardware on crash predictions, to address the limitations of the existing traditional methods for safety impacts assess-ment of highway safety hardware improveassess-ments. The risk-based methods for safety analysis employ the computation of the safety index (SI) by combining the traffic exposure, crash frequency, and crash severity factors for estimating the crash frequency associat-ed with a highway segment [2, 5, 7, 8, 9]. However, the available methods have a limitation with regard to estimating the changes in the crash frequency and the severity level after implementing traffic control and safety hardware improvement projects during the course of highway facility service life-cycle. The esti-mated changes in the observed crash frequency and severity post-implementation of safety improvement projects are computed by considering the conditions of the traffic control and safety hardware as average constant observed values, which in reality might not be applicable to site-specific conditions for a long peri-od of time [8, 9]. Alternatively, Madanu et al. [6] used the pre-and post-implementation percentage changes in the observed crash frequency by severity level for comparable sites for a safety improvement project, but did not capture the variability of such changes that are collectively affected by multiple crash contributing fac-tors over time. As a practical matter, the percentage changes are dependent on the time of the observed data with respect to the useful service life of the traf-fic control and safety hardware. The varying service lives of different highway facility components and the time-varying nature of changes in the traffic control and safety hardware conditions make estimating the comparative rate of changes for any given service time period difficult for the purpose of safety-related proj-ect assessment. In order to address this limitation, it is necessary to use the performance functions corre-sponding to different categories of traffic control and safety hardware, which are a function of time for the analysis.
In this context, research was conducted to develop performance functions for traffic signs, traffic signals, and pavement markings. For instance, Black et al. [10] carried out performance modelling of traffic signs, and observed that the retroreflectivity of traffic signs
decreases over time except in case of red high inten-sity sheeting where retroreflectivity value decreases in the first five years and starts to increase owing to the fade of the red ink to cause an increase in red high intensity retroreflectivity value. Wolshon [11] com-pared high intensity grade sheeting and engineering grade sheeting, based on the impacts of exposure of the traffic signs to sun over the service life depend-ing on the sheetdepend-ing grade, conditions, and direction of installation of the traffic sign. The study reported that the high intensity grade sheeting performed bet-ter than the engineering grade sheeting. Pertaining to lights, nowadays, Light Emitting Diode (LED) lights are popular owing to the longer life expectancy, low maintenance and energy requirements, and an over-all cheaper life-cycle cost. Long et al. [12] introduced a method to determine the lifetime of LED-based traffic lights by considering measurements of lumen maintenance and temperature, evaluated the service life of LED-based traffic signals, and classified them by manufacturer, function, and colour using light in-tensity as the measurement of LED degradation. For pavement marking performance modelling, Lindly et al. [13] used the concept of Cumulative Traffic Passag-es (CTP) determined by using daily traffic, number of lanes, and the age of pavement markings, based on which statistical models were developed to establish a relationship between retroreflectivity of pavement markings and CTP by means of linear and exponential regression analyses. Bahar et al. [14] also developed models for pavement marking retroreflectivity deterio-ration over time by material used, traffic condition, and weather condition. Avelar and Paul [15] analyzed the relationship between pavement marking retroreflec-tivity and night-time safety and found that sites with low centreline retroreflectivity (compared with edge line retroreflectivity of the same road) were associat-ed with more crashes. Guo et al. [16] indicatassociat-ed that parallelogram-shaped pavement markings significant-ly reduced vehicle speeds and speed violations in the vicinity of pedestrian crosswalks.
This study introduces a refined method based on the risk-based safety analysis method developed by Madanu et al. [6], which incorporates traffic control and safety hardware performance functions into the analytical process. The contribution of this research is in terms of the refinements, specifically utilizing the time-varying safety hardware performance functions to compute the Safety Index (SI) which correlates the traffic control and safety hardware condition prior to safety improvements with changes in the hardware condition after improvements. Here, changes in hard-ware condition are treated as a variable that is esti-mated by the hardware performance functions. The refined method is based on the existing risk-based safety analysis methods, benefitting from their es-tablished framework, but it goes one step further by
incorporating performance-based considerations for the traffic control and safety hardware.
2. PROPOSED METHOD
The proposed method in the present study is a risk-based safety analysis approach for computation of the SI value based on conditions of traffic control and safe-ty hardware within a highway segment, and their effect on the associated vehicle crash risks on the highway segment. The available methods for computing the SI values depend on the expert opinion and the aver-age extent of deterioration in the conditions of traffic control and safety hardware before and after safety improvements to quantify the impacts of traffic con-trol and safety hardware on associated vehicle crash risks. The present study aims to overcome this specific limitation by refining the existing risk-based methods to utilize performance functions of traffic control and safety hardware over time to model its performance trends.
The methodological refinements proposed in this study consider various categories of traffic control and safety hardware such as traffic signs, lighting, signals, pavement markings, barriers, and guardrails, along with geometric design, consistency of design stan-dards, and pavement conditions. The performance measures used for traffic signs, street lighting, traffic signals, pavement markings and guardrails are roreflectivity, lumen maintenance, light intensity, ret-roreflectivity, and shrinkage strain, respectively. The study is made on the assumption that all categories of traffic control and safety hardware are installed new at the beginning of the study period, and will deteriorate based on their individual performance functions over time, without any repairs and will be replaced at the end of their useful service life. The following sections details the process and parameters for computing the SI value as a means of crash predictions for a highway segment.
2.1 Methodology overview
A vehicle crash on a highway segment is attribut-able to a number of factors associated with highway facilities, vehicles, drivers, and weather conditions. The crash contributing factors for the purpose of crash estimation on a segment include geometric design, traffic operation characteristics, pavement conditions, roadside features, and traffic control and safety hard-ware conditions. The SI value associated with a high-way segment is the quantification of the associated vehicle crash risks with which the conditions of the safety and traffic hardware on the segment contribute to crash occurrences.
Step 1: Categorize the highway segment by land area and functional class and crashes by type and severity Step 2: Compute the crash risk factors attributable to: I)
geo-metric design, II) traffi c operations, III) traffi c control and safety hardware conditions, and IV) roadside features
Step 3: Compute the traffi c exposure, crash frequency, and crash severity factors based on historical data with percentage changes in crash frequency and severity as a function of traffi c control and safety hardware performance functions
Step 4: Compute the safety index (SI) by crash severity level and type affected by traffi c control and safety hard-ware conditions
Step 5: Validate the SI values using analytical procedures and statistical tests
Figure 1 – Proposed methodology for computing the SI value of a highway segment
Figure 1 illustrates the main computational steps involved in the proposed analytical process. The first step in the process of SI computation is categoriza-tion of the highway system based on land area (rural and urban) and highway functional class (Interstate, multi-lane, and two-lane). Vehicle crashes are catego-rized as fatal, injury and property damage only (PDO) crashes per highway segment per year. Next, the crash risk factors attributable to each category of geomet-ric design, traffic operation characteristics, pavement conditions, roadside features, and traffic control and hardware conditions are computed. The various cat-egories of traffic control and safety hardware utilized for the purpose of SI computation are traffic signs, lighting, signals, and pavement markings, while barri-ers and guardrails are considered as the roadside fea-tures, along with the geometric design, consistency of design standards, and pavement conditions amongst other factors. One or more hardware items, in each category of traffic control and safety hardware may be involved for SI computation. The third step is to cal-culate the traffic exposure factor (TEF), crash frequen-cy factor (CFF), and crash severity factor (CSF) based on historical data. Next, the probability of each type of crashes occurring and the TEF, CFF and CSF are used to compute the SI value. The contribution of the proposed methodological refinements forms the fourth step, which is the computation of CFF and CSF and the respective percentage changes, estimated as functions of the performance of individual traffic control and safety hardware items over time. This im-plies that the crash frequency associated with each traffic control and safety hardware item will vary with
time. Moreover, it is assumed that the traffic control and safety hardware item is replaced multiple times over the useful service life of the highway segment, as the service life of traffic control and safety hard-ware is significantly shorter as compared to that of a highway segment. In order to compute the SI for the crash severity level, the logarithmic possibility-proba-bility transformation approach proposed by Klir [17] is used to convert the crash possibility distribution to crash probability distribution. The method uses histor-ical data to establish the possibility distribution of the identified crash type, which in turn is utilized to com-pute the generalized Hartley measure and estimate the probability distribution. Finally, in order to validate the SI value established by the proposed risk-based method, its results are compared with the crash fre-quency calculated using the Empirical Bayesian (EB) before-after analysis method, in conjunction with the field observed crash records [18].
2.2 Methodology computation
Calculation of the SI value for a highway segment.
This section elaborates the proposed method for com-puting the SI value introduced in the above section. SI is a combination of the Traffic Exposure Factor (TEF), Crash Frequency Factor (CFF), and Crash Severity Fac-tor (CSF); where TEF is a function of traffic volume on the highway segment; CFF is an estimated factor based on the crash risk factors computed using geo-metric design, traffic operations characteristics, pave-ment conditions, and traffic control and safety hard-ware conditions; and CSF is estimated using crash risk factors associated with roadside features. The SI value of a highway segment for categories of fatal, injury and PDO crashes can be calculated as [7, 9]:
SIs TEFs P r CFF CSF r R rs rs 1 $ $ $ = = 6 ^ h @
/
(1) where:SIs – safety index of a highway segment for crash severity level s,
TEFs – overall TEF for crash severity level s,
P(r) – probability of occurring type r crashes,
CFFrs – overall crash frequency factor measuring the risk of increasing the crash frequency,
CSFrs – overall crash severity factor measuring the risk of increasing the crash severity.
Determination of traffic exposure factor. TEF asso-ciated with a highway segment quantifies the safety hazards that the users are exposed to, which can be computed by the formulation given below [8, 9]:
TEFs=L$^365$AADTah (2)
where:
L –length of the highway segment under consideration, in km,
AADT – annual average daily traffic, in vehicles per day,
a – exponent of AADT in the safety performance function with a<1 to consider non-linearity between crashes and traffic volume or is set to 1 if safety performance function is not
available.
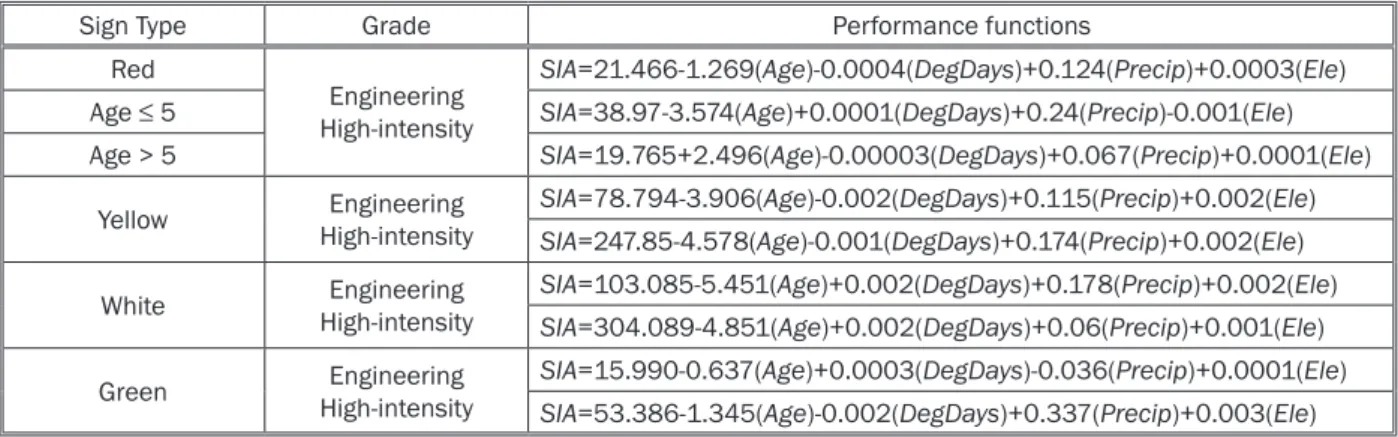
Traffic control and safety hardware performance functions for estimating changes in crash frequency and severity level. The performance functions and rates of deterioration for individual traffic control and safety hardware items associated with a highway segment are modelled and estimated. For the purpose of the cur-rent study, performance functions calibrated for traffic signs, signals, and pavement markings in the existing literature are adopted. Table 1 presents details of traffic sign retroreflectivity performance functions [10].
With regards to traffic signals, the available litera-ture indicates that because of its advantages of ener-gy saving, environment, and long service life-cycle, the use of LED lamps for traffic signal heads is popular. Table 1 – Traffic sign retroreflectivity performance functions
Sign Type Grade Performance functions
Red
Engineering High-intensity
SIA=21.466-1.269(Age)-0.0004(DegDays)+0.124(Precip)+0.0003(Ele) Age ≤ 5 SIA=38.97-3.574(Age)+0.0001(DegDays)+0.24(Precip)-0.001(Ele) Age > 5 SIA=19.765+2.496(Age)-0.00003(DegDays)+0.067(Precip)+0.0001(Ele)
Yellow High-intensityEngineering SIA=78.794-3.906(Age)-0.002(DegDays)+0.115(Precip)+0.002(Ele)
SIA=247.85-4.578(Age)-0.001(DegDays)+0.174(Precip)+0.002(Ele) White High-intensityEngineering SIA=103.085-5.451(Age)+0.002(DegDays)+0.178(Precip)+0.002(Ele)
SIA=304.089-4.851(Age)+0.002(DegDays)+0.06(Precip)+0.001(Ele) Green High-intensityEngineering SIA=15.990-0.637(Age)+0.0003(DegDays)-0.036(Precip)+0.0001(Ele)
SIA=53.386-1.345(Age)-0.002(DegDays)+0.337(Precip)+0.003(Ele)
Note: SIA – predictive traffic sign retroreflectivity, candela/lux/m2, Age – age category of sign sheeting, years, DegDays – annual heating
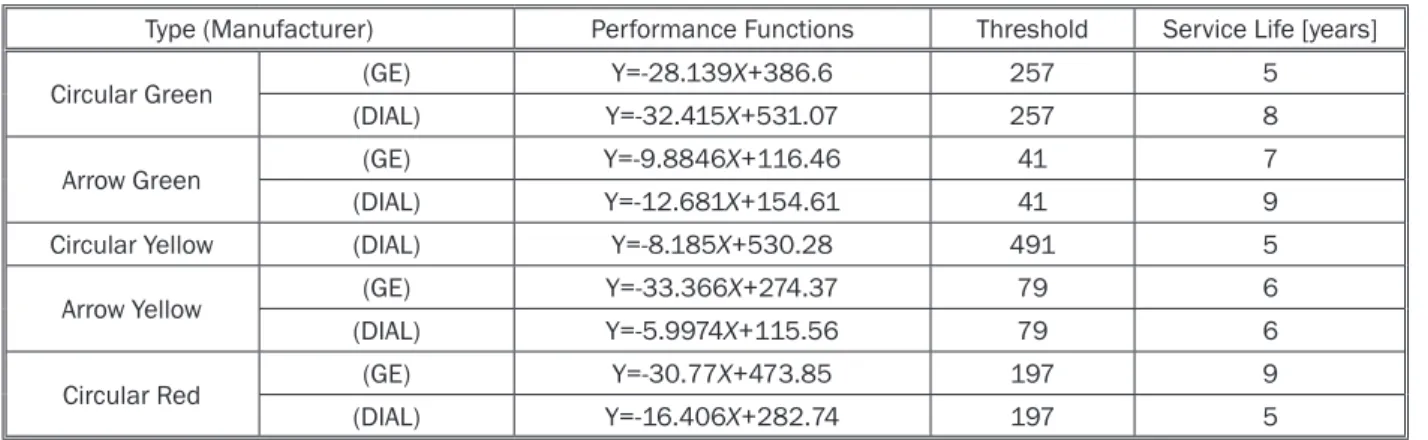
The light output in lumen of LED signal heads can be formulated as [12]:
LLED=L e0$ -a^ hT tj (3) where:
a – light output deterioration rate, a is set as 10, 20, 30, 40 or 50 percent,
t – operation time, in hours,
Lo – initial light output,
Tj – temperature at time t is related to the initial (Tj0); the final (T
jf) and the increase rate (m, n) of temperature by logarithmic, linear,
and exponential functional forms.
The present study utilizes performance functions of LED traffic signal heads developed by Long et al. [12] for estimating the rates of degradation of perfor-mance, as detailed in Table 2, where all the lights are categorized by manufacturer, life, colour, and direc-tional view.
For the purpose of modelling the performance of pavement markings, researchers introduced cumula-tive traffic passages (CTP) based on evaluation of flat thermoplastic markings (FTM) and profiled pavement markings (PPM) that can be computed by Equation 4 [13]:
( ) ( ) /
/
CTP AADT millions Age of Marking ays Number of Lanes d 106 $ $ =6 6 @ @ (4)
Based on the computed value of CTP as detailed above, the relationship between the pavement mark-ing retroreflectivity (R) and CTP has been developed by
the Alabama University Transportation Center (AUTC) presented as linear and exponential performance functions as detailed in Table 3 [13]:.
Computation of crash frequency factor. The CFF for a highway segment indicates the associated risk of increase in the observed crash occurrences. It is computed as the product of CFF by crash type r and severity category s, for each general crash risk factor i associated with geometric design, traffic operation characteristics, pavement conditions, roadside fea-tures, and traffic control and safety hardware condi-tions. Crash frequency factor pertinent to risk factor, crash type, and crash severity is computed by combin-ing the weights (Wij), relative increase in percentage of crash frequency as a function of time (ΔCFrsij), and crash frequency proportion factor (Prsij) for each of its constituent crash risk factors j for each identified gen-eral crash risk factor i [8, 9].
CFFrs=CFFrs1$CFFrs2$f$CFF CFFrsi$ rsl (5)
CFFrsi 1 Wij CFrsij Prsij j J 1 $D $ = + =
/
(6) where:CFFrs – overall crash frequency factor for a highway segment,
CFFrsi – crash frequency factor concerning general crash risk factor i for a highway segment,
Wij – weighting of detailed crash risk factor j under general crash risk factor i,
Table 2 – LED traffic signal head performance functions
Type (Manufacturer) Performance Functions Threshold Service Life [years]
Circular Green (GE) Y=-28.139X+386.6 257 5
(DIAL) Y=-32.415X+531.07 257 8
Arrow Green (GE) Y=-9.8846X+116.46 41 7
(DIAL) Y=-12.681X+154.61 41 9
Circular Yellow (DIAL) Y=-8.185X+530.28 491 5
Arrow Yellow (GE) Y=-33.366X+274.37 79 6
(DIAL) Y=-5.9974X+115.56 79 6
Circular Red (GE) Y=-30.77X+473.85 197 9
(DIAL) Y=-16.406X+282.74 197 5
Note: Y- light intensity, X - age, Years - made up to be integer.
Table 3 – Pavement marking retroreflectivity performance functions
Pavement Markings Types Model Forms Performance Functions
Flat thermoplastic (FTM) Linear (L) RFTML =310 31 1- . $CTP
Exponential (E) R 329 e . FTM E = $ -0 16$CTP Profiled (PPM) Linear (L) RLPPM=239 28 9- . $CTP Exponential (E) RE 244 e . CTP PPM= $ -0 16$
ΔCFrsij – relative increase in crash frequency before and after hardware improvements,
Prsij – crash frequency proportion factor as the proportion of segment crashes affected by detailed crash risk factor j under general crash risk factor i,
r – crash type, including head-on, side swipe, f ixed object, run-off-road,
s – crash severity category, including fatal, injury and property damage only (PDO).
In order to consider the length of a highway seg-ment and the associated safety issue it is exposed to, a weighting factor Wij is determined, for the safety issues related to geometric design, pavement conditions, and traffic control and safety hardware conditions, which are estimated based on historical data. Wij is a ratio between the crash risk factor for an affected length of segment and the total length of the highway segment under consideration. The crash frequency proportion factor Prsij, which is the ratio between the cumulative number of crashes affected by a crash risk factor. The total number of crashes on the highway segment affected by the detailed crash risk factor can be de-termined based on historical data as well and it rep-resents the proportion of segment crashes affected by detailed crash risk factor j under general crash risk factor i for crash type r and severity category s.
As shown in Equation 6, the relative increase in crash frequency ΔCFrsij for each detailed crash risk factor j under general crash risk factor i with respect to crash type r and severity category s is estimated as rel-ative increase in crashes estimated by the applicable segment related accident modification factor [8, 9]. The current study introduces the concept of this rela-tive increase in crash frequency ΔCFrsij as a function of time and computes it based on traffic control and safe-ty hardware performance such that the existing meth-od of safety impacts analysis is refined to reflect the true impact of time on the deterioration of the highway hardware and quantification of the impacts in terms of changes in crashes in the system. It is assumed that, over time, when traffic control and safety hardware conditions deteriorate, crash frequency will increase. In order to evaluate the relation between traffic control and safety hardware performance and crash frequen-cies, the relative increase in crash frequency factor is formulated as follows and used in Equation 6 for the crash frequency factor calculation:
% CF f CFf CF ff CFCF 100 , , , , rsij rsij rsij T rsij rsij t 0 0 $ D =<< ^^ hh-- ^^ hhF F (7) where:
ΔCFrsij – percentage increase in crash frequency,
CFrsij,0 – initial value of the CF contributing factor when the hardware is first installed,
CFrsij,T – terminal value of the CF contributing factor when the hardware needs to be replaced,
CFrsij,t – value of the CF contributing factor at time t. This formulation captures the performance of traf-fic control and safety hardware over time, and differen-tiates the effect of calculating a similar value of ΔCFrsij
for two different sets of performance values over a performance curve.
Estimation of crash severity factor. The crash se-verity factor CSFrs attributable to roadside features and operating speed of the vehicle involved in the crash is computed as the product of crash severity factors by crash type r and by crash severity level s
for general risk factors i, by combining the weights of crash risk factors, relative change in the crash severity, and crash proportion factor for all constituent crash risk factors j [8, 9].
CSFrsi RSH 1 wij CSrsij Prsij
j j 1 _ = + _RSH$D $ _RSH =
/
(8) where:Wij_RSH – weighting of detailed crash risk factor j under roadside feature crash risk factor i, ΔCSrsij – relative increase in crash severity before and after hardware improvements,
Prsij_RSH – crash severity proportion factor as the proportion of crashes affected by detailed crash risk factor j under roadside
feature-related crash risk factor i.
For each type of crashes affected by roadside fea-tures, the injury, fatal, and PDO crash severity factors are formulated in the following equations:
CSFr I i, , 1 Wi j, CSrsij Pr I i j, , , j j 1 _RSH= + _RSH$D $ _RSH =
/
(9) CSF W CS S P 1 1 , , , , , , , , , r F i i j j j rsij r F i j r I i j 1 _ _ _ _ RSH RSH RSH RSH $ $ D D $ = + + = ^ h 6 @/
(10) CSF W CS S P 1 1 , , , , , , , , , r P i i j j j rsij r P i j r I i j 1 _ _ _ _ RSH RSH RSH RSH $ $ D D $ = + + = ^ h 6 @/
(11) where:CSFr,I,i_RSH – injury crash severity factor,
CSFr,F,i_RSH – fatal crash severity factor,
CSFr,P,i_RSH – PDO crash severity factor,
Wi,j_RSH – weighting of roadside features related to crash risk factor,
ΔCSrsij – relative increase in crash severity before and after hardware improvements, ΔSr,F,i,j_RSH – relative increase in fatal crash risk over injury crash risk,
ΔSr,P,i,j_RSH – relative increase in PDO crash risk over injury crash risk,
Pr,I,i,j_RSH – crash frequency proportion factor as the proportion of injury crashes.
The injury crash weighting factor Wr,I,i,j is the ratio between the roadside safety issue item affected length and the total length of the highway segment, for each roadside safety issue item j under roadside safety is-sue type i. It is computed in the same manner as the crash frequency weighting factor. The relative increase in fatal crash risk ΔSr,F,i,j_RSH over the injury crash risk can be determined as the percentage change in fatal and injury crash rates over injury crash rate using his-torical crash data. Similarly, the relative increase in PDO crash risk ΔSr,P,i,j_RSH over the injury crash risk can be estimated as the percentage change in the injury and PDO crash rates.
The following formulation considered in Equations 9-11 for the purpose of computing the Crash Severi-ty Factors quantifies the relative increase in crash severity factor ΔCSrsij, by utilizing safety performance functions for predicting fatal, injury, and PDO crashes adjusted to account for traffic control and safety hard-ware conditions that deteriorate over time as follows:
% CS f CSf CS f CSf CS 100 , , , , rsij rsij rsij rsij rsij T t 0 0 $ D = - -^^ hh ^^ hh << F F (12) where:
ΔCSrsij – percentage change in the Crash Severity Factor for all types of crashes,
CSrsij,0 – initial value of the CS contributing factor when the hardware is first installed,
CSrsij,T – terminal value of the CS contributing factor when the hardware needs to be replaced,
CSrsij,t – value of the CS contributing factor at time t. The importance of this computation of perfor-mance of the traffic control and safety hardware as a function of time is evident. As the condition of the hardware deteriorates over time, the impact of the sumed value of the hardware performance on the as-sociated vehicular crash risk also increases. This is the refinement achieved by this study which considers the performance of all traffic control and safety hardware as a function of time, and not an average value.
Probability in the occurrences of different types of crashes. The historical data provide the highway seg-ment-related vehicle crashes and their categorization by type and severity. However, in order to predict the vehicle crashes on the segment in the future year, it is imperative to ascertain the probability distribution of these crashes by type and severity for the group of highway segments within a highway system by land area and functional class. A logarithmic transforma-tion method introduced by Klir [17] can be followed to convert the crash possibility distribution to the crash probability distribution, by using identification of the crash types from historical data and then determining its possibility distribution to compute the generalized Hartley measure to establish the probability distribu-tion.
2.3 Methodology validation
The necessity for refining the existing methods for predicting vehicle crashes expected on a highway segment for the purpose of SI computation is to accu-rately assess crash impacts of detailed crash risk fac-tors relevant to geometric design, traffic volumes and operations, pavement conditions, roadside features, and traffic control and safety hardware conditions. The proposed method refines the resultant SI values. How-ever, the results require validation. For this purpose, SI values are compared with the Empirical Bayesian (EB) adjusted crash estimates that eliminate the re-gression-to-mean bias by taking the weighed sum of observed and predicted crash frequencies [18, 19]. The EB estimate is computed as:
EBi=w P$ i+^1-w Oh$ i (13) w k P k 1 1 i = + (14) where:
EBi – EB crash estimate for highway segment i,
Pi – crash frequency predicted by a safety performance function for highway segment i,
Oi – observed number of crashes during the specified period for highway segment i,
w – relative weight between the predicted and observed crash frequencies,
k – overdispersion factor of the negative binomial safety performance function.
Further, the computed SI values and EB crash fre-quency estimates are correlated by means of a linear regression model with the adjusted R2 as an indicator for the correlation significance. In order to compare the consistency of SI and EB estimates, Root-mean-square error (RMSE) and Geoffrey E. Havers (GEH) values are computed. Additionally, Chi-square, Spearman’s rank correlation, and Mann-Whitney U tests are also con-ducted [20, 21].
3. METHOD APPLICATION
3.1 Data collection and SI computation
The computational experiment to validate the proposed method uses data on highway geometric design, conditions of traffic control and safety hard-ware including pavement markings and traffic signs, and crash data from Ozaukee County, Wisconsin, USA over the time from 2002-2006. The county covers a total area of 1,116 square miles including 232 square miles of land and 884 square miles of water. Table 4 presents the data summary.
In practice, the crash types potentially affected by traffic control and safety hardware conditions are head-on, sideswipe, fixed object, and run-off-road. The general statistics of historical data indicate 5 percent, 17 percent, 1 percent and 77 percent of crashes for the aforementioned crash types, respectively. The SI values are computed using the proposed method for individual highway segments.
3.2 Validation of SI values
First, the RMSE and GEH values are calculat-ed for the consistency checks between the SI or EB crash estimates in reference to the observed crash frequencies for all highway segments. The computed RMSE values are 4.05 and 4.11 for SI and EB, respec-tively. These values reveal that the computed SI crash frequency values are marginally more accurate than EB crash frequency estimates, because of a slight-ly lower RMSE value. Further, the GEH value allows for consistency check between the SI or EB estimate and observed crash frequency for each highway seg-ment independently. Of all 193 segseg-ments, the GEH values corresponding to individual highway segments
calculated using either SI or EB estimates are lower than 5.0 for all segments, indicating that both the pro-posed and EB method yield acceptable crash frequen-cy estimates.
Next, consistency checks between the SI or EB esti-mates and field observed crashes are performed using Chi-square, Spear’s rank correlation, and Mann-Whit-ney U tests mentioned in the previous section. The Chi-square statistics is calculated as 79.88 and low-er than χ20.05;192, indicating that there is no statisti-cally significant difference between SI and EB crash frequency estimates. For estimating the Spearman’s rank correlation coefficient, the SI values and EB crash estimates for individual highway segments are established and then paired to rank in ascending or descending orders. It provides a measure of associa-tion between the rankings of segment safety by SI and EB crash estimates. The Spearman’s rank correlation coefficient, ps, is computed as 13.58 and z-statistic at 95 percent confidence level is 0.98, indicating that the ranking from the SI estimates and EB estimates do agree with each other at a high confidence level. Next, the Mann-Whitney U test is conducted with an assumption that they are from the same population. The standard normal z-statistic, |z|, is computed as Table 4 – Summary data of the computational study
Data Item
Urban Area Rural Area
Interstate Multilane Divided UndividedMultilane Two-lane Interstate Multilane Divided Two-lane
Segments (No.) 30 59 3 44 22 28 7 Lengths (km) 51.21 43.61 2.75 33.32 37.45 27.95 7.91 AADT [veh/day] 2002 48,174 12,798 13,299 13,460 26,423 10,782 11,127 2003 48,826 12,918 13,431 13,605 26,687 10,874 11,258 2004 49,488 13,039 13,564 13,752 26,954 10,967 11,390 2005 50,158 13,162 13,699 13,900 27,225 11,061 11,524 2006 50,838 13,285 13,834 14,050 27,498 11,156 11,660 Fatal [Crashes/year] 2002 8 10 2 6 4 4 1 2003 7 8 0 7 1 1 2 2004 9 5 1 6 4 5 1 2005 5 8 1 6 2 2 2 2006 7 4 0 2 2 0 1 Injury [Crashes/year] 2002 22 53 13 30 5 11 11 2003 20 51 6 31 5 17 11 2004 29 47 7 38 10 25 17 2005 23 50 11 43 13 23 13 2006 23 32 6 29 4 12 20 PDO [Crashes/year] 2002 55 78 16 65 13 10 4 2003 47 94 12 63 12 5 8 2004 74 86 17 72 25 10 7 2005 83 94 20 92 31 10 11 2006 71 92 20 75 23 3 11
2.09 and lower than z0.05;192, indicating that there is no statistically significant difference between SI and EB crash frequency estimates.
Finally, linear regression models are calibrated using SI and EB estimates for the 193 highway seg-ments as illustrated in Figure 2, 3 and 4. The R2 values showed the significance of correlations between the two sets of crash estimates, which are 0.93, 0.85, and 0.93 for fatal, injury, and PDO crashes, respectively. These exhibit relatively good fits between the SI values computed using the proposed risk-based method and EB estimates.
Table 5 – Summary of validation tests
Statistical Tests Analysis Results Root-Mean-Square-Error
(RMSE) Test
RMSESI=4.05 RMSEEB=4.11
Chi-Square Test |2=79 88. 1|0 05 1922. ; Spear’s Rank Correlation Test ps=13 58. 1z0 95. Mann-Whitney U Test z =2 09. 1z0 05 192. ; EB 0.7000 0.6000 0.5000 0.4000 0.3000 0.2000 0.1000 0.0000 0.0000 0.1000 0.2000 0.3000 0.4000 0.5000 0.6000 0.7000 0.8000 Linear (FATAL 02-06) FATAL 02-06 SI y=0.8313x R2=0.9298
Figure 2 – Regression analysis of computed SI values and EB estimates for Fatal Crashes 16.0000 14.0000 12.0000 10.0000 8.0000 6.0000 4.0000 2.0000 0.0000 0.0000 2.0000 4.0000 6.0000 8.0000 10.0000 12.0000 SI EB y=1.1376x R2=0.9338 Linear (PDO 02-06) PDO 02-06
Figure 3 – Regression analysis of computed SI values and EB estimates for Injury Crashes
Linear (INJURY 02-06) INJURY 02-06 EB 0.6000 0.5000 0.4000 0.3000 0.2000 0.1000 0.0000 0.0000 0.5000 1.0000 1.5000 2.0000 2.5000 3.0000 3.5000 4.0000 4.5000 5.000 SI y=0.7932x R2=0.846
4. CONCLUSION
Each year there are fatalities on the highway sys-tem attributable partly to inadequacies in the perfor-mance of traffic control and safety hardware, as its conditions deteriorate over time and effective analysis and management will dictate safety of highway users. This study has proposed refining of the exiting meth-ods for highway safety analysis and management, as specifically utilizing the time-varying safety hardware performance functions to compute the Safety Index (SI) which correlates the traffic control and safety hardware condition. In particular, it introduces the combination of two refinements: i) introducing a disag-gregated risk-based method for computing the safety index where it considers the performance functions for traffic control and safety hardware to compute the percentage changes in the crash frequency and sever-ity as a function of hardware condition deterioration over time, and ii) incorporating a holistic system that combines data details of vehicle crashes and crash contributing factors concerning geometric design, traf-fic exposure, roadside features, and traftraf-fic control and safety hardware from various sources and provides a weighing scheme for factors collectively affecting crash occurrences.
The SI values calculated in the computational ex-periment are validated by using crash records and EB adjusted crash estimates via RMSE and GEH proce-dures, as well as Chi-square, Spearman's rank correla-tion, and Mann-Whitney U tests. The SI values and EB estimates exhibit a high level of consistency, but with a slightly low level of errors compared with the crash re-cords. This suggests that the disaggregated risk-based method incorporating performance functions for traffic control and safety hardware is well suited for assess-ing safety impacts of condition changes in traffic con-trol and safety hardware, such as signs and pavement markings.
In the broader context, the proposed method is applicable for evaluating the effectiveness of high-way safety improvement projects. It is however cau-tioned that the data intensive nature of the method limits its usage to large-scale highway agencies that have the means and capability to maintain sufficient historical data on highway facility preservation, traffic operations, and crash records, as well as required data processing and analysis capabilities.
李宗志 博士 (通讯作者) 土建环境工程系,伊利诺伊理工大学,芝加哥市, 伊利诺伊州,美国 电子邮箱:lizz@iit.edu HOANG DAO, 博士 土建环境工程系,伊利诺伊理工大学,芝加哥市, 伊利诺伊州,美国 电子邮箱:hdao@hawk.iit.edu HARSHINGAR PATEL, 博士 土建环境工程系,伊利诺伊理工大学,芝加哥市, 伊利诺伊州,美国 电子邮箱:hpatel93@hawk.iit.edu 刘奕, 博士 航运学院,武汉理工大学,武汉市,湖北,中国 电子邮箱: liuy87@hotmail.com 周备, 博士 公路学院,长安大学,西安市,陕西,中国 电子邮箱: bzhou2007@gmail.com 将交通控制和安全设施特征方程 纳入公路安全风险分析 李宗志 博士,现为美国伊利诺理工大学土建环境工程系 终生教授。从长安大学 (原西安公路学院) 获工学 学士学位,美国普渡大学分获交通运输与基础设施 系统工程硕士和博士学位,期间还获得工业工程 ( 运筹学专业) 硕士双学位。专长为综合交通基础设 施和动态交通的机动性、安全性、安保、疏散归还 和应急管理、能耗和车辆尾气排放等管理目标的建 模; 可持续发展交通资产管理- 依托大数据对综合 交通系统多个绩效式管理目标,交通基础设施和动 态交通流之间的关联性、整合性、及风险和不确定 性进行分析、信息挖掘、优化决策;交通运输网经 济学。 关键词 交通控制, 安全设施, 交通安全特征方程, 交通 安全, 风险分析 REFERENCES
[1] Migletz J, Fish JK, Graham JL. Roadway Delineation Practices Handbook. Report FHWA-SA-93-001. Wash-ington, D.C.: Federal Highway Administration; 1994. [2] Ogden K. Safer Roads: A Guide to Road Safety
Engi-neering. Cambridge: Avebury Technical; 1996. [3] IMIT. Guidelines for the Design of Road Infrastructures:
D.M. n. 6792, 5/11/2001. Rome: Italian Ministry of Infrastructures and Transports; 2001.
[4] Elvik R, Truls V. The Handbook of Road Safety Mea-sures. Oxford: Elsevire Science; 2004.
[5] Lamm R, Beck A, Ruscher T, Mailaender T, Cafiso S, La Cava G, Mathews W. How to Make Two Lane Rural Roads Safer. Scientific Background and Guide for Practical Application. Southampton: WIT Press; 2006.
[6] Madanu S, Li Z, Abbas M. Life-Cycle Cost Analysis of Highway Intersection Safety Hardware Improve-ments. ASCE J Transportation Engineering. 2010 Feb;136(2):129-140.
[7] De Leur P, Sayed T. Development of a Road Safety Risk Index. TRB J Transportation Research Record. 2002 Jan;1784:33-42.
[8] Montella A. Safety Reviews of Existing Roads: Quan-titative Safety Assessment Methodology. TRB J Trans-portation Research Record. 2005 Jan;1922:62-72.
[9] Cafiso S, La Cava G, Montella A, Pappalardo G. A Pro-cedure to Improve Safety Inspections Effectiveness and Reliability on Rural Two Lane Highways. Baltic J Road and Bridge Engineering. 2006 Mar;I(3):143-150. [10] Black KL, McGee HW, Hussain SF, Rennilson JJ. Service
Life of Retroreflective Traffic Signs. FWA-RD-90-101. Washington, D.C.: Federal Highway Administration; 1991.
[11] Wolshon B. Louisiana Traffic Sign Inventory and Man-agement System, Final Report. Baton Rouge: Louisi-ana State University; 2003.
[12] Long S, Qin R, Gosavi A, Wu CH, Ryan T, Noll C. Life Expectancy Evaluation and Replacement Schedule Development for LED Traffic Indicators. Report No. OR11.015. Jefferson City: Missouri Department of Transportation; 2011.
[13] Lindly JK, Yellapu K, Supriyasilp T. Evaluation of Ret-roreflectometers for the Alabama Department of Transportation. Report 02402. Tuscaloosa: University of Alabama; 2002.
[14] Bahar G, Masliah M, Erwin T, Tan E, Hauer E. Pavement Marking Materials and Markers: Real-World Relation-ship between Retroreflectivity and Safety over Time. Fi-nal Report for NCHRP Project 17-28. Washington, D.C.: National Cooperative Highway Research Program, National Research Council; 2006.
[15] Avelar, R, Carlson, P. Link between Pavement Marking Ret-roreflectivity and Night Crashes on Michigan Two-Lane Highways. TRB J Transportation Research Record. 2014 Dec;2404:59-67.
[16] Guo, Y, Liu, P, Liang, Q, Wang, W. Effects of Parallel-ogram-Shaped Pavement Markings on Vehicle Speed and Safety of Pedestrian Crosswalks on Urban Roads in China. Elsevier J Accident Analysis & Prevention. 2015 Oct;95(B):438-447.
[17] Klir GJ. Uncertainty and Information: Foundations of Generalized Information Theory. Hoboken: Wiley Inter-science; 2006.
[18] Hauer E. Observational Before-After Studies in Road Safety: Estimating the Effect of Highway and Traffic En-gineering Measures on Road Safety. Oxford: Pergamon Press; 1997.
[19] Ross, Jr, HE, Sicking DL, Zimmer RA, Michie JD. Rec-ommended Procedures for the Safety Performance Evaluation of Highway Features. NCHRP Report 350. Washington, D.C.: National Cooperative Highway Re-search Program, National ReRe-search Council; 2005. [20] McCullagh P, Nelder JA. Generalized Linear Models.
New York: Chapman and Hall; 1989.
[21] Kutner M, Nachtsheim C, Neter J, Li W. Applied Lin-ear Statistical Models. 5th Ed. New York: McGraw-Hill/ Irwin; 2004.