Open Research Online
The Open University’s repository of research publications and other research outputs
An investigation of diet selection as a technique for
determining the ideal protein for growing pigs
Thesis
How to cite:
Fairley, Rachel Anne Charlotte (1996). An investigation of diet selection as a technique for determining the ideal protein for growing pigs. PhD thesis The Open University.
For guidance on citations see FAQs.
c
1996 Rachel Anne Charlotte
https://creativecommons.org/licenses/by-nc-nd/4.0/ Version: Version of Record
Link(s) to article on publisher’s website: http://dx.doi.org/doi:10.21954/ou.ro.0000f786
Copyright and Moral Rights for the articles on this site are retained by the individual authors and/or other copyright owners. For more information on Open Research Online’s data policy on reuse of materials please consult the policies page.
y ;
u>
{
AN INVESTIGATION OF DIET SELECTION AS A
TECHNIQUE FOR D E T E ^ IN IN G THE IDEAL
PROTEIN FOR GROWING PIGS.
RACHEL A . CÎTAIRLEY
A thesis submitted in partial ftilfilment of the requirements of the Open University for the degree of Doctor of Philosophy
July 1995
Harper Adams Agricultural College in collaboration with the Roweu Research Institute
ProQuest Number: C507866
All rights reserved INFORMATION TO ALL USERS
The qu ality of this repro d u ctio n is d e p e n d e n t upon the q u ality of the copy subm itted. In the unlikely e v e n t that the a u th o r did not send a c o m p le te m anuscript and there are missing pages, these will be note d . Also, if m aterial had to be rem oved,
a n o te will in d ica te the deletion.
uest
ProQuest C507866
Published by ProQuest LLO (2019). C op yrig ht of the Dissertation is held by the Author. All rights reserved.
This work is protected against unauthorized copying under Title 17, United States C o d e M icroform Edition © ProQuest LLO.
ProQuest LLO.
789 East Eisenhower Parkway P.Q. Box 1346
ABSTRACT
A series of dietary choice experiments was carried out to discover if growing pigs can discriminate between two feeds with differing amino acid concentrations and use this ability to select a mixture of the two feeds to meet their amino acid requirements. A protein dietary choice experiment was carried out to investigate the best experimental setup for future dietary choice experiments. Two similar dietary choice experiments were carried out with lysine and threonine, where pigs discriminated between two feeds with differing lysine or threonine concentrations. However, they did not select a mixture of two feeds, choosing to eat predominantly from one feed. Experiments with differing levels of lysine and threonine and protein and lysine showed similar results. Where some mixing did occur, the resulting protein concentrations selected were so diverse that they were unlikely to be a reflection of their protein requirements. Individual variation in the selections made may derive from a preference for a particular feeder. An experiment was carried out which determined feeder preference and discovered that this had no effect on selections made when a choice of feeds was offered. An experiment was carried out to dicover if the importance of tryptophan in die control of protein intake meant that its intake was more strictly regulated than that of lysine or threonine. Once again pigs discriminated between the feeds, but did not select a mixture of the two feeds. A final experiment discovered that pigs can supplement an amino acid deficient diet with a solution of that amino acid to allow them to grow as well as pigs on diets with excess amino acid. In conclusion, pigs can discriminate between two feeds with differing amino acid concentrations, but do not use this ability to select a mixture of two feeds to meet their requirements.
DECLARATION
This thesis was composed by the author and is a record of work carried out by her on an original line of research. All sources of information are shown in the texts and listed in the references; all help given by others is indicated in the acknowledgments.
None of this work has been presented in any previous application for a degree.
Acknowledgments
This project was funded by the Silcock Fellowship, whose financial support I gratefully acknowledge. I would also like to acknowledge Forum Feeds for carrying out amino acid analysis of the feeds used in the tryptophan experiment; and Reading University Statistics Department for their help with the statistical analysis.
I would like to thank Dr Paul Rose and Dr Malcolm Fuller for all the help and adviCe they have given me. I would also like to thank David Carmichael, Tony Curtis, David Ferguson, Stewart Hall, Kate Harvey, David Mann, John Protheroe and Lucy Waldron for their help with the pig experiments; and Richard Page and Jayne Powles for their help with the laboratory analysis. Most of all I would like to thank my husband Simon for all his help and encouragement.
Published Work
FAIRLEY, R. A. C., ROSE, S. P. and FULLER, M.F. 1992. Selection of dietary lysine concentration by growing pigs. Nutrition Clininique et Metabotisme 6:111
FAIRLEY, R. A. C., ROSE, S. P. and FULLER, M.F. 1993. Selection of dietary lysine and threonine concentration by growing pigs. Animal Production 56:468-469A
ROSE, S. P. and FAIRLEY, R. A. C. 1993. Harper Adams Agricultural College news - pigs choose ideal diets. Pig Veterinary Journal 31:177-
178
FAIRLEY, R. A. C., ROSE, S. P. and FULLER, M.F. 1994. Selection of dietary tryptophan concentration by growing pigs. Proceedings of the Nutrition Society 53:199A
FAIRLEY, R. A. C., ROSE, S. P. and FULLER, M.F. 1994. Selection of dietary protein and lysine concentration by growing pigs. Proceedings o f the 45* Annual Meeting o f the European Association for Animal Production, Edinburgh, page 131
Contents
Page
List of Tables x
List of Figures xiv
1. Introduction 1
1.1. General Introduction 1
1.2. Amino Acid Biochemistry 6
1.3. Amino Acid Requirements of Growing Pigs 15
1.3.1. Ideal Protein 15
1.3.2. Methods used to determine amino acid 20 requirements of growing pigs.
1.4. Diet Selection 23
1.4.1. Selection of Protein Concentration 24
1.4.2. Training Period 25
1.4.3. Commercial Applications of Diet Selection 27 1.4.4. Selection of Amino Acid Concentration 28
1.4.5. Sensory Properties of Feed 31
1.4.6. Diet Selection Can Reflect Physiological 32 State
2. Experiments 34
2.1. Selection of dietary protein concentration by 34 growing pigs
2.1.1. Introduction 34
2.1.2. Methods and Materials 36
2.1.3. Results 41
(i) Selection of Dietary Protein 41 Concentration
(ii) Social Effects 47
(iii) Feed Presentation 49
2.1.4. Discussion 50
(i) Selection of Dietary Protein 50 Concentration
(ii) Social Effects 52
(iii) Feed Presentation 53
2.1.5. Conclusions 54
2.2. Selection of dietary lysine concentration by 56 growing pigs
2.2.1. Introduction 56
2.2.2. Methods and Materials 58
(i) Choice-fed pigs 58
(ii) Single-fed pigs 62
2.2.3. Results 65
(i) Choice-fed pigs 65
(ii) Single-fed pigs 69
2.2.4. Discussion 77
2.2.5. Conclusions 80
2.3. Selection of dietary threonine concentration by 81 by growing pigs
2.3.1. Introduction 81
2.3.2. Methods and Materials 82
(i) Choice-fed pigs 82
(ii) Single-fed pigs 85
2.3.3. Results 87
(i) Choice-fed pigs 87
2.3.4. Discussion 96
2.3.5. Conclusion 97
2.4. Selection of dietary lysine and threonine 98 concentration by growing pigs.
2.4.1. Introduction 98
2.4.2. Methods and Materials 99
2.4.3. Results 103
2.4.4. Discussion 113
2.4.5. Conclusions 114
2.5. Selection of dietary protein and lysine 115 concentration by growing pigs
2.5.1. Introduction 115
2.5.2. Methods and Materials 117
(i) Choice-fed pigs 117
(ii) Single-fed pigs 120
2.5.3. Results 122
(i) Choice-fed pigs 122
(ii) Single-fed pigs 131
2.5.4. Discussion 136
2.5.5. Conclusion 139
2.6. The effect of feeder preference on selection of 140 dietary protein and lysine concentration by growing
pigs.
2.6.1. Introduction 140
2.6.2. Methods and Materials 141
2.6.3. Results 145
2.6.4. Discussion 152
2.6.5. Conclusion 152
2.7. Selection of dietary tryptophan concentration by 153 growing pigs
2.7.1. Introduction 153
2.7.2. Methods and Materials 155
(i) Choice-fed pigs 155
(ii) Single-fed pigs 158
2.7.3. Results 160
(i) Choice-fed Pigs 160
(ii) Single-fed Pigs 163
2.7.4. Discussion 170
2.7.5. Conclusions 172
2.8. Selection of a lysine or tryptophan solution by pigs 173 fed diets of varying lysine or tryptophan concentration.
2.8.1. Introduction 173
2.8.2. Methods and Materials 174
(i) Lysine Experiment 174
(ii) Tryptophan Experiment 176
2.8.3. Results 178
(i) Lysine Experiment 178
' (ii) Tryptophan Experiment 180
2.8.4. Discussion 188
2.8.5. Conclusions 190
3. General Discussion 191
4. Conclusions 2(X)
References 202
Appendix A. Selection of dietary lysine concentration by 220 growing pigs with differing training period lengths.
Appendix B. Serum triglyceride and fi-hydroxybutyrate 224 determination.
List of Tables
Table Page
> 1.1. The Agricultural Research Council and the National 2 Research Council recommended amino acid requirements for
growing pigs.
1.2. Proposed balances of amino acids in the ideal protein for 17 pigs.
1.3. Ratios of essential amino acids in the ideal protein for 19 protein accretion and maintenance (taken from Wang and
Fuller, 1990).
2.1. Conq)osition (g/kg) and analysis of the basal feeds. 38 2.2. Effect of dietary choice, number of pigs per pen and food 42 presentation on weight gain, feed intake and feed conversion
efficiency.
2.3. Effect of dietary choice, number of pigs per pen and food 44 presentation on the amount of protein consumed (g/day).
2.4. Effect of dietary choice, number of pigs per pen and food 45 presentation on the proportion of higher protein food
consumed.
2.5. Effect of dietary choice, number of pigs per pen and food 46 presentation on the protein concentration consumed (g/kg
feed).
2.6. Composition (g/kg feed) and analysis of the basal feeds. 60 2.7. Effect of dietary choice treatment on weight gain, feed 67 intake and feed conversion efficiency of growing pigs in the
first two weeks of selection.
2.8. Effect of dietary choice treatment on the amount of 68 digestible lysine consumed by growing pigs.
2.9. Effect of dietary choice treatment on the digestible lysine 70 concentration consumed by growing pigs.
2.10. Effect of dietary choice treatment on the proportion of 71 higher lysine feed consumed by growing pigs.
2.11. Effect of dietary lysine concentration on weight gain, 76 feed intake, feed conversion efficiency and amount lysine
consumed in single-fed pigs.
2.12. Composition (g/kg feed) and analysis of the basal feed. 84 2.13,. Effect of dietary choice on weight gain, feed intake and 89 feed conversion efficiency.
2.14. Effect of dietary choice on the amount of threonine 90 consumed.
2.15. Effect of dietary choice on the threonine concentration 91 selected.
2.16. Effect of dietary choice on the proportion of higher 92 threonine feed selected.
2.17. Effect of dietary lysine concentration on weight gain, 95 feed intake, feed conversion efficiency and amount threonine
consumed in single-fed pigs.
2.18. Composition (g/kg feed) and analysis of the basal low 1(X) lysine low threonine feed.
2.19. Effect of dietary choice on weight gain, feed intake and 106 feed conversion efficiency.
2.20. Effect of dietary choice on the proportion of higher 107 lysine feed consumed.
2.21. Effect of dietary choice on the lysine concentration 109 consumed.
2.22. Effect of dietary choice on the amount of lysine 110 consumed.
2.23. Effect of dietary choice on threonine concentration 111 consumed.
2.24. Effect of dietary choice on the amount of threonine 112 consumed.
2.25. Composition (g/kg feed) and analysis of the basal feeds. 119 2.26. Effect of dietary choice on weight gain, feed intake and 125 feed conversion efficiency.
2.27. Effect of dietary choice on the proportion of high 126 protein feed consumed.
2.28. Effect of dietary choice on the protein concentration 127 consumed.
2.29. Effect of dietary choice on the amount of protein 128 consumed.
2.30. Effect of dietary choice on the lysine concentration 129 consumed.
2.31. Effect of dietary choice on the amount of lysine 130 consumed.
2.32. Effect of dietary choice on serum triglyceride and B- 132 hydroxybutyrate concentrations.
2.33. Effect of dietary protein and lysine concentration on 134 weight gain, feed intake and feed conversion efficiency in
single-fed pigs.
2.34. Conçosition (g/kg feed) and analysis of the feeds. 142
2.35. Effect of treatment on weight gain. 148
2.37. Effect of treatment on feed conversion efficiency. 150 2.38. Effect of treatment on proportion of feed consumed 151 from the preferred feeder.
2.39. Conq)osition (g/kg feed) and analysis of the basal feed. 157 2.40. Effect of dietary choice treatment on weight gain, feed 162 intake and feed conversion efficiency.
2.41. Effect of dietary choice treatment on the proportion of 164 higher tryptophan feed consumed.
2.42. Effect of dietary choice treatment on the tryptophan 165 concentration consumé.
2.43. Effect of dietary choice treatment on the amount of 166 tryptophan consumed.
2.44. Effect of dietary tryptophan concentration on weight 169 gain, feed intake, feed conversion efficiency and amount
tryptophan consumed in single-fed pigs.
2.45. Effect of dietary lysine concentration on weight gain, 179 feed intake and feed conversion efficiency before and after the
addition of lysine solution.
2.46. Effect of dietary lysine concentration on amount lysine 181 consumed, lysine concentration consumed and proportion of
liquid drunk from the trough assigned to contain lysine solution, before and after the addition of lysine solution.
2.47. Effect of dietary tryptophan concentration on weight 183 gain, feed intake and feed conversion efficiency before and
after the addition of tryptophan solution.
2.48. Effect of dietary tryptophan concentration on amount 185 tryptophan consumed, tryptophan concentration consumed and
proportion of liquid drunk from the trough assigned to contain tryptophan solution, before and after the addition of tryptophan solution.
List of Figures
Figure Page
2.1. Pen Layouts. 39
2.2. Protein concentration selected by individual growing pigs 48 on different dietary choices.
2.3. Pen Layouts. 61
2.4. Lysine concentration selected by individual growing pigs 66 on different dietary choices.
2.5. The change in lysine concentration selected by growing 72 pigs with an eight-day training period.
2.6. The change in lysine concentration selected by growing 73 pigs with a fourteen-day training period.
2.7. Mean weight gain of single-fed pigs fed differing 75 digestible lysine concentrations.
2.8. Threonine concentration selected by individual growing 88 pigs on different dietary choices.
2.9. Mean weight gain of single-fed pigs fed differing 94 digestible threonine concentrations.
2.10. Lysine concentration selected by individual growing pigs 104 on different dietary choices.
2.11. Threonine concentration selected by individual growing 105 pigs on different dietary choices.
2.12. Protein concentration selected by individual growing 123 pigs on different dietary choices.
2.13. Mean weight gain of single-fed pigs with differing 133 protein and lysine concentrations.
2.14. Proportion of feed eaten from the left feeder when both 135 feeders contain the same feed.
2.15. Proportion of feed eaten from the left feeder when both 146 feeders contain the same feed.
2.16. Protein concentration selected by individual pigs during 147 the second selection period.
2.17. Tryptophan concentration selected by individual growing 161 pigs on different dietary choices.
2.18. Weight gain of single-fed pigs fed differing tryptophan 168 concentrations.
2.19. Weight gain of individual choice-fed pigs consuming 171 differing tryptophan concentrations.
2.20. Proportion liquid consumed from the trough assigned to 182 contain lysine solution before and after the addition of lysine
solution.
2.21. Proportion liquid consumed from the trough assigned to 187 contain tryptophan solution before and after the addition of
tryptophan solution.
1. Introduction
1.1. General Introduction
The amino acid composition of the diet of growing pigs is very important to their growth and development. For example pigs fed a diet with a low lysine concentration of 7.2 g kg * grew at only 70% of the growth rate of pigs fed a diet containing 8.7 g kg'* lysine (Rogerson and Campbell,
1983), while pigs fed a low tryptophan diet grew less than 75% of the rate of pigs offered a higher tryptophan diet (Lenis, Diepen and Goedhart, 1990).
Despite understanding the need for accurate amino acid requirements, there is still no widespread agreement on the optimal concentrations of amino acids. The Agricultural Research Council (ARC, 1981) and the National Research Council (NRC, 1988) published markedly different recommended amino acid requirements (Table 1.1).
These differences could depend on many factors, such as the methods used to measure the requirements. The majority of experiments carried out to measure amino acid requirements are dose-response assays, which
TABLE 1.1. The Agricultural Research Council and the National Research Council recommended amino acid requirements fo r growing pigs.
Concentration (g/kg Protein) ARC (1981) NRC (1988) Lysine 70 50 Methionine + Cystine 35 27 Threonine 42 32 Tryptophan 10 8 Isoleucine 38 31 Leucine 70 40 Histidine 23 15 Phenylalanine + Tyrosine 67 44 Valine 49 32
offer varying concentrations of an amino acid and measure the response. The response parameters that are measured vary between experiments, the most common are growth and efficiency of feed utilisation (Schutte, Bosch, Lenis, Jong and Diepen, 1990), carcass quality (Rogerson and Canq)bell, 1982; Noblet, Henry and Dubois, 1987; Lenis et al, 1990;
Lenis and Diepen, 1990) and nitrogen retention (Seve, 1983; Southern and Baker, 1983; Rosell and Zimmerman, 1985; Lewis and Peo, 1986). Even in the same experiment these different measurements often indicate different optimal amino acid concentrations (Schutte et al, 1990).
Differences may also occur between different groups of pigs. If the concentration of amino acid in the feed is measured, the optimal amount will differ between pigs of different ages, sexes and breeds as their requirement for protein differs. The NRC (1988) recommendations for amino acid requirements are expressed in this way, so this may account for some of the differences seen in Table 1.1.
Diet selection is a technique that has been used to allow pigs to select a diet to meet their requirements from a choice of feeds. Early studies gave a free choice of a number of feed ingredients, and this resulted in increased growth rates (Evvard, 1915). More recent work has concentrated on providing a choice two feeds that differ in only one
nutrient, usually protein, to allow growing pigs to determine the protein concentration of their diet (Kyriazakis, Emmans and Whittemore, 1990; Bradford and Gous, 1991a).
The general objective of this project was to discover how growing pigs respond to a choice between feeds that differ only in the concentration of a single amino acid.
The specific objectives of this project were:
1. a) To investigate whether growing pigs will discriminate between two
feeds that differ only in the concentration of a single amino acid.
b) To discover whether growing pigs will select a mixture of two feeds that differ only in the concentration of a single amino acid, to meet their amino acid requirements.
2. To examine possible explanations for pigs not selecting a mixture of two feeds in the single amino acid experiments.
3. To explore an alternative method of diet selection by providing the pigs with supplemental amino acids in solution.
1.2. Amino Acid Biochemistry
This chapter is not intended as a review of current research on amino acid biochemistry, as that is outside the scope of this project. It is intended as a background for amino acid nutrition. All facts that are not specifically referenced came from Stryer (1988) and Bender (1985) and these two books provide a more in depth coverage of the subject.
Amino acids are the basic units of proteins. There are about twenty amino acids present in proteins, each with a different side chain. All proteins are constructed from these amino acids. Amino acids consist of an amino group (NHj), a carboxyl group (COOH), a hydrogen atom and a distinctive side chain bonded to the a-carbon atom.
NH2 . NH3+
R = Side H - C - COOH H - C - COO
Chain | |
R R
un-ionized form Dipolar ion (zwitterion)
At neutral pH amino acids in solution are predominantly dipolar ions. The degree of ionization changes at different pfi.
The twenty amino acids can be classed into six groups according to the structure of their side chains.
(i) Aliphatic amino acids - glycine, alanine, valine, leucine, isoleucine and proline.
(ii) Aromatic amino acids - phenylalanine, tryptophan and tyrosine.
(iii) Sulphur amino acids - methionine and cysteine.
(iv) Hydroxyl amino acids - serine and threonine.
(v) Basic Amino acids - arginine, lysine and histidine.
(vi) Acidic amino acids - asparagine, aspartate, glutamate and glutamine.
Pigs can make only nine of the twenty amino acids. Those amino acids that cannot be made must be obtained from food. The amino acids that cannot be made are called essential amino acids, whereas the amino acids that can be made are termed non-essential. The essential amino acids for pigs are histidine, isoleucine, leucine, lysine, methionine, phenylalanine.
threonine, tryptophan and valine. Of the eleven non-essential amino acids in pigs two, cysteine and tyrosine, are made from methionine and phenylalanine, respectively, which are essential, so they can be considered semi-essential. Arginine is produced in the urea cycle, so can also be considered semi-essential. In humans this amount of arginine is sufficient for adult growth, but not for children, in growing pigs enough arginine is produced to allow growth at two thirds of the normal rate (ARC, 1981).
Amino Acid P egradatioQ
Proteins and amino acids present in excess of needs cannot be stored. All proteins are degraded to amino acids by proteases, and excess amino acids are degraded by specific oxidative enzymes. The resulting carbon skeletons are utilised in metabolic pathways.
1. Deamination. The ammonium ions produced through deamination are highly toxic, so must be got rid of quickly. In mammals ammonia is converted to urea which is very soluble and is excreted in urine. The major site of amino acid degradation in mammals is the liver. The c l
amino group of many amino acids is transferred to a-keto-glutarate to form glutamate which is oxidatively deaminated to yield
e.g. Aspartate + a-keto-glutarate ^ oxaloacetate + glutamate
Serine and threonine can be directly deaminated, because they have a hydroxyl group. Serine loses a hydrogen atom from its a-carbon and a hydroxyl group from its fi-carbon atom to yield aminoacrylate. This unstable conq)Ound reacts with H2O to give pyruvate and
Some of the ammonium ions produced in the breakdown of amino acids are consumed in the biosynthesis of nitrogen confounds. The excess ammonium ions are converted into urea by the urea cycle.
combines with CO2, ATP and H2O to form carbamoyl phosphate. The
carbamoyl group is transferred to ornithine to form citrulline. Citrulline then condenses with aspartate, which provides the other nitrogen atom for urea, to form argininosuccinate. Argininosuccinase then cleaves argininosuccinate to form fumarate and arginine. Arginine is hydrolysed to urea and ornithine.
The Urea Cvcle Fumarate Arginine H2O Urea U N - C - NH Ornithine Argininosuccinate Aspartate Carbamoyl phosphate R - C - NH, Citrulline O CO2 + NH4+
The formation of its incorporation into carbamoyl phosphate and the subsequent synthesis of citrulline occur in the mitochondrial matrix. In contrast the next three reactions of the urea cycle, which lead to the formation of urea, take place in the cytosol.
The urea cycle is linked to the citric acid cycle by fumarate. Fumarate is hydrated to malate, which is in turn oxidised to oxaloacetate. Oxaloacetate can then be transaminated to aspartate or can be condensed with acetyl CoA to form citrate. Oxaloacetate can also be either converted into glucose by the gluconeogenic pathway or converted to pyruvate.
Citrulline Aspartate, Ornithine Urea Cycle Urea Arginino succinate Arginine Citrate Oxaloacetate f
Malate Citric Acid
f
CycleFumarate
Succinate
2. Fate of Carbon Skeletons. The strategy of amino acid degradation is to form major metabolic intermediates that can be converted into glucose or be oxidised by the citric acid cycle. The carbon skeletons of the twenty amino acids are degraded into only seven molecules: pyruvate, acetyl CoA, acetoacetyl CoA, a-keto-glutarate, succinyl CoA, fumarate and oxaloacetate.
Amino acids that are degraded to acetyl CoA or acetoacetyl CoA are called ketogenic, because they give rise to ketone bodies. Amino acids that are degraded to pyruvate, a-keto-glutarate, succinyl CoA, fumarate and oxaloacetate are called glucogenic. Net glucose synthesis is possible because these are citric acid intermediates and pyruvate can be converted into phosphoenol-pyruvate and then into glucose. Mammals lack a pathway for the synthesis of glucose from acetyl CoA or acetoacetyl CoA.
Lysine is a ketogenic amino acid which is ultimately converted to acetoacetyl CoA. This can occur via two distinct pathways.
Sacckropine Lysine (x-Aminoadipic ô-Semialdehyde i a-Aminoadipic Acid I a-Ketoadipic Acid I Glutaryl CoA i Glutaconyl CoA I Crotonyl CoA I 6-Hydroxybutyryl i Acetacetyl CoA I Acetyl CoA e-Acetyllysine
1
c-Acetoamide a-ketocaproicacid I €-Amino-a-keto caproic acid i Pipecolic AcidLysine condenses with a-keto-glutarate and is reduced to form saccharopine, which is cleaved to release glutamate and the semialdehyde
of 2-aminoadipate. The semialdehyde is oxidised to form 2-aminoadipate, which can be transaminated to 2-ketoadipate which can be converted to crotonyl CoA. In mammals lysine is degraded by way of saccharopine in the liver, but the pipecoloic acid pathway may be the major route of lysine catabolism in the brain. It has also been suggested that lysine can be catabolised to form homocitrulline and homoarginine (Ryan and Wells,
1966).
Threonine can be directly deaminated by threonine dehydratase as mentioned above:
Threonine a-Ketobutyrate +
The a-ketobutyrate molecule formed is oxidatively decarboxylated to form propionyl CoA, which eventually becomes oxaloacetic acid, an intermediate in the citric acid cycle (McGilvery and Goldstein, 1983). Threonine can also be degraded by a dehydrogenase reaction to form glycine and acetyl CoA, This means that threonine is both glucogenic and ketogenic (McGilvery ^ d Goldstein, 1983).
to pyruvate), one in formate and four as crotonyl CoA, which is derived from a-ketoadipic acid and follows the same degradation pathway as lysine (McGilvery and Goldstein, 1983).
1.3. Amino acid requirements of growing pigs.
The amino acid requirements of pigs can be described in several different ways. Often, amino acid requirements are described as a concentration of the diet provided (NRC, 1988). The recommended concentration will change with the age of the pig, and the related change in the recommended crude protein concentration. The NRC (1988) recommended five different amino acid concentrations depending on the live-weight of the pig. Another common method of describing amino acid requirements is as a daily amount. The ARC (1981) used this method, but once again the daily amount will change with age and protein concentration. The ARC (1981) also described the amino acid
requirements of growing pigs as a proportion of protein, known as ideal
protein.
L 3 J . Ideal Protein
An ideal protein has been defined as one which supplies the optimal balance of amino acids for growth and maintenance (Cole, 1979). Pigs require amino acids in a certain ratio, which is determined by their requirements for growth and maintenance. The concept is based on the
assunq)tion that the ratio of amino acids required to deposit lean tissue will be the same for all pigs, regardless of age, weight, breed or sex, so that the ideal protein for growth will be the same for all pigs (Cole, 1979). The balance of amino acids required for maintenance is different to that required for growth, so there are slight differences in the overall ideal protein as the proportion of amino acids used for maintenance and growth changes.
There have not been any experiments to examine the optimal amino acid requirements of pigs at different crude protein concentrations. However, it has been shown that the optimal lysine requirement of chickens remains the same, when expressed as a proportion of protein, but not as a proportion of the diet, at different protein concentrations (Morris, Al- Azzawi, Gous and Simpson, 1987; Surisdiarto and Farrell, 1991).
The ARC (1981) expressed the amino acid requirements of growing pigs as their ratio to protein. This ratio was determined from dose-response experiments and where information was scarce from the ratios of amino acids to protein in pig tissue. Since then there have been several studies which have investigated the balance of amino acids. The results of some of these studies are shown in Table 1.2, and it can be seen that while
t
i
9k.I
I.
Î
■I
.5I
i '5'I
■§I
<NI
r r , m I—I w i «—i <N m ooI I
On m <N 0\ <N »r> «n ON »nII
I fs) On fS 00 On NO m NO m m ro ^ I ro NO 00 (N Q oo -s. On I—I m NO fs OO oo o m oo «n oo On 00JÎ
S i i i i s
there is a broad agreement on the optimum balance, there is still a great deal of variation in the recommendations for individual amino acid proportions.
The differences between the optimal balance of amino acids for maintenance and growth have been investigated by feeding a range of amino acid concentrations, and plotting protein accretion against amino acid intake (Fuller, McWilliam, Wang and Giles, 1989). The slope of the resultant regression line indicated the requirement of that amino acid for growth while the intercept indicated the requirement for maintenance. Table 1.3 shows the ratios of the different ideal balances for growth and maintenance. Greater proportions of threonine, tryptophan and methionine plus cystine are required relative to lysine for maintenance; and isoleucine, leucine, valine and phenylalanine plus tyrosine are required in smaller proportions relative to lysine. Despite these differences, however, in a later experiment which looked at the overall ideal protein at different planes of nutrition, where the ratio between growth and maintenance should differ, Wang and Fuller (1990) found no differences between the ideal protein at the different planes of nutrition.
TABLE 1.3. Ratios o f essential amino acids in the ideal protein fo r protein accretion and maintenance (taken from Wang and Fuller, I99Ô)
Ratio o f Amino Acids in Ideal Balance Protein Accretion Maintenance Lysine 100 100 Methionine + Cystine 53 136 Threonine 69 147 Tryptophan 18 31 Isoleucine 63 44 Leucine 115 64 Phenylalanine + Tyrosine 124 103 Valine 77 56
1.3.2. Methods used to determine amino acid requirements of growing pigs.
(i) Analysis of Body Tissue. The amino acid ratio of pig tissue has been used to determine the balance of amino acids in an ideal protein, as the primary function of dietary amino acids is to form body proteins. This approach was used by the ARC (1981) in formulating their ideal balance of amino acids. However, Chung and Baker (1992) discourage this practice because of the variable turnover rates of individual amino acids. It is also possible that the amino acid con^osition of the whole body changes over time. Kyriazakis and Emmans (1993b) examined this idea and found that there was a systematic change in amino acid composition as a function of body weight.
(ii) Dose-Response Experiments. The main approach to measuring amino acid requirements is the dose-response experiment, where pigs are given varying concentrations of a single amino acid and the requirement is determined as the concentration at which a maximal response is obtained. There are many responses which can be measured, the simplest being growth and efficiency of feed utilisation (Schutte et al, 1990). Most recent
studies have combined growth and feed intake measurements with other
characteristics such as carcass quality (Rogerson and Canqibell, 1982; Noblet et al, 1987; Lenis et al, 1990; Lenis arid Diepen, 1990) or
nitrogen retention (Seve, 1983; Southern and Baker, 1983; Rosell and Zimmerman, 1985; Lewis and Peo, 1986). The plasma concentration of a specific amino acid should not increase until that amino acid is present in the diet in excess of requirements. Plasma amino acid concentrations, therefore, are often measured in dose-response experiments, this is frequently carried out with plasma urea measurements (Taylor, Cole and Lewis, 1982, 1983 and 1985; Seve, 1983; Southern and Baker, 1983; Rosell and Zimmerman, 1985; Lewis and Peo, 1986). Oxidation of an amino acid occurs when that amino acid is present in excess of needs, and this can be measured directly if the amino acid is labelled with Oxidation of an indicator amino acid can also be measured to give a reasonably accurate requirement for other amino acids. This technique has been used to measure amino acid requirements, especially in very young pigs where the time span does not allow accurate growth measurements (Kim and Bayley,1983; Kim, Elliott and Bayley, 1983; Kim, McMillan and Bayley, 1983; Lin, Smith and Bayley, 1986).
(iii) Deletion of a single amino acid. Wang and Fuller (1989) estimated the balance of amino acids in an ideal protein using a method of amino
acid deletion. It was based on the fact that the removal of a non-limiting amino acid has no effect on nitrogen retention, until that amino acid becomes limiting. Using this principle they fed a series of diets that had 20% of each essential amino acid removed. From the resulting nitrogen retention data they were able to calculate a balance of amino acids in the ideal protein.
1.4. Diet Selection
In order to survive, animals must be capable of satisfying their nutrient requirements for growth, maintenance and reproduction by selecting a diet from available food sources. Research in this area suggests that, as well as satisfying their requirements, wild animals are capable of optimising their food intake, especially in respect of energy intake (Lea,
1979).
The earliest research carried out on the diet selection of pigs involved allowing a free choice of diet from a number of different feeds. Evvard (1915) offered pigs between seven and nine feeds, including water and minerals as well as cereal and protein sources, and allowed the animals to choose their own diets. This resulted in increased growth rates, with some of the pigs growing faster than any previously recorded at the Iowa Agricultural Station. At the start of this trial the pigs tended to eat relatively high concentrations of protein concentrates, and this declined as the pigs grew and required less protein.
In 1967, Braude reviewed choice feeding as a method of feeding and concluded that growth rates seldom equalled, let alone surpassed, those
of single fed pigs. Most of the trials reviewed offered the pigs a choice of a cereal and a protein supplement, and many found that single fed pigs had better results (Brown, 1956; Adams and Ward, 1957; Hutchison, Terrill, Jensen, Becker and Norton, 1957), most of the remaining experiments reviewed found no difference between single or choice-fed pigs (Thrasher, Mullins and Newman, 1961; Rerat and Henry, 1964; Hoick and Tribble, 1965).
L 4,L Selection of Protein Concentration
More recent work has tended to concentrate on the diet selections made when pigs are offered two diets that differ in only one respect. Extensive work has been carried out recently in Edinburgh on diet selection of crude protein level in pigs. When singly housed pigs are offered feeds similar in'all respects, except crude protein level, it was concluded that they can select a balance of the feeds that reflects their requirements for protein (Kyriazakis, Emmans and Whittemore, 1987; Kyriazakis et al,
1990), provided that the feeds offered did not restrict the pig's selection (Kyriazakis and Emmans, 1989). The crude protein level selected by the pigs at Edinburgh tended to be around 205 g kg feed'^ for 12-30 kg pigs, and the level selected decreased over time (Kyriazakis et al, 1990).
Additional treatments were carried out with pigs fed the single feeds used, to gain an idea of pig perfommce on the feeds used. Of these single-fed pigs the best growth rate occurred on the feed with a crude protein level of 217 g kg feed \ but this was less than the growth rate of most of the choice-fed pigs.
Pigs were only capable of selecting their requirements if one of the feeds offered was above and the other feed was below their requirements. If both feeds were below the requirements, the pigs ate mainly the least limiting feed, but continued to sample from the other feed. However, if both feeds were above the requirements, the pigs ate the feed with the lowest excess (Kyriazakis, Emmans and Whittemore, 1989).
1.4,2, Training Period
Allowing pigs to experience feeds prior to the selection period improved the ability of the pigs to select an appropriate diet, if both feeds were offered for alternative 24 hour periods for six days (Kyriazakis, Emmans and Whittemore, 1988). The diet selections of pigs were not affected by the position of the two feeders. Changing the positions of the feeders in the middle of a trial did not affect the diets selected by the pigs, but some
pigs took a few days to respond to a change of position (Kyriazakis et al,
1990). This suggests that pigs use the position of the feeders as a cue to the nutrient composition of the feed inside, but are constantly updating this information from some physiological response to the feed eaten.
Bradford and Gous (1991a), carried out some similar work with group housed pigs, offering them a choice of feeds differing only in crude protein content and with a training period of eight days. They concluded that pigs could differentiate between feeds differing in protein content and select a balance of the two feeds to meet their changing requirements. However, it is not possible to determine an individual pig's feed selection when it is housed in a group, so it is not possible to tell whether individuals were making daily selections.
Adding an anti-nutritive ingredient, such as rapeseed meal, affects the outcome of diet selections if it is present in only one of the feeds offered (Kyriazakis and Emmans, 1992). Where one feed contained rapeseed and the other feed offered did not, the pigs chose the feed without rapeseed added, regardless of the protein contents of the two feeds offered. When both feeds contained rapeseed meal, the pigs made selections according to their protein requirement. The included level of rapeseed meal had no
effect on performance when fed as a single feed.
1.4.3. Commercial Applications of Diet Selection
Selection of dietary crude protein content has been investigated as a commercial feeding system, since evidence from singly housed pigs suggests that choice-fed pigs grow at a similar or better rate than single fed pigs. Only two feeds need to be formulated for the entire growing period and this would allow protein to be used more efficiently than present systems. Bradford and Gous (1991b) directly compare choice feeding systems with phase feeding (feeding a number of feeds with sequentially lower protein contents to try and match changing requirements) and single feeding systems. They found that phase feeding
improved feed conversion efficiency and caused a decline in feed intake and P2 backfat thickness, and these effects grew with the number of phases in the system. Choice feeding was not significantly different from either phase feeding or single feeding. Phase feeding requires more different feeds than free choice feeding. Kyriazakis and Emmans (1989) suggest choice feeding could be used where growth and fattening characteristics need to be observed, such as in selection stock, and where the fatness desired by the animal is no more than that desired by the
farmer, such as in young pigs or boars. An experiment with weaned piglets offered a choice of diets with differing protein and energy concentrations reported that providing a choice of diets reduced feed costs by 20% (Dams, Edwards, Tibbie, Toplis and Close, 1994a and b).
Other studies on the commercial viability of diet selection have had less success. When pigs were offered a choice between a grower and a finisher feed, they had a marked preference for the grower feed, which resulted in increased fatness and feed costs (Gill, Sanchez-Serrano, English, Robledo and Roden, 1994). Early weaned piglets fed either a high cost diet, a low cost diet or a low cost diet with a choice of supplement, performed better on the two single diets than on any of the choices offered (Gill, Robledo, English and Sanchez-Serrano, 1994). In a series of experiments on weaner piglets and grower/finisher pigs. Close (1994, personal communication) concluded that the choices made by pigs tend to be inconsistent. '
1.4,4. Selection of Amino Acid Concentration
Pigs can not only differentiate between the quantities of protein in feeds, but also appear to be able to differentiate between proteins of different
quality. Pigs offered a choice between a protein-tfee diet and casein or casein supplemented with synthetic methionine (the first limiting amino acid in casein), tended to avoid the protein-free feed in preference for either casein alone or the supplemented casein. The supplemented casein, however, was preferred to the unsupplemented casein (Robinson, 1975). Henry (1985) describes an earlier experiment where pigs were offered a similar choice between a protein-free feed and a feed with a set level of protein, and were unable to select protein at a level optimal for growth.
Pigs offered a choice between a lysine-deficient feed and the same feed with supplemental lysine showed a slight preference for the supplemented feed (Robinson, 1975). Devilat, Pond and Miller (1970) offered pigs the choice between a complete diet and a diet deficient in some amino acids, and the pigs ate mainly the complete diet. When offered a choice of diets with an additional 4% of synthetic amino acids, pigs had a definite order of preference with an excess of threonine being the most acceptable, then lysine, arginine, methionine and tryptophan (Edmonds etal, 1987). Henry
(1987), found that, while some selection occurred when pigs were offered diets that differed only in their lysine content, it was not constant throughout the different treatments. This is probably because many of the choices were limiting, offering two feeds both below the requirements for
lysine (70 g kg protein \ ARC, 1981). The results also changed from week to week as feeder position was changed, thus the pigs were prevented from using this as a cue for feed quality. Another experiment with weanling pigs offered a choice of feeds with different lysine concentrations showed a great deal of variation in individual intakes of each feed. Half these pigs had no training period, and the other half had six days alternate access to the feeds, so this may explain some of the variation (Dalby, Varley, Forbes and Jagger, 1994),
Chicks offered a choice of feeds with either adequate or deficient lysine were able to select a mixture of the two feeds that allowed them to grow at up to 77% of the rate of chicks fed only the adequate lysine feed (Newman and Sands, 1983). When offered a choice of diets with 4% excesses of amino acids, chickens preferred an excess of lysine to an excess of methionine, threonine or arginine, while an excess of tryptophan was preferred least (Edmonds and Baker, 1987). Captive White-crowned Sparrows have also shown an ability to select an adequate diet for moulting from two feeds differing in sulphur amino acids (Murphy and King, 1987), and can maintain their body weight or restore lost weight when offered a choice of feeds with differing lysine or valine concentrations (Murphy and King, 1988).
Laboratory rats appear to be able to regulate their intakes of single amino acids when offered a choice of two foods that differ in amino acid composition. When rats were offered a choice of feeds that consisted of a casein diet and a diet with an amino acid mixture that was deficient in lysine and methionine they were able to regulate their intake of both amino acids, although the intake of methionine was more tightly regulated than that of lysine (Muramatsu and Ishida, 1982). Rats were also capable of regulating lysine intake when offered two foods both based on gluten but with different lysine contents (Muramatsu and Ohya, 1982). Rats also appear to be able to regulate their intakes of phenylalanine (Yamamoto, Makita and Muramatsu, 1984), threonine (Yamamoto, Suzuki and Muramatsu, 1985) valine, leucine and isoleucine (Yamamoto and Muramatsu, 1987a) and histidine and arginine (Yamamoto and Muramatsu, 1987b). Although the intake of these amino acids was regulated by individual rats to allow a normal growth rate, there was a great deal of individual variation in the daily intake.
L4.5. Sensory Properties of Feed
Pigs do not appear to make selections based on the taste of feeds. When weanling pigs were offered two feeds differing in lysine concentration,
their selections were the same whether or not one of the feeds was presented with an additional flavour (Dalby et al, 1994). Laboratory rats
also do not select their diet on taste. If quinine is present in a balanced food they will eat it in preference to a food with added saccharin that is imbalanced despite the fact they prefer saccharin to quinine at other times (Larson et al, 1971). Rats which had inqiaired taste from gustatory
deafferation were still able to select a balanced diet, although this diet was different from the diet of control rats, the treated rats having a reduced preference for saccharin (Miller and Teates, 1986).
L4.6. Diet Selection Can R ^ e c t Physiological State
Pigs are able to conq>ensate for previous underfeeding of protein if they are given a choice of feeds differing in protein concentration (Kyriazakis and Emmans, 1991). Pigs fed a low protein feed until they reached 16 kg liveweight had more lipid and a lower body protein: ash ratio than pigs fed a high protein feed, when these pigs were then given a choice between the high and low protein feeds (with a six day training period first), the pigs previously fed the low protein feed selected a higher level of protein, grew faster, had a higher feed intake and were more efficient than those previously fed the high protein feed. At 33 kg the lipid weights were
similar for both sets of pigs. Rats are also able to make choices to reflect their physiological state, for instance pregnant and lactating rats increased their protein consun^tion (Leshner, Seigel and Collier, 1972); pancreatectomized rats, that had previously shown diabetic symptoms, increased fat and protein intakes and decreased carbohydrate intake (Richter and Schmidt, 1941).
2. Experiments
2.1. Selection of dietary protein concentration by growing pigs
2.1.1. Introduction
Recent work has shown that growing pigs, when offered a choice of two feeds with different protein concentrations can select a balance of the two feeds which meets their protein requirements. The two feeds should be similar in all other respects and the choices offered should be non-limiting (Emmans,1991), to allow the pigs to select their protein requirement. Performance of these choice-fed pigs is no different to that of pigs fed on only one of the feeds, and the protein concentration selected decreases with time, as the relative requirements for growth and maintenance change (Kyriazakis, Emmans and Whittemore, 1990, Bradford and Gous,
1991).
The present experiment was conducted to investigate this ability of pigs to discriminate between feeds which differed in protein concentration, and to discover if they could select a mixture of the two feeds that met their protein requirements. Previous work has been carried out on pigs housed
singly (Kyriazakis et al, 1990) and on pigs housed in groups (Bradford
and Gous, 1991), and this experiment looked at both these housing options to discover if they have any effect on the diets selected. The feed was presented as either meal or pellets to discover if this had any effect on the diets selected.
2.1.2. Methods and Materials
A diet selection experiment was conducted at the experimental pig house, Harper Adams Agricultural College, Shropshire. Six (3 x 2) dietary treatments were used: three choice-feeding treatments consisting of a choice between a high and a low protein feed and two forms of feed presentation (pellets and meal). Half the house was used for singly penned pigs and half for groups of three pigs. Forty eight male pigs, approximately seven weeks old and with a mean weight of 15.3 kg, were allocated at random to pens, with either one pig or three pigs per pen. The house was filled over two weeks (24 pigs each week) and these were considered as two time blocks.
The three dietary choices provided were:
1. High Protein (225 g kg'O + Low Protein (98 g kg^)
2. High Protein (225 g kg O + Medium Low Protein (140 g kg O 3. Medium High Protein (178 g kg O + Low Protein (98 g kg 0
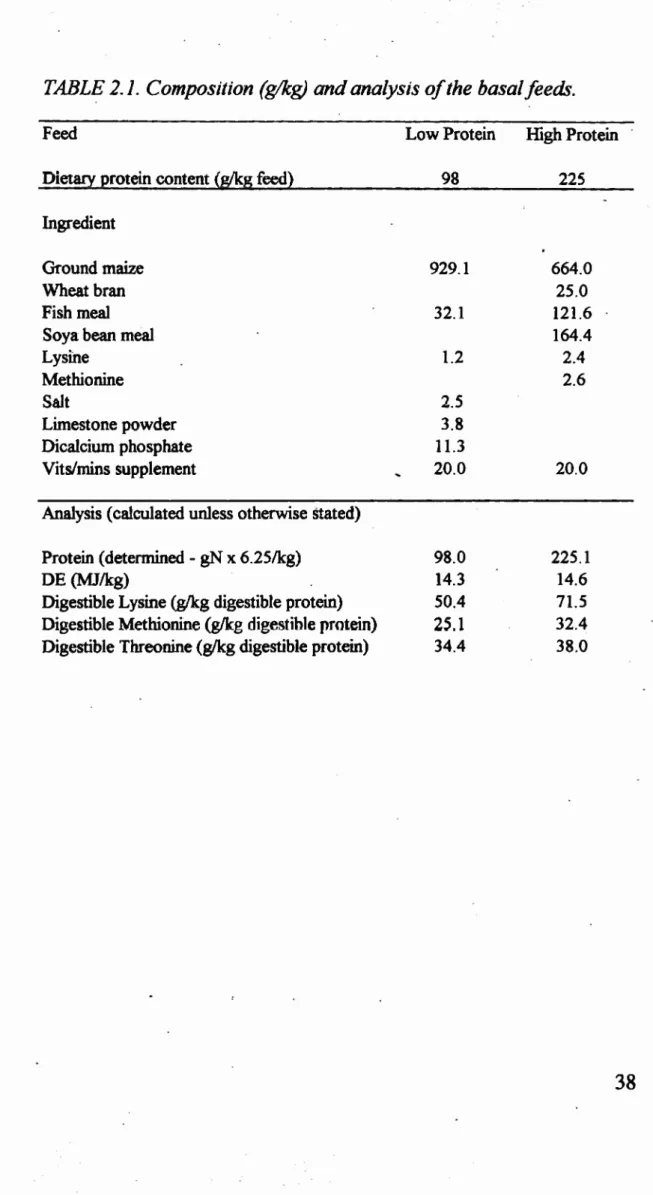
The two basal feeds were formulated to contain 98 g protein kg^ (low protein), and 225 g protein kg^ (high protein). The composition of these
two feeds is shown in Table 2.1. Two intermediate feeds (140 g and 178 g protein kg % medium low and medium high protein respectively) were made by appropriate blending of the two basal feeds. The feeds used were based on those used by Bradford and Gous (1991) in a similar experiment.
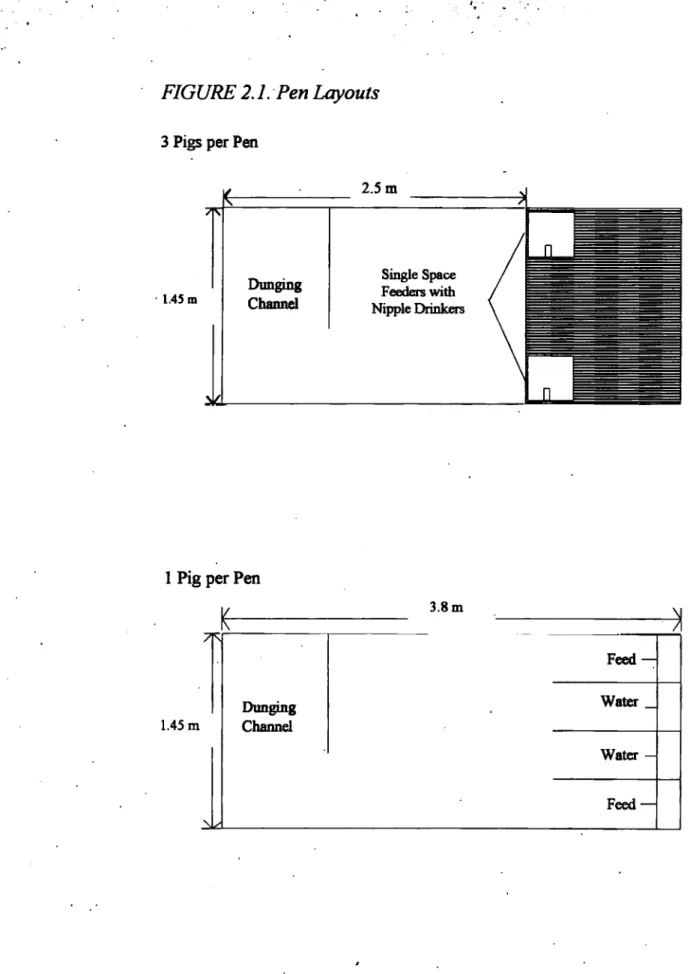
All the pens were in the same house. Where there were three pigs in a pen, each pen was equipped with two single space feeders with nipple drinkers allowing ad libitum access to feed and water. The singly penned
pigs were provided with troughs for feed and water, and ad libitum access
to both feed and water was available (Figure 2.1).
Dietary treatments were allocated randomly to pens in each block and the feeds were allocated at random to one of the two feeders in each pen. All pigs were weighed at the start of the experiment, after the initial training period and then fortnightly. Feed consumed was recorded at the same times and, additionally, half-way through the initial training period. Weight and feed intake means for each pen were calculated.
An eight-day training period, in which the pigs were allowed access to only one of the two feeds on alternate days, was used at the beginning of
TABLE 2.1. Composition (g/kg) and analysis o f the basal feeds.
Feed
Dietary protein content (g/kg feed)
Low Protein 98 High Protein 225 Ingredient Ground maize 929.1 664.0 Wheat bran 25.0 Fish meal 32.1 121.6
Soya bean meal 164.4
Lysine 1.2 2.4 Methionine 2.6 Salt 2.5 Limestone powder 3.8 Dicalcium phosphate 11.3 Vits/mins supplement 20.0 20.0
Analysis (calculated unless otherwise stated)
Protein (determined - gN x 6.25/kg) 98.0 225.1
DE (MJ/kg) 14.3 14.6
Digestible Lysine (g/kg digestible protein) 50.4 71.5
Digestible Methionine (g/kg digestible protein) 25.1 32.4
Digestible Threonine (g/kg digestible protein) 34.4 38.0
' V - - '
FIGURE 2.1. Pen Layouts
3 Pigs per Pen
2.5 m 1.45 m Dunging Channel Single Space Feeders with Nipple Drinkers
1 Pig per Pen
7R 1.45 m Dunging Channel 3.8 m Feed — Water Water — Feed —
the experiment. The training period inqiroves the ability of pigs to select a balanced diet (Kyriazakis, Emmans and Whittemore, 1988) and has been used successfully in experiments by Kyriazakis et al (1991) and
Bradford and Gous (1991). The experiment lasted four weeks after the initial training period had elapsed.
1 Statistical analysis of the data was performed by analysis of variance using the GENSTAT statistical package (Lawes Agricultural Trust, 1984). A randomised block split-plot design was used in which the number of pigs per pen were the main plots and the dietary treatments were the split plots. Orthogonal comparisons allow the sub-division of the treatment sum of squares to make comparisons between sub-sets of the data (Mead and Cumow, 1983).The two orthogonal comparisons that were performed were between the high plus low treatment versus the high plus medium low treatment, and the mean of the high plus low and high plus medium low treatments versus the medium high plus low treatment.
2.1.3. Results
(i) Selection of Dietary Protein Concentration
Feed intake did not differ between the three dietary choice treatments (P > 0.05). In the first half of the selection period both the high plus medium low (P < 0.001) and the medium high plus low (P < 0.05) protein treatments had growth rates more than 15% lower than the high plus low protein treatment. In the second half of selection the medium high plus low protein treatment had a growth rate more than 10% lower than the other two treatments (P < 0.05). Feed conversion efficiency (FCE) did not differ between the treatments except in the first half of selection where the high plus low protein treatment had an increased
FCE. There was an unexplained difference between the initial weights of the three dietary treatments (P < 0.05). A covariance analysis was used to adjust the parameters of productive performance for differences in initial body weight. However, this did not decrease the residual sum of squares of any of the parameters. Treatment means of initial weight, daily feed intakes, average daily weight gains and FCE are shown unadjusted (Table 2.2).
I
î
I
I
&t
§I
I
I
I
%
i
I
I
I
I
I
s lI
I
9 Î 8li
bO O M W1 ^ d c> o <s o o so m «n o d d m •-* o ^ IT) Tf d d d r~ m r- m «n p 00 p 1—1 r- •n m cs so m m O Os <s so 00 r~ d d d 00 ts OS Os 00 d d d i § s d o d fS r-•n os VO m m <N d d d o p cs so *n ^ soII
N,
t iI
i
Z Î "9 CO % Z Z Z Z Z Z z z § 1 1 z S S§11
c/5 O s ^ Z 00 « (OI
d d cO m m * S S y ^ foI
<—I m S 3 m »n d d I s m d ? o so CN *n COm m 00 m Z m m m 2 <s vs 00 so os 00 CO <N m fS m z m m d d d d d 00 cs r~ vs m m <N p vs vs Z vs vs vs vs <s o p o P o d O SO m mcs P P o d O vs os m CM P o P o d o m vs 00 so <s 00 vs r- f*S os 00 p o d 00 00 r*s MS 00 so r~ vs OS r~ r-. p o o d o o d r» vs so vs Ms COOS 0 0 MS MS os » z 0 0 0 0 0 0 p o d O d d d o d MS O s os s s P o o o O s so vs vs SO r» ? vs P o d o os 00 o cs os vs O) MS o dI P I
I
Hi
2 a sII
4 2Total daily protein consunçtion was lower for the medium high plus low protein treatment than for the other two treatments throughout the experiment. The high plus low protein treatment tended to have a higher daily protein consumption than the high plus medium low protein treatment (Table 2.3).
During the training period all three choice treatments ate a similar proportion of the higher protein feed offered, at a rate of about 60% of the total feed eaten (Table 2.4). During the selection period the high plus medium low protein treatment ate less of the higher protein feed than the other two treatments.
There was a difference between the concentrations of protein consumed in the different dietary choices; the diet selected by pigs on the medium high plus low protein choice had a lower protein concentration than the diets selected by the other two treatments (Table 2.5). The high plus low protein treatment consumed a lower protein concentration than the high plus medium low protein treatment in the training period, and a higher concentration of protein in the first half of the selection period.
TABLE 2.3. Effect o f dietary choice, number o f pigs per pen and food presentation on the amount o f protein consumed (kg/day).
Crude Protein Consumed (kg/day)
Training Dîys 1-14 D ^ s 14-28
Period of Selection of Selection
Choice:
High + Low 0.157 0.305 0.400
High + Medium Low 0.134 0.272 0.361
Medium High + Low 0.110 0.239 0.322
Ordiogonal Comparisons:
(H+L and H+ML) vs MH+L * *** *
H+L vs H+ML NS *** NS
Pigs per pen: * NS *
1 0.118 0.279 0.380 3 0.150 0.265 . 0.342 Food Form: NS ** ** Pellets 0.128 0.262 0.329 Meal 0.139 0.282 0.393 Grand Mean 0.134 0.272 0.361 SEM. Diet (10 df) 0.0104 0.0039 0.0152
Pigs per pen (2 df) 0.0232 0.0339 0.0229
Food form (10 df) 0.0085 0.0032 0.0124
NS P > 0.05, * P < 0.05, **P< 0.01, *** P < 0.001
TABLE 2.4. Effect o f dietary choice, number ofpigs per pen andfood presentation on the proportion o f higher protein food consumed.
Proportion of Higher Protein Food Consumed
Training Days 1-14 Days 14-28
Period of Selection of Selection
Choice:
H i^ + Low 0.615 0.993 0.992
High + Medium Low 0.546 0.739 0.834
Medium High + Low 0.650 0.965 0.982
Orthogonal Comparisons:
(H+L and H+ML) vs WI+L . NS NS NS
H+L vs H+ML NS * NS
Pigs per pen: *** NS NS
1 0.549 0.956 0.936 3 0.613 0.842 0.845 Food Form: NS NS NS Pellets 0.592 0.885 0.881 Meal 0.614 0.914 0.900 Grand Mean 0.603 0.899 0.891 SEM: Diet (10 df) 0.0166 0.0093 0.0823
Pigs per pen (2 df) 0.0392 0.0158 0.1542
Food form (10 df) 0.0135 0.0076 0.6720
TABLE 2.5. Effect o f dietary choice, number ofpigs per pen and food presentation on the protein concentration consumed (g/kg o f feed).
Protein Concentration Consumed (g/kg feed)
Training 1-14
Days
14-28Period of Selection of Selection
Choice:
H i^ + Low 176.1 224.1 207.9
High + Medium Low 186.4 202.8 213.7
Medium High + Low 150.0 175.2 173.2
Orthogonal Comparisons:
(H+L and H+ML) vs MH+L *** *** **
H+L vs H+ML * * NS
Pigs per pen: ** NS NS
1 170.2 205.6 203.8 3 171.4 195.8 192.7 Food Form: NS NS NS Pellets 169.7 199.4 196.5 Meal 171.9 202.0 200.0 Grand Mean 170.8 200.7 198.2 SEM: Diet (10 df) 2.51 5.44 7.96
Pigs per pen (2 df) 0.49 15.89 21.15
Food form (10 df) 2.05 4.45 6.50
N S P >0.05, * P < 0.05, * * P < 0.01, *** P <0.001
(Figure 2.2) showed that most pigs were only eating one of the two feeds offered. This was especially true where the choice included the low protein feed, although even on the high plus medium low protein treatment six of the eight pigs ate mostly (> 85%) the high protein feed.
(ii) Social Effects
Initial weight was similar for both single and grouped pigs, as were weight gains for the first three weeks of the experiment (Table 2.2). However, during the last two weeks of the experiment the single pigs had higher weight gains (P < 0.01). Feed intakes were similar for both singly and group housed pigs, except during the training period when the single pigs ate less (P < 0.05). The single pigs also ate a smaller proportion of the higher protein feed during the training period (P < 0.001) and, consequently, had a lower total protein intake (Table 2.3, P < 0.05) and a lower protein concentration (Table 2.5, P < 0.01). In the second half of the selection period the single pigs had a higher total protein intake than the group housed pigs (P < 0.05).
XxxXXX ’S) s
1
+ 21
+ 'S) 2 o o o o (S o 00 o o o o CN o o o 00I
I
§
1
i
u •S CL,I
uI
ë %I
I
01
ë
}
I
§
I
Î
48(Hi) Feed Presentation
There were no differences in weight gains between the two feed presentations offered. Feed intake tended to be lower and FCE tended to be higher for pelleted feed than for meal, although this was only significant in the second half of the selection period (Table 2.2, P < 0.05). Total protein intake was higher for the pigs fed on meal than the pellet fed pigs during die selection period (Table 2.3, P < 0.01). The form of feed presentation had no effect on the proportion of the higher protein feed consumed or the concentration of protein consumed (P > 0.05).
2.1.4. Discussion
(i) Selection of Dietary Protein Concentration
Growing pigs appeared to be able to select feeds on the basis of their digestible protein concentration. However, in contrast to other studies (Kyriazakis et al, 1990, Bradford and Gous, 1991) few pigs selected a
blend of feeds whieh provided an digestible protein concentration appropriate to their requirements, tending instead to eat mainly the higher protein feed.
The pigs on the choice between medium high protein and low protein grew more slowly than the pigs on the other two treatments. These pigs consumed less protein and a lower protein concentration than the other pigs, because the protein content of the medium high feed was only 178 g kg^ of feed, which suggests that the medium high protein feed was below the protein requirements of these pigs. However, the pigs on the choice between the high and the low protein feeds all ate virtually all their diet from the high protein feed. This may suggest that 225 g protein kg^ feed is also below growing pigs requirements. However, it is possible that the pigs selected the one feed nearest to their requirements, rather than
selecting a mixture of feeds. Some of the pigs on the high plus medium low protein treatment did eat a mixture of the two feeds, but the majority of pigs ate mainly the high protein feed.
Bradford and Gous (1991) in a similar experiment used growing pigs between 30 and 85 kg, and in the first week of the experiment, when they were a similar size to the pigs used in this experiment, they selected 190-200 g protein kg'^ of feed, on the choices including the high protein feed. Those pigs on the medium high plus low protein diet consumed about 160 g protein kg^ feed. However, the pigs were penned in groups of ten, so it is impossible to know what individual pigs selected. The pigs used in that experiment were relatively unimproved and this may explain the slightly lower protein concentrations selected. Conq>arative diet selection experiments have shown that Chinese pigs which have not been genetically improved select a lower protein diet than improved pigs, reflecting their lower potential for lean tissue growth (Kyriazakis and Leus, 1992). In another experiment, 12-30 kg pigs on four different dietary choices all selected between 202 and 208 g protein kg'^ feed (Kyriazakis et at, 1990).