Affect Lexicon Induction For the
Github Subculture Using Distributed
Word Representations
byYuwei Jiao
A thesis
presented to the University of Waterloo in fulfillment of the
thesis requirement for the degree of Master of Mathematics
in
Computer Science
Waterloo, Ontario, Canada, 2018
c
I hereby declare that I am the sole author of this thesis. This is a true copy of the thesis, including any required final revisions, as accepted by my examiners.
Abstract
Sentiments and emotions play essential roles in small group interactions, especially in self-organized collaborative groups. Many people view sentiments as universal con-structs; however, cultural differences exist in some aspects of sentiments. Understanding the features of sentiment space in small group cultures provides essential insights into the dynamics of self-organized collaborations. However, due to the limit of carefully human annotated data, it is hard to describe sentimental divergences across cultures.
In this thesis, we present a new approach to inspect cultural differences on the level of sentiments and compare subculture with the general social environment. We use Github, a collaborative software development network, as an example of self-organized subculture. First, we train word embeddings on large corpora and do embedding alignment using linear transformation method. Then we model finer-grained human sentiment in the Evaluation-Potency-Activity (EPA) space and extend subculture EPA lexicon with two-dense-layered neural networks. Finally, we apply Long Short-Term Memory (LSTM) network to analyze the identities’ sentiments triggered by event-based sentences. We evaluate the predicted EPA lexicon for Github community using a recently collected dataset, and the result proves our approach could capture subtle changes in affective dimensions. Moreover, our induced sentiment lexicon shows individuals from two environments have different understandings to sentiment-related words and phrases but agree on nouns and adjectives. The sentiment features of “Github culture” could explain that people in self-organized groups tend to reduce personal sentiment to improve group collaboration.
Acknowledgements
This thesis cannot be completed without the help from many people. I would like to take this opportunity to thank them all.
First and foremost, I would like to thank my supervisor, Professor Jesse Hoey. It was a great honour to work with him throughout my studies. Thanks to Professor Mei Nagappan and Professor Yaoliang Yu for being on my committee. Thanks to all my friends and labmates for their support. Last but not least, I would also thank my boyfriend Jun Zhao and my parents for supporting all the time.
Dedication
Table of Contents
List of Tables x
List of Figures xii
1 Introduction 1
1.1 Motivation . . . 1
1.2 Contributions and Outline . . . 3
2 Related Work 5 2.1 Sentiment Analysis . . . 5
2.1.1 Evaluation-Potency-Activity Model . . . 5
2.1.2 Hyperspace Alignmemt . . . 6
2.1.3 Sentiment Lexicon Induction . . . 6
2.1.4 Affective State Prediction . . . 7
2.1.5 Sentiment Analysis on Github Data . . . 8
2.2 Natural Language Processing . . . 9
2.2.1 Bag of Words . . . 9
2.2.2 Distributed Word Representation . . . 9
3 Alignment Word Space 11
3.1 Introduction . . . 11
3.2 Background . . . 12
3.3 Method . . . 15
3.3.1 Linear Transformation . . . 15
3.3.2 Stochastic Gradient Descent . . . 16
3.3.3 Singular Value Decomposition . . . 16
3.4 Evaluation . . . 17
3.4.1 Github Dataset . . . 17
3.4.2 Pre-trained Word Embeddings . . . 18
3.4.3 Anchor Words Selection Strategy . . . 19
3.4.4 Metrics . . . 19
3.5 Results and Discussion . . . 20
3.5.1 Part One . . . 20 3.5.2 Part Two . . . 24 3.5.3 Part Three. . . 26 3.6 Conclusion . . . 28 4 EPA Expansion 29 4.1 Introduction . . . 29 4.2 Background . . . 30 4.3 Methods . . . 32 4.3.1 Motivation . . . 32
4.3.2 Graph-based Label Propagation . . . 32
4.3.3 Support Vector Regression . . . 35
4.3.4 Artificial Neural Networks . . . 37
4.4 Evaluation . . . 37
4.4.1.1 Pre-Trained Word Embeddings . . . 38
4.4.1.2 Warriner EPA dataset . . . 38
4.4.1.3 Themis EPA dataset . . . 39
4.4.2 Methods for Sampling Seed Words . . . 40
4.4.3 Neural Network Structure . . . 41
4.4.4 Evaluation Metrics . . . 41
4.4.5 Methods for Github EPA Expansion . . . 42
4.5 Results and Discussion . . . 43
4.5.1 Training Mapping Models to Predict EPA . . . 43
4.5.1.1 Graph . . . 43
4.5.1.2 SVR . . . 46
4.5.1.3 Neural Network . . . 46
4.5.1.4 Comparing Seed Words Threshold and Size . . . 47
4.5.1.5 Training Hidden Models within Github Subculture . . . . 49
4.5.1.6 Examples of Predicted EPA lexicon . . . 51
4.5.2 Exploration on Expanded EPA lexicon . . . 51
4.6 Conclusion . . . 57 5 State Prediction 59 5.1 Introduction . . . 59 5.2 Background . . . 60 5.2.1 Related Work . . . 60 5.2.2 LSTM . . . 61 5.3 Evaluation . . . 62
5.4 Results and Discussion . . . 63
5.4.1 SVO EPA Prediction . . . 63
5.4.2 Sentiment Prediction on Github Comments . . . 64
6 Conclusion 68
6.1 Future Work . . . 69
References 71
List of Tables
3.1 Model evaluation and comparison on five corpora. Pearson and Spearman correlation with p-values are the results in word similarity task. Question coverage and accuracy are the results in word association task. Parameter settings: fasttext sg model, vector dimension as 300, and mincount as 5.. . 24 3.2 Using NLTK Part-of-Speech tag, we divided the intersected vocabulary of
Google-wv and Github-wv-aligned into three catogories: noun, verb, and adjective/adverb. We calculate the average cosine distance and standard deviation (std) for each word in two spaces. . . 26 3.3 Examples of words and their synonyms in Google-wv and Github-wv-aligned.
Action words show significant semantic shift, while sentiment wordsdo not have much shift. But sentiment words show subtle potency differences across the two cultures. . . 27 4.1 The VAD Distribution in Warriner’s dataset. valence=evaluation,
domi-nance=potency, arousal=activity. . . 39 4.2 The EPA Distribution in Themis EPA dataset. The variance values of three
affective dimensions are half of the Warriner’s dataset. . . 40 4.3 Osgood proposed 43 words that are extremely expressive on three affective
dimensions [68]. E+/E- represent those words are very good/bad; P+/P-represent those words are very powerful/powerless; A+/A- P+/P-represent those words are very active/inactive. . . 41 4.4 Parameter reference table for three models used in this chapter, which are
graph-based label propagation, support vector regression (SVR), and neural network. In the following sections, we first do experiments on parameter tuning for each model, then study on the common parameters. Finally we give comparisons of the best model using three algorithms. . . 44
4.5 Two approaches of training mapping models. Figure 4.5a shows the mean error rate (MAE) of training on Github-wv word embeddings to predict 434 Themis-EPA ratings, and Figure 4.5b shows the mean error rate of our proposed approach, training on Google-wv word embeddings to 1,000 Warriner-EPA ratings. . . 50 4.6 Examples of the results of our mapping model f (NN). We take word
embeddings Google-wv as input to the model, and compare the predic-tions (General-EPA) with ground truths (Warriner-EPA). . . 52 4.7 Comparison of the performance of using three methods. There are two
sub-sets in the table, part is the intersected concept vocabulary of Warriner-EPA, General-Warriner-EPA, Github-Warriner-EPA, and all is the intersected concept vo-cabulary of General-EPA and Github-EPA. We calculate the prediction accuracy (ACC), mean absolute error (MAE), and root mean square er-ror (RMSE). ACC is calculated by counting the number of predictions that are within the range of (mean - std, mean + std) in Themis-EPA. The highest score are underlined in the table. . . 53 4.8 Examples of predicted Github concepts’ EPA in detail. . . 54 4.9 Detailed comparison of EPA lexicon between general culture and Github
community. . . 56 5.1 Affective prediction of 1,535 event-based sentences. MAE=mean absolute
error. RMSE=root mean squared error. LSTM model can achieve better results compared with using ACT [1]. . . 64 5.2 LSTM model’s results on predicting basic sentiments. ETS and ETO are
sentiments towards subject and object respectively. SVO elements extracted by parser are denoted as: subject, behavior, and object. . . 65 5.3 Apply LSTM model to predict Github comments sentiments. The SVO
parser could extract from 976 Github comments successfully. We use the LSTM model to predict sentiments triggered by those sentences. . . 66
List of Figures
1.1 The architecture of our proposed approach. There are three components of the architecture. First is word vector hyperspace alignment (Chapter 3). Next is word vector to affective dimensions mapping models (Chapter 4.1). The final component is the applications our predictions and models (Chap-ter 5), where the green parts show how to predict words’ affective meanings in subcultures and apply them to classify sentiments triggered by sentences. 3 3.1 Simple 2D visualization of distributed word vector representations of
num-bers and animals in English (left) and Spanish (right) [61]. . . 13 3.2 The Github word embeddings evaluation results of word similarity test
(Word-sim353) in Fig 3.2a and Fig 3.2b, and word association test (Questions-words) in Fig 3.2c. There are four models: word2vec cbow, word2vec sg, fasttext cbow, and fasttext sg used in the experiments. Vector space di-mensions (size) ranges between 200 and 400, and token frequency thresh-old (mincount) ranges between 0 and 20. Figure 3.2d demonstrates the trade-offs between vocabulary size and quality. . . 21 3.3 The Twitter word embeddings evaluation results. They are similar to the
experiments described in Fig 3.2. . . 22 3.4 The WikiText word embeddings evaluation results. They are similar to the
experiments described in Fig 3.2. . . 23 3.5 The figures show the performance changes under different scales of training
dataset using SVD and SGD method. The blue line indicates the average distance between word pairs in training process, while orange line is the average distance on 1,000 testing word pairs. . . 25
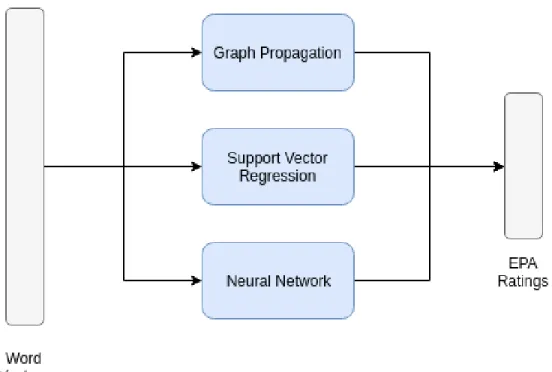
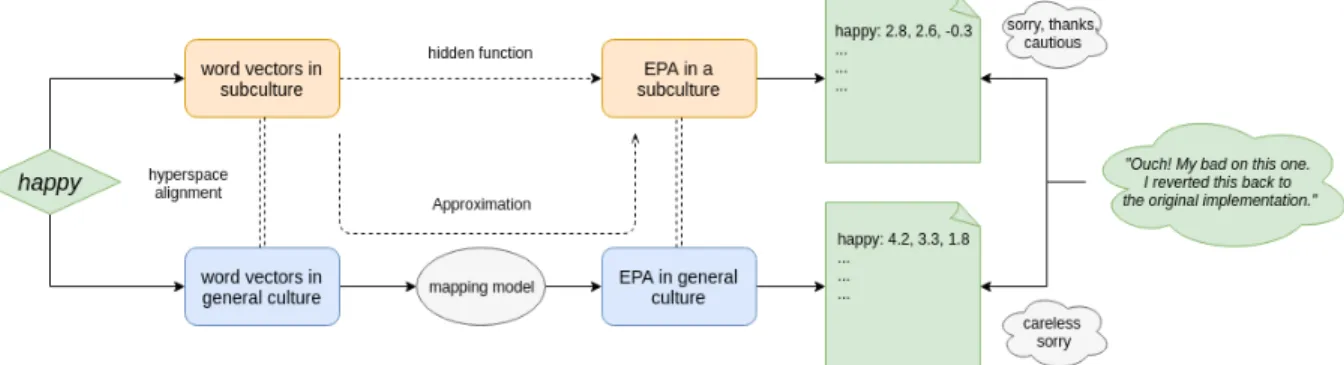
4.1 The workflow of EPA expansion on Github. In last chapter 3, we demon-strate learning the hyperspace alignment function g. In this chapter, we focus on training the mapping model f, which maps from word vector space to three-dimensional EPA space. . . 31 4.2 In this thesis, we propose using three methods to train the mapping models,
which are graph-based semi-supervised learning, support vector regression, and neural network.. . . 33 4.3 A illustration of why unlabeled data could be helpful [15]. The knowledge
of having more points in the banana shape allows to decide more accurate boundaries for classification. Otherwise, the decision boundary would be a simple straight line separating the two labeled nodes. . . 34 4.4 The Structure of SVR. yi =w·xi+b is the prediction for the sample. The
purple points are predictions within the error ranges, while yellow points are beyond the margin. . . 36 4.5 Green: evaluation/valence. Red: activity/arousal. Blue: potency/dominance.
The average values for evaluation/valence and potency/dominance are pos-itive, however, it is negative for activity/arousal. . . 39 4.6 The Structure of Neural Network in EPA Expansion. The input vector
has 300 dimensions. The first layer has 128 units followed with an “tanh” activation layer. The second layer has same structure with the first layer except there are 32 units. The last layer is a three-unit dense layer without activation function. . . 42 4.7 Graph Propagation Parameter Tuning. Figure 4.7a shows the MAE values
on three affective dimensions of the graph propagation models trained with various enn and sigma settings. Figure 4.7b shows how propagation iter-ations affect the model performance (MAE). Figure 4.7c demonstrates the relation between clamping factor and MAE value. . . 45 4.8 SVR Epsilon Tuning. We experiment on training SVR models with the
epsilon ranging from 0 to 0.5. The figure shows how epsilon affect the perforamance (MAE) of three affective dimensions. . . 46 4.9 Neural Network Epoch and Batch Size. We experiment on training neural
network models with different batch size and epoch settings. The figure shows the mean absolute errors (MAE) on evaluation-potency-activity di-mensions. . . 47
4.10 Parameter tunings for training dataset selection (parameter epa and seed). We experiment on three machine learning models described above: graph propagation (graph), SVR (svr), and neural network (nn). And we further test if applying uniformization algorithm described in Section 4.4.1.2 can im-prove the performance or not (denoted as True in the legend). Figure 4.10a and Figure 4.10b show the mean absolute error (MAE) on three affective dimensions of the three models with and without uniformization. . . 48 4.11 A comparison of the supervised learning models performance (SVR and NN).
Because of the limit of labeled data (vocab(Github-wv) ∩ vocab(Themis-EPA) = 434 labeled concepts), we apply 5-fold cross validation. . . 49 4.12 Comparison of EPA distribution between general culture Themis-EPA and
Github community Github-EPA. The evaluation, potency, and activity rat-ings in Github subculure are more concentrated with smaller standard de-viations, comparing with the general culture. . . 55 5.1 The structure of LSTM used to predict EPA states of SVO model. The
architecture consistes three layers: the input SVO word embeddings layer, the LSTM layer, and the output affective state layer. There are two hidden dense layers connected between the outputs from LSTM layer and the final output. . . 62
Chapter 1
Introduction
1.1
Motivation
Sentiment is closely associated with human daily life and activities. It could be the con-sequence of single or multiple events, and also continuously affects human cognition and behaviors. It is commonly agreed that sentiments are complex states of feelings involving several components, including social environments, subject experiences and psychological changes. Understanding the underlying sentimental states of individuals or groups would be beneficial to many research areas as well as to industrial products. For example, in-telligent home assistants could gather the user’s sentiment and provide more customized service; leaders and managers in companies or organizations could do group collabora-tion evaluacollabora-tion with the help of individuals’ sentiment analysis; sociologists and politicians could measure public reactions to newly published regulations.
In the THEMIS.COG project, we aim at modeling collaboration dynamics in distributed communities and providing insights into the social and psychological mechanisms of self-organized collaborative groups like Github. There are pieces of evidence that sentiments play an essential role in group collaboration [22,4], as positive sentiments encourage people to contribute and innovate, while negative sentiments reduce the community’s creativity and vitality. Previous work has shown great success in modeling and analyzing sentiments and interactions on Github [75, 76]; however, it ignores the sentimental divergence across communities and cultures. Sentiment is generally recognized as a universal construct and scientists believe it as genetically determined so that basic facial expressions and spoken pitch patterns are interpreted and perceived in the same way across regions and cultures. For example, smiling face represents friendliness while yelling at people shows anger.
How-ever, there exist subtle cultural differences in sentiment because the environment and social experiences also shape the way people feel and express [59].
So what is culture? Culture is made up of the shared patterns of behaviors and inter-actions, cognitive constructs and understandings that are learned through socialization. A subculture is a group of people within a larger culture who develop norms and maintain values that are different from the general culture. Github as a self-organized collabora-tive software development network could be recognized as a subculture for several reasons. First, people in this community are mainly programmers and know about coding. Second, they share the same goals of software and tool iteration and development. Third, there are specific rules to communicate using pull requests comments and commit messages. Usually, it is difficult to describe the sentimental features of a given subculture like Github because it requires quantities of human annotated data on images, texts or audio. However, such high-quality data would be expensive as well as hard to collect, since people are influenced by more than one subculture, and it’s almost impossible to ensure the annotation mainly represents the subculture we want. Moreover, it is complicated to describe the sentimental states of individuals in a subculture, so it would be even more challenging to extract the general features of a group of people and compare horizontally across subcultures.
Word embedding [62, 60, 52] is a common used method in most recent natural lan-guage processing projects. Much work has been done in the field of semantic shifts and syntax changes across time and cultures. Austin Kozlowski et al. [49] and Nikhil Garg et al. [24] explore the linear relationship of word embeddings and demonstrate applications to analyze gender and class association in history. William Hamilton et al. [31,32] propose a method for quantifying semantic change by evaluating word embeddings and prove the rate of semantic change is proportional to word frequency and polysemy. Aparna Garimella et al. [25] identify a set of words with significant usage difference between American and Australian personal writings and investigate language attributes and underlying psychol-ogy mechanisms across cultures. To best describe and compare group sentiments, we use the continuous three-dimensional Evaluation-Potency-Activity (EPA) space. Introduced by Osgood [69, 70], it is a vector space that describes the direction and magnitude of an affective meaning in three dimensions: Evaluation (pleasant/unpleasant), Potency (pow-erful/powerless) and Activity (active/inactive). There are several cross-culture empirical studies of EPA ratings. Each affect meaning is measured on a scale from -4.3 (infinitely neg-ative) to +4.3 (infinitely positive). Studies have shown that most of the affective meanings are shared across culture and would not change significantly over time. However, specific social events could make a difference to a set of related affective meanings [40].
This thesis is mainly based on two hypotheses: first, that the cultural differences in language usage could be reflected in distributed word representations; second, that the
affective meanings of sentiments vary from one subculture to another. In this thesis, we demonstrate a new method to induct and expand sentiment lexicons across subcultures. Moreover, we propose a framework to describe the sentimental features of subcultures and explore sentimental divergence across cultures.
Figure 1.1: The architecture of our proposed approach. There are three components of the architecture. First is word vector hyperspace alignment (Chapter 3). Next is word vector to affective dimensions mapping models (Chapter4.1). The final component is the applications our predictions and models (Chapter 5), where the green parts show how to predict words’ affective meanings in subcultures and apply them to classify sentiments triggered by sentences.
1.2
Contributions and Outline
Figure 1.1 shows the architecture of our proposed approach in this thesis. The main contributions of this thesis are:
• Align two distributed word vector spaces using a statistical inference (singular-value decomposition) method and linear transformation with stochastic gradient descent modeling. The average cosine distance reduces from 1.0 to 0.6 by using the proposed alignment approach.
• Use distributed word representations to predict a sentiment lexicon using graph-based semi-supervised learning, support vector regression and artificial neural networks. The mean absolute errors of 13,790 concepts are 0.63, 0.70, 0.75 on three affective dimensions respectively, scaling from -4.3 to 4.3.
• Generate the sentiment dictionary of 39,366 concepts from general culture to a given subculture (Github community culture in this thesis). Evaluating on 371 concepts, the mean absolute errors are 0.57, 0.66, 0.58 on three affective dimensions in the same scales as above.
• Integrate the augmented sentiment lexicon with a sentence sentiment recognizer using Long Short-Term Memory (LSTM) model. The model achieves a 95% accuracy of predicting sentiments triggered by news headlines, but only 48% when performing on Github comments data.
• Demonstrate the sentiment divergence between the universal general culture and a self-organized collaboration community (Github). There are significant affective shifts of words related to sentiments and emotions.
The structure of this thesis is as follows. Chapter 2 provides background information and related work in recent years regarding natural language processing, sentiment anal-ysis as well as culture difference in sentiment. Chapter 3 introduces a set of commonly used methods to align distributed high-dimensional word embeddings, including singular value decomposition (SVD) and linear transformation modeling with stochastic gradient descent. We evaluate the performance of these methods on several separately trained word vector models under different anchor words selection strategies. Within the aligned word vector space, we propose doing sentiment lexicon expansion for a subculture and discuss the sentimental meaning divergence on the level of words across subcultures in Chapter4. More details about datasets, sampling methods, model selection, and evaluation metrics are provided in this chapter too. In Chapter5, we apply the aligned distributed word rep-resentations and augmented sentiment lexicon to predict sentiments evoked from sentences using a LSTM network. Sentiment analysis results support the hypothesis that Github is a collectivist culture instead of individualist. Conclusion and future work are in Chapter6.
Chapter 2
Related Work
2.1
Sentiment Analysis
2.1.1
Evaluation-Potency-Activity Model
There have been several theories trying to describe sentiments. A sociology theory called Affect Control Theory (ACT) uses a three-dimensional vector to describe sentiments. The basis vectors of the sentimental space in this theory are called Evaluation (pleas-ant/unpleasant), Potency (powerful/powerless) and Activity (exciting/calm). Affect Con-trol theory proposes that individuals process words and events as symbols or concepts which are shared among groups of people. ACT represents social behaviors with an Actor-Behavior-Object model. It uses a three-dimensional EPA profile as the fundamental senti-ments and proposes that it is important for individuals to maintain the transient impres-sions. Fundamental sentiments are representations of social objects, such as interactants identities, behaviors and environmental settings in EPA space. Transient impressions are the result of social events corresponding to fundamental sentiments. Sentiments arise be-cause of the differences between fundamental sentiments and transient impressions. The equations have been obtained through empirical studies.
Usually, EPA profiles are measured through surveys where annotators rate identities and behaviors on a numerical scale from -4.3 (infinitely bad, powerful or inactive) to 4.3 (infinitely good, powerful or lively). People from a similar cultural background would reach an agreement about the EPA values, and the affect ratings are relatively stable over time. For example, a baby is seen as (1.63, -1.64, 0.3) which is described as good, quite
weak and not very active. While the EPA value of a mother is (2.48, 1.96, 1.15) which means kind/good, much more powerful and active compared to a baby [39].
2.1.2
Hyperspace Alignmemt
High-dimensional distributed representations of words and phrases enable people to reason about new facts from texts, conversations, and knowledge graphs. The similarity of two entities could be defined by their cosine distances in this space. Usually, word vectors are trained online, where a text corpus is fed into the training network all at once. On-line training ensures vectors across language, regions, time series and knowledge graphs are within the shared space. Mikolov et al. [61] show that word vectors can also be ob-tained offline. It enhances the feasibility and scalability to obtain sets of word vectors independently. Tomas Mikolov et al. first proposed the approach of using similarity of distributed word representations [61] as complementary to the existing statistical machine translation systems [47, 46, 30], which shows the geometric arrangement similarity of sim-ilar words (numbers and animals) in high dimensional vector space between English and Spanish. Taking the advantage of a linear transformation (rotation and scaling), they can infer missing dictionary entries of words and phrases through projections even between lan-guages that are substantially different, for example, English and Chinese. Moreover, this method could also give a similarity score for each word pair. The linear projection method archives great success despite the simplicity. Following Mikolov’s work [61], Samuel Smith et al. [82] prove further that the optimized linear transformation between two vector spaces is orthogonal. Therefore the alignment could be achieved using singular value decomposi-tion (SVD) instead of using SGD. The SVD method is more robust to noise compared to SGD, and they improve the precision from 34% in previous work to 43% by introducing inverted softmax to identify translation pairs.
2.1.3
Sentiment Lexicon Induction
One of the most popular methods of sentiment analysis tasks is to use sentiment lexicons that associate words with their polarity, either positive or negative. Such lexicons are composed of a relatively small set of words with semantic orientation (valence), or in multi-dimensional space of evaluation (valence), potency (dominance), and activity(arousal). Osgood first carried out a large set of cross-cultural studies and introduced the first affective meaning dictionary [68, 70, 69]. Based on this work, Heise further measured the affective ratings in several countries [37, 38,39].
There are two primary methods used for polarity acquistion: corpus-based methods and thesaurus-based method. The corpus-based methods utilize a small set of labeled words and induce the sentiment lexicon based on co-occurrence statistics from the corpus. Some general co-occurence features include term frequency-inverse document frequency (TF-IDF), SVD [88], syntactic information [34], etc. People also use statistics gathered online to create lexicon for specific domain. Astudillo et al. [5] proposed a regression model to create a Twitter sentiment lexicon using skip-gram word embeddings. Rothe et al. [77] transformed word embeddings to lower dimensional representations by training a gradient descent algorithm with two objective functions. Fast et al. [20] combined skip-gram word embeddings with crowd-sourcing annotations to map words into 200 predefined categories. The thesaurus-based methods rely on lexical relationships in WordNet and other human-annotated resources, for example, WordNet [63], General Inquirer [84], etc. Kamps et al. [45] built a lexical network of snonyms and antonyms and computed the sentiment orientation by measuring the relative distances between words and seeds (e.g., bad and good). Rao et al. [74] presented extensive evaluations of label propagation methods using dictionay, copurs, and graph to induce words polarity. Joseph et al. [43] futher compared the relationships of senmantic similarity and the identities of annotators (e.g., student, mother). A number of studies use graph-based learning methods to induce sentiment polarity. The general idea is to use a few already labeled data to label a set of unlabeled data within a graph, which encodes the relationships between words. Velikovich et al. proposed to build co-occurance frequency graph and induce polarity lexicons [89]. A few researchers explore to expand multi-dimensional sentiment lexicons. Kamps et al. [45] extended a three-dimensional sentiment lexicon based upon WordNet similarities, focused mainly on adjectives.
2.1.4
Affective State Prediction
Sentiments have been studied extensively in many fields like computer science, psychology, and sociology in recent years. Although there is psychological evidence showing sentiments are perceived in more than one dimension, most proposed theories adopt discrete appraisal theory by representing sentiments with discrete labels, such as positive, negative, neutral, or happy, sad. Some commonly used features in sentiment analysis include part-of-speech tagging, n-grams, term weighting, sentiment lexicons, and syntactic dependencies [71]. Unsupervised learning approaches usually calculate the difference between the point-wise mutual information (PMI) and determine the semantic orientation of sentence or docu-ment. Advanced approaches build more structured models by taking semantic taxonomy, the interaction of words or bag-of-words techniques into consideration. A framework is
proposed by Coecke et al. which constructs a sentence vector as a function of its word vectors [14]. There are several recent studies tackled to predict readers’ sentiments instead of from the writers’ perspective.
Alm et al. [3] annotated and analyzed sentiments in a corpus of children’s stories. They utilized Ekman’s basic sentiments [18] and concluded that the sentiments in fairy tales often start with neutral sentiments and end with happy one. Lin et al. [56] proposed their method of using bigrams features, affix similarities, and text metadata to classify Chinews news articles. Bhowmick et al. [8] presented a multi-label classification method to classify news articles into multiple sentiment classes (e.g., disgust, happiness, and sadness) with an accuracy of 77%. Kozareva et al. [48] presented an unsupervised learning method that computes PMI scores by querying search engines. Ahothali and Hoey explore predicting sentiments for each news headline using an augmented EPA lexicon and ACT equations [1]. They decompose sentence into subject-verb-object and associate subject with the actor, verb with the behavior and object with the object in ACT. MingLei Li et al. further propose to use LSTM learning method using word embeddings to predict the affective states of a described event [54]. They claim the method outperform the linear model in the ACT and most importantly, there is no need to construct affect lexicons manually.
2.1.5
Sentiment Analysis on Github Data
Github1 is a collaborative code hosting site built on top of the git version control system. It integrates social features which allow developers to communicate and collaborate. The main feature of Github is the fork and pull model, which enables users to create a copy of the repository and submit the pull requests to the project master branch. Human activities evoke sentiments and have positive or negative effects on group collaborations. It is a challenging task to determine sentiments in open source projects.
There has been some work done in this direction. Guillory et al. show the possibility of sentiment analysis on mailing lists and discussion boards [28]. Murgia et al. also perform a feasibility study of sentiment mining using issue reports of Apache software foundation [66]. Their work is based on Parrott’s sentiment framework [72] that classifies six basic sentiments into love, sadness, anger, joy, surprise, and fear. Guzman et al. analyze 60,425 Github commit comments [29] with the help of a lexical sentiment extraction tool called SentiStrength, which can rate comments within the range of [-5, 5]. However, the tool only analyzes the polarity (positive, negative or neutral) without a finer granularity of sentiments. Pletea et al. explore sentiment analysis on software security discussions
on Github [73]. They mainly use the NLTK library to predict the probability of being positive, neutral or negative.
However, Lin et al. exploit commonly used tools to identify the sentiment of software engineering related texts in their studies [55], and their results show none of the sentiment analysis tools are ready for real usage in software engineering related discussions yet. In their studies, they focus on three software engineering datasets, categorize sentiments as positive, neutral and negative, and experiment with six state-of-art sentiment analysis tools. The three software engineering datasets are from Stack Overflow, issue tracker comments, and mobile application reviews. The analysis of results reveals that all the experimented tools fail to discriminate between positive/negative sentences with neutral ones. Therefore, the tools are not reliable at all. As a conclusion, they suggest we should be more careful when doing sentiment analysis and opinion mining in software engineering in practice.
2.2
Natural Language Processing
2.2.1
Bag of Words
The bag-of-words model is a simplifying term used in natural language processing area [90]. In this model, a sentence or a document is represented as a multiset of its words. A common problem with text is that the text is messy, and machine learning algorithms prefer well-defined input and output format. A bag-of-words model extracts features from text for use, and discards any information about the order and structure of the document. The basic intuition is that, documents are similar if they share same content. Despite the simlicity, the bag-of-words model suffers from some shortcomings. For example, it requires careful-designed vocabulary and word representations are usually sparse vectors in large dimensional space.
2.2.2
Distributed Word Representation
Distributed word representations represent words in dense, continuous, high-dimensional space. These vector space models, know as word embeddings, have embedded much in-formation of interest and attracted much attention among computer scientists and com-putational linguists in recent years. One of the major features of word embeddings is the
ability to capture complex semantic relations between words. In word embedding models, words sharing similar contexts would be positioned nearby in the vector space.
Theword2vec is the most widely used word embedding algorithm nowadays, which uses a shallow, two-layered neural network architecture to optimize the prediction of context words. There are two distinct network architectures under word2vec: continuous bag-of-words (CBOW) and skip-gram (SG). Under the skip-gram architecture, the model predicts context words given a center word in a sliding window of k words. While the CBOW architecture works similarly, except that predicts the center word given k context words. Several other approaches take the statistical analysis into account to generate a word vector position, for example, n-grams. The word2vec model ignores all words with total frequency lower than min count, so the sliding window is the k context words among the surviving words.
Past work with word embeddings also show semantic relations between word pairs. For example, the analogy “man is to woman as king is to queen” can be solved by computations on word embeddings trained with sufficient text. Computer scientists believe that word embeddings are promising tools for cultural analysis [32,31]. It reveals the fundamentally relational nature of their meanings. We also believe that word embeddings could shed light upon sentiment analysis and explore this direction in this thesis.
2.2.3
Word Similarities
In general, there are two types of word similarities used in natural language processing tasks, which are attributional and relational similarity. The attibutional similarity mea-sures the degree of correspondence between attributes of words, while the relational sim-ilarity measures the correspondence between internal relationships. The term “semantic similarity” used in this thesis mainly refers to the attributional similarity by calculating the Eucliden or cosine distances between word embedding vector pairs.
Chapter 3
Alignment Word Space
3.1
Introduction
Distributed representations of words and phrases in high dimensional space enable people to reason about new facts from texts, conversations, and knowledge graphs, where the sim-ilarity of two entities could be defined by their cosine distances in this space. For example, bilingual machine translators utilize word embeddings to describe semantic associations between word pairs across language. Targeting knowledge graph completion usually de-signs a set of vector operations for reasoning and assertion. Linguistic change detectors can construct time series of distributional vectors for each word and track its linguistic displacement over time.
Usually, word vectors are trained online, where a text corpus is fed into the training network all at once. Online training ensures vectors across language, regions, time series and knowledge graphs are within the shared space. Mikolov et al. [61] show that word vectors can also be obtained offline. It enhances the feasibility and scalability to obtain sets of word vectors independently. However, because independently obtained word embeddings vary in spatial orientation in this case, an additional step of vector space alignment is needed to ensure vectors across language, time serious, knowledge graphs, or region are within in the shared space.
Usually, two simplifying assumptions are made to aid the alignment process: first, the spaces are assumed to be equivalent under linear transformation [51]; second, the meaning of most words is assumed to be stable across different contexts. Vivek Kulkarni et al. [51] align the embeddings in one unified coordinate system by learning a linear transformation
matrixWt07→t(w)that maps a word for each time snapshot. The matrix minimizes average
distance between each anchor word andk nearest words in the embedding space. However, the objective function relies heavily on synonyms, and the researchers fail to provide more information on the transformation evaluation. The method is not feasible for alignment tasks in semantic analysis. Tomas Mikolov et al. [61] share the same idea, but instead of using the k nearest words in space, they utilize the publicly available WMT11 datasets and claim to achieve over 90% precision in an English-Spanish translation task. Samuel Smith et al. [82] further prove the linear transformation between two spaces is orthogonal and could be obtained using the singular value decomposition (SVD). They extend the method to bilingual translation from English sentences to Italian with a precision of 68%. Zhen Wang et al. and Huaping Zhong et al. [92, 95] propose a new alignment model based on text descriptions of entities. The model consists three components: a knowledge model embedding entities and relations describing the plausibility of a triplet; a text model embedding the statistical attributes of pairs of words, for example, the probability of co-occurrence; and an alignment model. The aligned word vector model achieves more than 80% hit rates on semantic and syntactic reasoning tasks.
In this thesis, we explore using the linear transformation method and singular value decomposition (SVD) method to do the alignment of word vectors obtained from Github datasets to the pre-trained Google News word vectors. We denote the learned alignment model as alignment-model as a reference. We use two methods to construct the anchor word sets. One is to pick a set of words at random from the intersected word lists, the other is to construct anchor word datasets manually from stop words like what, the, an, some
under the assumption that stopwords shift little across context. We perform extensive experiments on semantic and syntactic reasoning task before and after the alignment. The average of word pairs distance is more than 1.0 before the alignment and reduces below 0.6 afterwards. Furthermore, we demonstrate the semantic shifts across subculture captured by our algorithm.
3.2
Background
Tomas Mikolov et al. first proposed the approach of using similarity of distributed word representations [61] as complementary to the existing statistical machine translation sys-tems [47, 46, 30]. This method makes only a few assumptions, so it is feasible to apply to any texts. Figure 3.1 illustrates the mechanism of the method. It shows the geometric arrangement similarity of similar words (numbers and animals) in high dimensional vector space between English and Spanish. Taking the advantage of a linear transformation
(ro-Figure 3.1: Simple 2D visualization of distributed word vector representations of numbers and animals in English (left) and Spanish (right) [61].
tation and scaling), they can infer missing dictionary entries of words and phrases through projections even between languages that are substantially different, for example, English and Chinese. Moreover, this method could also give a similarity score for each word pair. The linear projection method archives great success despite the simplicity.
Suppose there are a set of word pairs and their word vector representations obtained using word2vec models (either skip-gram or continuous bag-of-words model) as{xi, zi}ni=1, wherexi ∈Rd1 andzi ∈Rd2 is the distributed representation of wordiin target and source
language respectively. The objective of the linear projection is to learn a transformation matrix W such that W xi approximateszi in vector space. They formalize the problem as
an optimization task: min W n X i=1 kW xi−zik2
where stochastic gradient descent (SGD) is utilized to solve the equation.
Following Mikolov’s work [61], Samuel Smith et al. [82] prove further that the optimized linear transformation between two vector spaces is orthogonal. Therefore the alignment could be achieved using singular value decomposition (SVD) instead of using SGD. The SVD method is more robust to noise compared to SGD, and they improve the precision from 34% in previous work to 43% by introducing inverted softmax to identify translation
pairs. The inverted softmaxPj→i is the inverted calculation of finding target words, and it
provides a confidence estimation for the space alignment. Alexey Zobnin applies the SVD method to the Russian language and re-learns word embeddings to improve component stability [98].
The process of orthogonal transform action is performed by defining similarity matrix
S = Y W XT, where X, Y ∈
Rn×d are word vector matrices in source and target space respectively. The vocabulary size is denoted asn and the dimension of word vector space is denoted asd. Therefore each entry of similarity matrix is:
Sij =yiTW xj
=yi· (W xj)
(3.1) The largest value in a column represent the most similar source word for each target word, while the largest value in a row is the most similar target word for each source word. Then they form a second similarity matrixS0 =XQYT so that the matrix Q maps target word back to the source.
Sji0 =xTjQyi
=xj · (Qyi)
(3.2)
To keep self consistency, they require that S0 = ST. Since ST = XWTY, there is
Q = WT. It is natural that mapping between source and target word vector space is
reversible, andx ∼WTy, y∼ W x. Thus x ∼WTW x holds for any word vector x and it
is concluded the transformation matrixW is an orthogonal matrix O satisfying OTO =I. After normalizing word vectors x and y, the objective is to optimize the cosine distance between possible pairs:
max O n X i=1 yiTOxi,subject toOTO =I, (3.3) which is equivalent to the “orthogonal Procrustes problem” [81]:
min O n X i=1 kyi−Oxik2,subject to OTO =I. (3.4)
The proposed solution in their paper [82] is to form two ordered dictionary pair matrices
XD, YD (where XD, YD are ordered X, Y), by computing the SVD of M =YDTXD
and minimizing with:
O =U VT, (3.6)
the optimized similarity matrix becomes as the following:
S=Y U VTXT (3.7) Sij =yTi U V T xj = (UTyi)· (VTxj). (3.8) Therefore they could map from source space to target by applying the transformation matrix U VT to the source language matrix. This method is highly efficient and is proved to get a translation precision on 200k Italian sentences corpus with a precision of 68% [82].
3.3
Method
In this thesis, we mainly explore the methods of using linear transformation with stochastic gradient descent and singular value decomposition to the language matrix. Here we first give a brief introduction of the two algorithms. Also, we describe our strategy of selecting word pairs from two domains.
3.3.1
Linear Transformation
In mathematics, linear transformationT :V →W is an important rule to make geometric changes between two subspaces while preserving the operations of addition and scalar multiplication. Basically, linear transformation satisfies the following two conditions:
• T(~u+~v) =T(~u) +T(~v) for all vectors~u,~v in spaceV1, • T(c~u) =cT(u~) for all vectors~uin space V1 and a scalar c.
The linear transformation is useful because most geometric operations are linear trans-formations, including rotations, scaling, and reflections. The artificial neural network (ANN) takes the idea of linear transformation by producing the linear combinations of input signals and weight matrix as output. Moreover, neural network introduces bias inputs, nonlinear functions and so on. Despite its simplicity, a linear transformation still acts as an essential component in the architecture of modern machine learning and deep learning.
3.3.2
Stochastic Gradient Descent
Usually, gradient descent (GD) is used to minimize the least squared error by updating coefficients in linear regression and weights in neural networks. Learning rate refers to the size of steps specified by the negative gradient. With a high learning rate, the algorithm can cover more parameter space quickly under the risk of missing the optimal state. And with a low learning rate, the algorithm scans over the space more precisely with more iterations. Therefore, the learning rate can vary as a function of the number of iterations and decay rate, so that the algorithm updates quickly at the beginning and precisely when approaching the optimal state.
The main problem in gradient descent is that calculating the parameters in each iter-ation would be expensive, especially when the data is large. Therefore, the basic idea of stochastic gradient descent is to optimize by sampling on the training dataset. The result after each iteration is an estimation towards the globally optimal state. With stochastic gradient descent, the algorithm does not compute the exact derivative of loss function. Instead, it is estimating it on a small batch of data. To get a better estimation of the optimal direction, momentum is used as the moving average of gradients. In this thesis, we set the learning rate as 0.1, the decay rate as 1.0∗10−6 and momentum as 0.9.
3.3.3
Singular Value Decomposition
Singular value decomposition is a factorization of the matrix in linear algebra. It has many useful applications in statistics and signal processing. Here is the statement of singular value decomposition over rectangular matrix M ∈Rm×n:
M =UΣV∗
where
• U is a m×m unitary matrix over fieldK.
• Σ is a diagonal m×n matrix with non-negative values on the diagonal. • V is a n×n unitary matrix over K and V∗ is the conjugate transpose of V.
Therefore, the geometric meaning of the SVD theorem can be concluded as finding the orthonormal basis of two linear spaces. It is widely used in the field of unsupervised machine learning, so we can decompose a matrix into lower rank matrices without losing too much information.
3.4
Evaluation
We perform distributed word embeddings alignment on two datasets: the 300-dimension pre-trained Google News corpus word vector model (denoted as Google-wv) with over three billion words and phrases, and 300-dimension word vectors (denoted asGithub-wv) trained on a recently collected Github corpus consisting of pull requests, issue comments and commit messages. We further evaluate the trained word vector models using semantic and syntactic tasks. We implement singular value decomposition and linear transformation in stochastic gradient descent approaches. At last, we evaluate the aligned word vector space and conclude some words who have significant semantic shifts in high dimensional space.
3.4.1
Github Dataset
The Github dataset used in this thesis is firstly collected by Achyudh Ram, which includes raw data of pull requests, issue comments and commit messages from 4124 repositories and the size is around 9.5G. Repositories are selected on the basis of them being “engineered” projects that are maintained and developed by groups of people in contrast to student projects, forked project, etc [65]. A full list of engineeered projects can be found on the website of RepoReapers 1. Each record is stored in the format of JSON. Of the whole
dataset, there are 53,430 pull requests, 1,495,156 issue comments, and 1,933,243 commit messages. We first extract useful text information from the raw data including the title, description, and following comments on an issue post, pull request and commit record. We believe communications under a single item could give enough background information and context. Then we filter out any URL or non-alphanumerics to get a clean vocabulary. The last step of pre-processing is tokenization and lemmatization on the raw data.
Tokenization and lemmatization are widely used when processing texts in natural lan-guage processing. Giving a character sequence or document, tokenization is the task of splitting it into pieces called tokens. Tokens are usually referred to words or phrases with semantic meanings. Lemmatization removes derivation of words and returns the base for-mat in the dictionary. We denote the Github dataset asGithub-commentsin the remainder of the thesis.
3.4.2
Pre-trained Word Embeddings
We perform distributed word representation alignment between two pre-trained word vec-tor spaces. The target hyperspace is theGoogle-wv trained on Google News corpus. The source hyperspace is word embeddings trained on subculture corpus. As Section 2.2.2 describes the pre-trained approach, we obtain word embeddings using several training methods including word2vec [62] and fastText [44]. Let Github-wv denote word embed-dings trained onGithub-comments, and Github-wv-aligneddenote the results after using the alignment methods introduced in this chapter. Considering people leave their online comments informally, we also utilize another two datasets as comparison models. In addi-tion to the Github corpus, we collect about 44G real-time tweets in English from Twitter within a three-days time window. Moreover, we use WikiText dataset that contains 600 articles from Wikipedia2 as a comparison. Both Github and Twitter datasets uses mainly
day-to-day (informal) language, except there are more terminologies in the Github com-munity. On the contrary, WikiText dataset is well formatted and contains mainly formal language.
To select the best model, we try a series of configuration combinations and perform semantic and syntactic tasks for each model. These configurations include using skip-gram or CBOW training algorithm, the dimensions of feature vectors, the minimum token frequency threshold, and neural network model (word2vec or fastText).
There are several methods to evaluate the word embeddings [42, 6]. Extrinsic evalua-tion methods are based on the ability of word embeddings to be used as features of machine learning tasks, such as sentiment recognition, Part-of-Speech tagging, and topic modeling. On the other hand, intrinsic evaluation methods are experiments of word embeddings on human annotations of word relations, for example, word similarity, word analogy, and word pair association. In this thesis, we take Wordsim353 [21] and Questions-words 3 [62, 60]
as evaluation datasets. The dataset Wordsim353 provides a collection of human-assigned word pair similarity scores on a scale of 0.0 to 10.0 (e.g., train car 6.31), and it has re-cently emerged as a commonly used dataset for evaluating relatedness measures. There are two sets of English word pairs in Wordsim353. The first set contains 153 word pairs in 13 subjects, while the second set contains 200 word pairs in 16 subjects. The dataset Questions-words implies words relationships. There are five types of semantic and nine types of syntactic questions in the test set. For example, the semantic relationship type between (Athens, Greece) and (Oslo, Norway) is called common capital city, and the syn-tactic relationship type between (possibly, impossibly) and (ethical, unethical) is called
2https://en.wikipedia.org/wiki/Main Page
opposite. Overall, there are 8,869 semantic and 10,675 syntactic questions. We use built-in modules in Gensim4 to evaluate word vectors.
3.4.3
Anchor Words Selection Strategy
The selection of anchor words could have a significant influence on the quality of aligned word vector models. If the training word dataset is too small, the alignment model learns little about the entire vocabulary space and performs poorly when testing on larger datasets. However, if the training word dataset is too large and introduces a considerable portion of noisy word pairs, the model would try to map between irrelevant vectors. Thus over-fitting occurs. In general, we want to increase the training data size while keeping the semantic alignment of two domains.
Stopword is a commonly used concept in search engines that a particular set of words, like the and that, are ignored by the program when searching and indexing. Researchers believe that stop words would not change their semantic meanings significantly across language domain, therefore utilizing them as anchor words for alignment models could probably increase the accuracy [85].
However, there is one problem that the stop word list has limited tokens (around 50 words), but the transformation matrix in the space of 300 dimensions generally requires more than 100,000 parameters. Therefore, we consider enlarging the anchor word dataset by sampling from theWarriner-EPA vocabulary at random. We further explore the rela-tionship between anchor words and mean distance of alignment models.
3.4.4
Metrics
To assess the performance of the alignment model from Github subculture to general culture, we measure the average cosine distance between each word in two corpora before and after the alignment. If the average distance decreases significantly after alignment, it demonstrates our alignment model could transform the word vectors to the same high dimensional space effectively. Word vectors in Github-wv-aligneddo not necessarily to be exactly the same as they are in Google-wv because they represent two different corpora. However, they should be close in general.
To illustrate the semantic shift across Github and Google News corpus, we further compare words based on the Part-of-Speech and construct a few word lists of several topics, including sentiments and actions.
3.5
Results and Discussion
This section presents the results of parameter tuning, evaluation of training word vector models, and aligning high dimensional spaces. It could be divided into three parts: pa-rameter tuning and word embeddings evaluation (Part One), comparisons of word vector space alignment strategies (Part Two) and findings of cross-culture semantic shifts (Part Three).
3.5.1
Part One
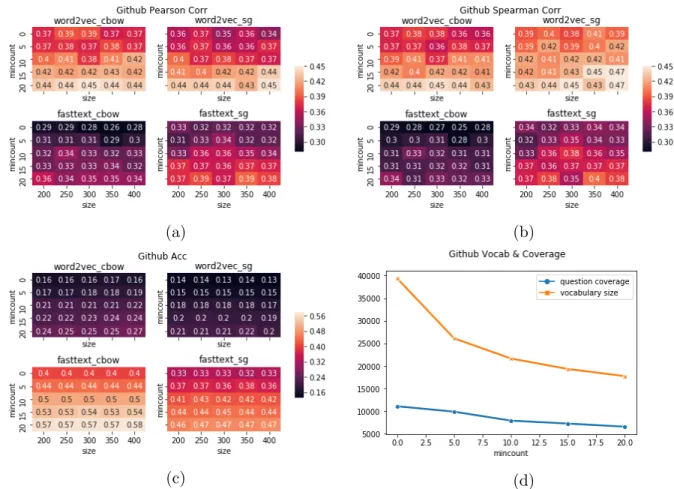
To get the best-trained word embedding model, we try different configuration combina-tions including the algorithm (word2vec or fasttext), architecture (skip-gram or CBOW), word vector dimension size as well as the minimum token frequency threshold, and do extensive evaluations for each model. Figure3.2shows the results of the parameter tuning on the Github corpus where the lighter color indicates the better performance. We mainly focus on two evaluation methods of word vectors: one is the word similarity regression test (Wordsim353), and the other is the word association test (Questions-words). The word similarity regression test is to predict the similarity score (from 0 to 10) of given word pairs, like bread and butter, computer and keyboard. We then calculate the Pear-son Correlation and Spearman Correlation comparing predictions and human annotated Wordsim353 scores (see Fig 3.2). The correlation scores range between 0.3 and 0.5 and p-values are around 10−12. The word association test Questions-words is about the linear relationship of word vectors (woman - man ∼ king - queen). The test dataset consists of 14 sections such as capital/country, currency, family, past tense of verbs, plurals of nouns. The trained word vector models can answer the questions with an accuracy of 0.58 in the best case, but only 0.13 in the worst case. Note, we ignore those questions that include any word which is not in the vocabulary of word embeddings Github-wv. For example, the word “furnace“ in Wordsim353(furnace stove 8.79) does not appear in Github-wv, so we do not count it in our evaluation stage. Same with (Athens Greece Tehran Iran) in Questions-words dataset.
We present the parameter tuning results in two evaluation tasks in Figure 3.2. Fig-ure 3.2a and Figure 3.2b are about correlations of the word similarity regression test.
(a) (b)
(c) (d)
Figure 3.2: The Github word embeddings evaluation results of word similarity test (Word-sim353) in Fig3.2a and Fig3.2b, and word association test (Questions-words) in Fig3.2c. There are four models: word2vec cbow, word2vec sg, fasttext cbow, and fasttext sg used in the experiments. Vector space dimensions (size) ranges between 200 and 400, and token frequency threshold (mincount) ranges between 0 and 20. Figure 3.2d demonstrates the trade-offs between vocabulary size and quality.
Figure3.2c and Figure 3.2d are about the word association test. Specifically, Figure 3.2c shows the accuracy of calculating the missing word based on their linear relationship, and Figure 3.2d plots the vocabulary size of Github-wv and intersected vocabulary size with Questions-words task. We compare the similarity regression correlations of using four algo-rithms, which are word2vec + CBOW (word2vec cbow), word2vec + skip-gram (word2vec sg), fasttext + CBOW (fasttext cbow), and fasttext + skip-gram (fasttext sg) in each figure. For each model, we study how vector dimensions (“size” as the horizontal axis) and
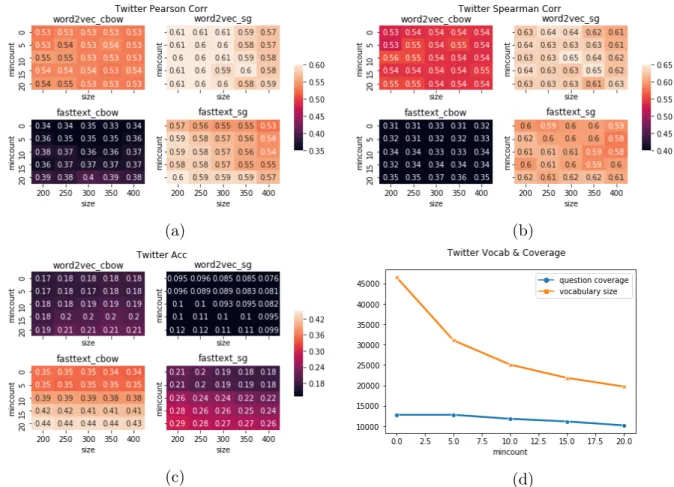
mini-(a) (b)
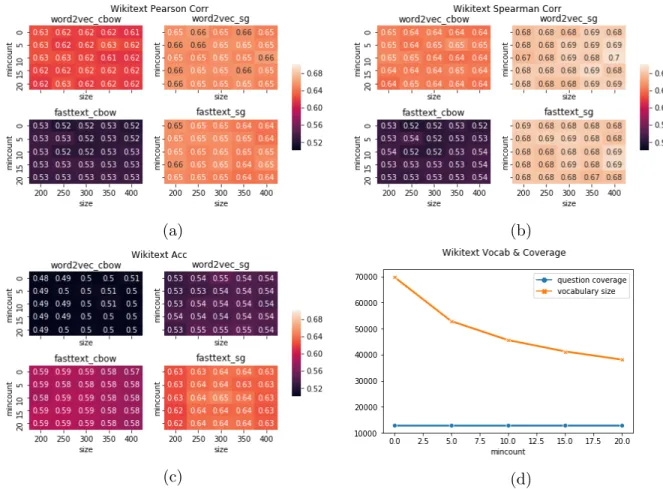
(c) (d)
Figure 3.3: The Twitter word embeddings evaluation results. They are similar to the experiments described in Fig 3.2.
mum token frequency threshold (“mincount” as the vertical axis) affect the performance. We use heatmap to show the results, where the a lighter color cell represents a higher correlation or accuracy rate.
As Figure3.2aand Figure3.2bindicate, in general, word2vec models can get higher cor-relation scores on word similarity test compared to fasttext, and using the skip-gram archi-tecture is slightly better than using CBOW. However, it is not the case in word association test as shown in Figure 3.2c, where fasttext performs significantly better than word2vec, and CBOW further improves the accuracy than skip-gram. All the three heatmaps indicate vector dimensions (“size”) ranging from 200 to 400 have little impact on two evaluation tasks. On the contrary, increasing the minimum token frequency threshold (“mincount”) can have better results. However, as Figure 3.2d demonstrates, the Github-wv
vocabu-(a) (b)
(c) (d)
Figure 3.4: The WikiText word embeddings evaluation results. They are similar to the experiments described in Fig 3.2.
lary shrinks a lot when setting “mincount” greater than 10. It is a trade-off between the vocabulary size and the word embeddings quality.
We further evaluate models on Twitter and Wikitext corpora, and the results agree as above (see Fig 3.3 and Fig 3.4). The results further support our conclusion above, that word2vec + sg models are better at word similarity test, while fasttext + CBOW can achieve higher accuracy on word association test. Vector dimension does not affect the performance a lot, but increasing frequency threshold (“mincount”) up to 20 can significantly improve the performance. In fact, “mincount” filters out noisy examples that occur occasionally in the raw data but have negative impacts on the training process. We also compare the model on different corpora horizontally as shown in Table3.1. Compared to models on other corpora, the Github word embedding model is relatively small and
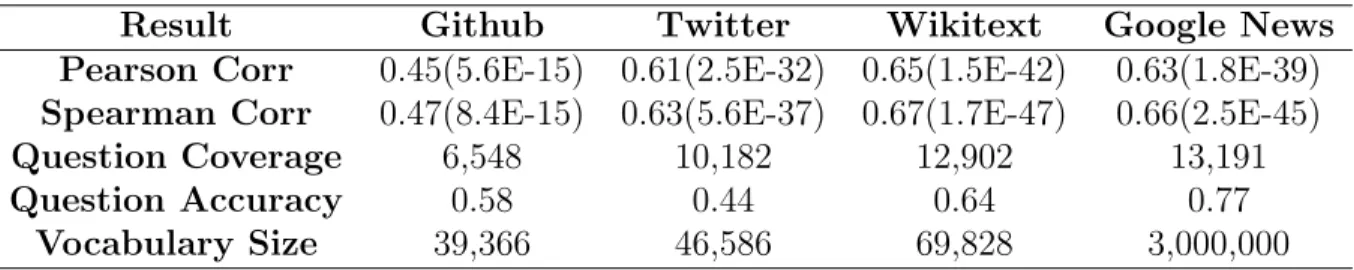
Result Github Twitter Wikitext Google News Pearson Corr 0.45(5.6E-15) 0.61(2.5E-32) 0.65(1.5E-42) 0.63(1.8E-39)
Spearman Corr 0.47(8.4E-15) 0.63(5.6E-37) 0.67(1.7E-47) 0.66(2.5E-45)
Question Coverage 6,548 10,182 12,902 13,191
Question Accuracy 0.58 0.44 0.64 0.77
Vocabulary Size 39,366 46,586 69,828 3,000,000 Table 3.1: Model evaluation and comparison on five corpora. Pearson and Spearman correlation with p-values are the results in word similarity task. Question coverage and accuracy are the results in word association task. Parameter settings: fasttext sg model, vector dimension as 300, and mincount as 5.
less accurate, which is partly because people in Github community care less about topics like politics, fashion, and economy than on Twitter or Google News. Taking all factors into consideration, we would use the 300-dimensional skip-gram word2vec model with the frequency threshold set as 20 as Github word vector model in the remainder of the paper.
3.5.2
Part Two
As described above, we have two methods to align high dimensional space: singular value decomposition (SVD) and linear transformation. In this part, we compare the alignment performance of each method, and further investigate the impact of seed words size.
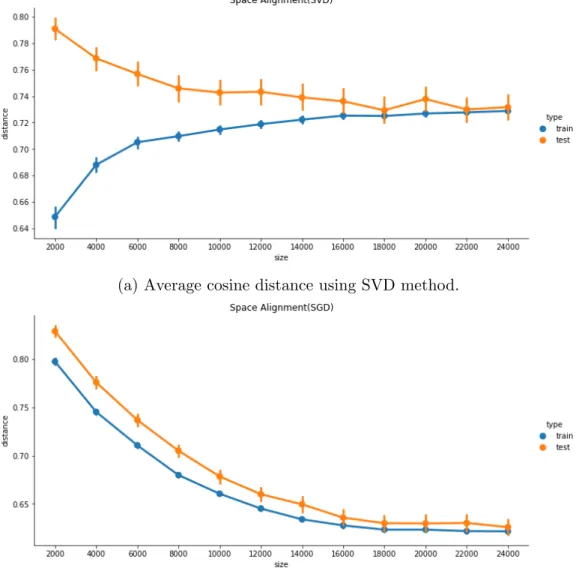
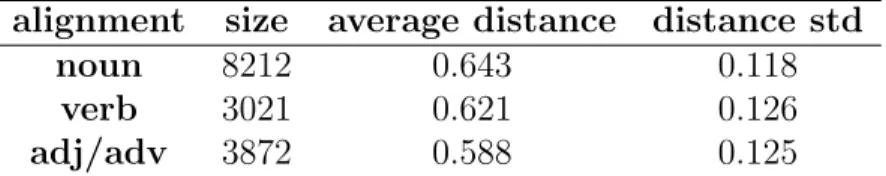
Figure3.5aplots the results of aligning word vector space using the SVD method under different scales of the training dataset. As it indicates, the average cosine distance of word pairs in two models increases as the training dataset enlarges. However, the standard deviation decreases. The aligned models are tested with 1,000 tokens selected from the vocabulary space at random. As it shows in the figure, the initial average distance is around 0.8 with 2,000 training words and the distance decreases to 0.74 with 24,000 training words. Figure 3.5b shows the results of using a linear transformation to align word vector space. We use 1,000 randomly selected words for testing as in the SVD method. As it is indicated, the average cosine distance for both training and testing decreases from over 0.80 to under 0.65 as the size of anchor words increases. We notice the performance would become stable with more than 18,000 anchor words.
In general, larger anchor words dataset can improve the alignment performance. How-ever, it has a different impact on the training process. When using a small bunch of data,
(a) Average cosine distance using SVD method.
(b) Average cosine distance using SGD method.
Figure 3.5: The figures show the performance changes under different scales of training dataset using SVD and SGD method. The blue line indicates the average distance between word pairs in training process, while orange line is the average distance on 1,000 testing word pairs.
SVD method could align the training word vector space pretty well. However, the lin-ear transformation does not align word pairs well. As training words increased, the SVD method shows its limitation in learning from big data, but linear transformation improves
the results gradually. Overall the linear transformation method beats the SVD method with an average cosine distance below 0.62 when testing. The two figures also indicate training such alignment models requires a large dataset. However, stop words sampling method cannot satisfy the requirement even if it has better quality. We can continue try-ing this strategy if havtry-ing a larger stop word vocabulary in the future. We think ustry-ing 20,000 tokens including stop words as aligning anchor words should be a good strategy. In the following of this thesis, we apply a linear transformation method to align word vector models.
3.5.3
Part Three
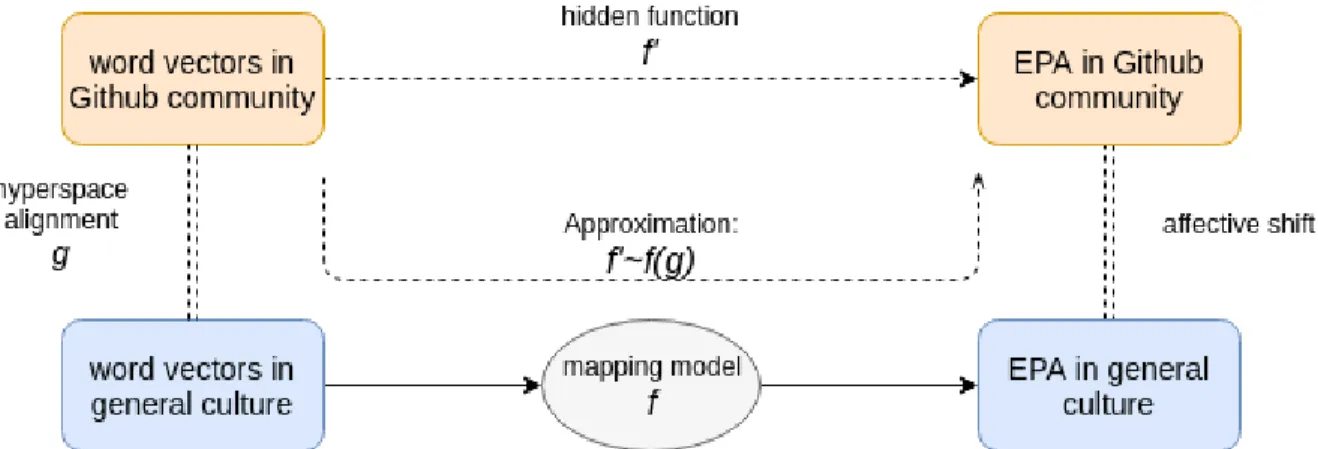
In this part, we turn our attention to analyze the semantic shifts across the web environ-ment. We apply our space alignment method to general culture (Google-wv) and the web subcultures (Github-wv). Firstly we divide all tokens into three-word sets according to Part-of-Speech (POS) tag: Noun, Verb, and Adj/Adv. For each word set, we calculate the average cosine distance and standard deviation of cross culture word pairs. As Table 3.2 shows, there are 8212 nouns, 3021 verbs, and 3872 adjectives or adverbs in total. In gen-eral, nouns have the highest mean distance at 0.643 and the lowest standard deviation as 0.118, which means there are significantly semantic shifts of nouns in space after alignment. However, the standard deviation of verbs is the highest at 0.126, which implies a part of verbs in vocabulary aligns well and has little semantic shift, but the other part shifts a lot. Adjectives and adverbs keep the lowest cosine distances across aligned culture space, so they have little semantic shifts in this case.
alignment size average distance distance std
noun 8212 0.643 0.118
verb 3021 0.621 0.126
adj/adv 3872 0.588 0.125
Table 3.2: Using NLTK Part-of-Speech tag, we divided the intersected vocabulary of Google-wvandGithub-wv-alignedinto three catogories: noun, verb, and adjective/adverb. We calculate the average cosine distance and standard deviation (std) for each word in two spaces.
Table 3.3 shows examples of semantic changes between general culture and Github. Verbcommit has significantly semantic shift in the Github culture. In general culture, the word is most close to contribute, perpetrate and engage (e.g. he committed an uncharac-teristic error). However, in the context of Github culture, commit is often related to code
word general github distance
commit contribute, perpetrate, engage revision, patch, merged, pr 0.960 thread purls, silk ribbons worker, process, daemon 0.613 bug worm, virus, insect, flaw issue, problem, typo, glitch 0.608 crash accident, collision, wrech corruption, error, hang 0.591 merge merger, combine, divest develop, add, resubmit 0.575 password passphrase, login, PIN code credential, authentication, token 0.358 happy glad, pleased, overjoyed, thrilled willing, grateful, inclined, glad 0.384 sad heartbreaking, bittersweet, tragic uncomfortable, nervous, uneasy 0.398 angry irate, annoyed, impatient upset, annoyed, nervous 0.434 excited thrilled, pleased, proud stoked, thrilled, pleased 0.382 cautious careful, mindful, hesitant careful, skeptical, worried 0.392 difficult impossible, tricky, tough challenging, complicated, hard 0.250 important vital, crucial, essential crucial, valuable, useful 0.278 significant substantial, markedly considerably, substantial 0.368 efficient economical, efficiency, streamlined robust, flexible, sophisticated 0.321 Table 3.3: Examples of words and their synonyms in Google-wv and Github-wv-aligned. Action words show significant semantic shift, while sentiment words do not have much shift. But sentiment words show subtle potency differences across the two cultures.
changes and the usage would be like “he committed a new revision”. Another example is the word bug. In general culture, the word bug refers to worm and insect. However, it mainly refers to software issue or problem instead of small insect in zoology.
We further found the words that represent human sentiments are not shifting a lot across culture. Table 3.3 gives a few examples of word synonyms by calculating cosine distances in hyperspace. The words with underline are related to sentiments, while words with dotted line are actions. Word “commit”, “crash”, and “merge” have large hyperspace distances after alignment, and we can see significant semantic shifts as those words are used in software community. On the other hand, word “happy”, “sad”, and “angry” do not have much semantic shifts, and the hyperspace distances are much smaller than these action verbs. We further construct an sentiment word list from an online website 5. The
word list consists of 147 words that describe sentiments, for example, alarmed, shamed, trust, etc. The average distance of sentiment words in the word list is around 0.35, while it is about 0.6 for action words in Table3.2. This is because most sentiments have universally shared meanings, but verbs are usually semantically overloaded. However, we still can find
subtle differences of sentiment words in two context. The word happy is similar to glad,
pleased and overjoyed. However, in Github environment, it is close to willing and inclined
which show preference to do something. For example, “I am happy to do this” is probably what people are saying in GitHub, whereas in general it is “I am happy” or “I feel happy today”. In next Chapter, we will introduce the Evaluation-Potency-Activity space, which could quantify those subtle changes in affective dimensions.
In a word, we believe verbs usually get apparent semantic shifts across subcultures and have different common usages. Moreover, sentiment words vary on the axis of potency. People tend to be close to neutral in Github culture compared to the general environment. We will prove this hypothesis in Chapter 4.
3.6
Conclusion
In this Chapter, we train and select the word embedding model on a Github corpus. We perform extensive parameter tuning and evaluation, and we further compare horizontally on Twitter and Wikitext corpus. The wikitext model gets the highest correlation score and prediction accuracy. We believe it is because of wikitext data is constructed formally and contains more linguistic information compared to Github and Twitter, since most pull requests, commit messages and tweets are short in length with misspelling and abbrevia-tion.
We applied two methods to align word vector space to make a further comparison of Github culture and general culture. We find linear transformation with at least 20,000 anchor words could get the best performance in learning enough space information in common while keeping the differences. Using the aligned Github model and GoogleNews model, we make a coarse-grained word-level comparison. We find verbs and nouns would have more semantic shifts across online web cultures while adjectives and adverbs keep relatively the same. Some words likecommit, merge, thread have developed specific usage in subculture and therefore become like terminologies. We also find people show different intensity when using sentiment words. In general, they behave more neutral in the Github environment without showing extreme intensities.
![Figure 3.1: Simple 2D visualization of distributed word vector representations of numbers and animals in English (left) and Spanish (right) [61].](https://thumb-us.123doks.com/thumbv2/123dok_us/9064755.2804611/27.918.247.692.182.490/figure-simple-visualization-distributed-representations-numbers-english-spanish.webp)