Multivariate Correlation Analysis for Supervised
Feature Selection in High-Dimensional Data
zur Erlangung des Doktorgrades
(Dr. rer. nat.)
der
Mathematisch-Naturwissenschaftlichen Fakult¨
at
der
Rheinischen Friedrich-Wilhelms-Universit¨
at Bonn
von
Arvind Kumar Shekar
aus
Tamil Nadu, India
Erscheinungsjahr: 2020
Reviewers
First-supervisor
Prof. Dr. Emmanuel Mueller
Rheinische Friedrich-Wilhelms-Universit¨at Bonn
Bonn-Aachen International Center for Information Technology
Second-supervisor
Prof. Dr. Eyke H¨ullermeier University of Paderborn Intelligent Systems Group
Fachnahes Mitglied
Prof. Dr. Reinhard Klein
Rheinische Friedrich-Wilhelms-Universit¨at Bonn Institut fuer Informatik II
Fachfremdes Mitglied
Prof. Dr. Ulf-G Meißner
Rheinische Friedrich-Wilhelms-Universit¨at Bonn
Helmholtz-Institut fuer Strahlen- und Kernphysik (Theorie)
Datum der m¨undlichen Pr¨ufung
In today’s scenario, several application domains involve collection of a large number of process variables also known as features. The high-dimensional feature space is commonly used for performing analytical tasks such as regression and clas-sification. In such a high-dimensional feature space, not all features are relevant for the defined analytical task (or target) and several of them may be redundant to each other. Eventually, feature selection is applied to obtain better prediction qual-ity and smaller set of relevant features. On the other hand, the idea of transforming the multivariate time series into feature spaces are common for data mining tasks like classification. This is often denoted as feature extraction. Similar to feature selection, it is performed by extracting the relevant and non-redundant information from the time series datasets. Overall, the topic of multivariate correlation analysis is of paramount importance for both feature selection and extraction tasks.
The main theme of this dissertation focuses on multivariate correlation analy-sis on different data types and we identify and define various research gaps in the same. For the defined research gaps we develop novel techniques that address rele-vance of features to the target and redundancy of features amidst themselves. Our techniques aim at handling homogeneous data, i.e., only continuous or categorical features, mixed data, i.e., continuous and categorical features, and time series.
Multiple views of the feature space exhibit different interactions between fea-tures and the target. Harnessing these interactions for the selection of relevant subsets may enrich the prediction model with novel information. Nevertheless, several existing feature selection algorithms focus on obtaining a single projection of the features and are not able to exploit the multiple local interactions from different feature subsets. In such datasets, few features by itself can have a small correlation with the target, but by combining these features with other features, they can be strongly correlated. Hence, it is necessary to evaluate the relevance of a feature based on its higher-order interactions in the dataset. By computing pair-wise correlations, several existing works fail to address higher-order interactions between more than two features. For feature extraction in time series applications, the correlation analysis is performed without changing the inherent ordering of the
simultaneously extract relevant and novel multivariate subsequences and transform them into features. However, traditional feature transformation approaches are of-ten unsupervised or require additional post-processing techniques. Addressing all aforementioned problems require novel algorithms that perform large number of complex statistical computations. This hinders the user understanding of mul-tivariate correlations. Existing correlation analysis algorithms and tools provide only feature ranks or scores and the user perceive the algorithms as a black-box technique. Consequently, the final problem we intend to address is enhancing the transparency of multivariate correlation analysis. Hence, in addition to the algorithmic contributions, we aim to enhance the user’s understandability of mul-tivariate correlations in a dataset by presenting a novel software framework.
First, we present our algorithm called diverse subset selection strategy (DS3) that identifies diverse and complementary views of the dataset. We extend the concept of multiple views to our relevance and redundancy (RaR) ranking frame-work for mixed datasets which exhibit higher-order interactions. By evaluat-ing the co-occurrence of subsequences in multiple dimensions, our ordinal fea-ture extraction (ordex) algorithm evaluates higher-order interactions in time se-ries applications. Finally, we provide a software framework for exploring and
understanding multivariate correlations (FEXUM), to help users understand and evaluate the multivariate correlations in the data. In addition, this dissertation includes an extensive experimental and theoretical evaluation of the quality and scalability of our approaches with respect to the existing works. Apart from the-oretical time complexity analysis, our evaluation methods are two-fold, i.e., we evaluate the proposed algorithms on synthetic and real world data. Overall, our findings show that our proposed contributions enhance the prediction accuracy and efficiency in comparison to several traditional approaches.
In vielen Anwendungsbereichen werden heutzutage zahlreiche Prozessvariablen, auch Features genannt, gesammelt. Dieser hochdimensionale Feature-Raum wird gemeinhin f¨ur analytische Aufgaben wie Klassifikation oder Regression genutzt. Dabei ist es wichtig, diejenigen Informationen zu extrahieren, die f¨ur die zugrun-deliegende Aufgabe relevant sind. Sowohl f¨ur Feature-Selektion als auch f¨ur Ex-traktionsaufgaben ist das Thema der multivariaten Korrelationsanalyse von beson-derer Wichtigkeit.
Das prim¨are Thema der vorliegenden Arbeit ist die multivariate Korrelations-analyse von verschiedenen Datentypen. In dieser Arbeit werden die bestehenden L¨ucken im Feld der multivariaten Korrelationsanalyse identifiziert, analysiert und aufgef¨ullt. Dazu wurden mehrere neuartige Techniken entwickelt, um die Korre-lation der Features zu einem Target (d.h. die Relevanz) und die KorreKorre-lation der Features untereinander (d.h. die Redundanz) zu untersuchen, und zwar f¨ur ver-schiedene Datentypen wie kontinuierliche und kategorische Daten sowie Zeitreihen. Bei verschiedenen Blickwinkeln auf den mehrdimensionalen Feature-Raum zeigen sich unterschiedliche Wechselwirkungen zwischen den Features und dem Target. Die Ausnutzung dieser Wechselwrikungen verspricht eine Verbesserung der Prog-nosemodelle anhand dieser neuartigen Informationen. Einige existierende Feature-Selektionsalgorithmen konzentrieren sich darauf, eine einzige Projektion der Fea-tures durchzuf¨uhren. Sie sind daher nicht in der Lage, die vielen lokalen Wechsel-wirkungen der verschiedenen Feature-Subsets auszunutzen. In solchen Datens¨atzen zeigen einzeln betrachtete Features nur geringe Korrelationen zum Target. Durch Kombination mit weiteren Features k¨onnen jedoch starke Korrelationen zum Tar-get zutage treten. Daher ist es notwendig, die Relevanz eines Features unter Ber¨ucksichtigung seiner Wechselwirkungen h¨oherer Ordnung zu beurteilen. Auch das Berechnen der paarweisen Korrelation, wie es von einigen Algorithmen prak-tiziert wird, l¨asst keine Beurteilung der Wechselwirkungen h¨oherer Ordnung zwis-chen mehr als zwei Features zu. Zus¨atzlich zur Dimensionalit¨at muss aus einem Zeitreihen-Datensatz eine große Anzahl von Teilreihen extrahiert und ausgew-ertet werden. Dazu wird ein effizientes Framework ben¨otigt, das es erlaubt,
gle-un¨uberwacht oder erfordern zus¨atzliche Nachbearbeitung.
Um alle erw¨ahnten Probleme zu behandeln bedarf es eines neuartigen Frame-works, das aufw¨andige statistische Berechnungen anstellt. Dies erschwert das Verst¨andnis der Benutzer f¨ur die komplexen multivariaten Korrelationen. De-shalb soll als letztes Problem die Transparenz der multivariaten Korrelationsanal-yse verbessert werden. So wird zus¨atzlich zur Algorithmenentwicklung auch das Verst¨andnis des Benutzers f¨ur die multivariate Korrelationsanalyse durch ein neues Software-Framework verbessert.
Zun¨achst wird der Algorithmus
”diverse subset selection strategy (DS3)“ vorgestellt, der die verschiedenen Blickwinkel auf den mehrdimensionalen Datensatz identi-fiziert. Dieses Konzept der verschiedenen Blickwinkel wird auf das
”relevance and redundancy (RaR)“ Ranking-Framework erweitert, das gemischte Datens¨atze mit Wechselwirkungen h¨oherer Ordnung untersucht. Der “ordinal feature extraction (ordex)” Algorithmus untersucht Wechselwirkungen h¨oherer Ordnung in Zeitrei-henanalysen durch Auswertung der Kookkurrenz von Mustern in mehreren Dimen-sionen. Zuletzt wird das
”framework for exploring and understanding multivariate correlations (FEXUM)” vorgestellt, das es Benutzern erlaubt, multivariate Kor-relationen in den Daten zu verstehen und zu beurteilen. Zus¨atzlich enth¨alt diese Dissertation ausf¨uhrliche experimentelle und theoretische Vergleiche hinsichtlich Qualit¨at und Skalierbarkeit der vorgestellten Ans¨atze zu bestehenden Arbeiten. Abgesehen von der theoretischen Komplexit¨atsanalyse werden zwei Evaluations-methoden angewandt. Dazu werden die vorgestellten Algorithmwen sowohl mit synthetischen als auch echten Daten bewertet. Insgesamt wird gezeigt, dass die vorgestellten Methoden die Vorhersagegenauigkeit und –Effizienz gegen¨uber vielen traditionellen Methoden verbessern.
I express my earnest regards to my advisor Prof. Dr. Emmanuel Mueller at University of Bonn, who provided me the opportunity to be a part of his research group. Prof. Mueller provided me the chance to pursue my research interests. His interactive feedback has always been of great help and thought provoking.
I thank Prof. Dr. Eyke Huellermeier for his valuable comments to enhance the theoretical aspects of this work. The feedback from him and his chair was greatly helpful in improving this work.
I thank Dr. Patricia Iglesias Sanchez for her valuable support and discussions as a mentor. Her review comments on the various publications were highly construc-tive and always helped me to improve. A special thanks to Dr. Jens Thurso and Mr. Klaus G¨onner (Bosch GmbH, PS-IG/ENS management) for their generous travel fundings and organizational support. I greatly respect and value the ex-change from various data scientists, data providers and engineers at Robert Bosch GmbH. I thank Dr. Daniel Zander and Mr. Erik Van Winkle for their prudent comments as a proof-reader.
Most of the research approaches developed in this thesis are the result of team work. I want to thank everyone who worked together with me. Also many thanks to my graduands and bachelor project team for their support in the implementation of some of the solutions in this thesis. I also thank my colleagues at Hasso-Plattner Institute and University of Bonn for the interesting discussions and valuable com-ments that helped me to learn and improve.
I thank Prof. Dr. Felix Naumann, Prof. Dr. Stefan Kurz, Dr. Michael Hackner, Dr. Carsten Kopp and Dr. Nadine Jung for all their encouragement and support. Last but not the least, I want to especially thank my family for having supported me during all these times. In particular, I want to thank my mother for all her moral support and motivation.
List of Figures xvii
List of Tables xxi
Nomenclature xxiii
1 Thesis Overview 1
1.1 From Data to Knowledge . . . 3
1.2 Goals . . . 5
1.3 Challenges . . . 9
1.4 Contributions . . . 13
2 Fundamentals and literature overview 17 2.1 Fundamentals . . . 19
2.1.1 Feature selection . . . 19
2.1.2 Feature extraction . . . 22
2.1.3 Correlation Analysis . . . 23
2.1.4 Basic Notions . . . 25
2.2 Overview of feature selection literature . . . 28
2.2.1 Search organization . . . 29
2.2.2 Feature Selection Paradigms . . . 32
2.3 Overview of feature extraction literature . . . 41
2.3.1 Time series learning paradigms . . . 41
2.4 Thesis contributions in comparison to the related literature . . . 43
3 Diverse Selection of Feature Subsets 47 3.1 Motivation . . . 49
3.3 Problem Definition . . . 51
3.4 Relevance Based Generation of Initial Candidates . . . 52
3.5 Multiple Feature Sets based on Difference and Quality . . . 53
3.6 Unifying Multiple Subsets By Ensemble Regression . . . 55
3.7 Time Complexity . . . 56
3.8 Experimental Evaluation . . . 56
3.8.1 Synthetic Data sets . . . 58
3.8.2 Real world Data sets . . . 61
3.9 Summary . . . 66
4 Multivariate Relevance and Redundancy Scoring in Mixed data-set 67 4.1 Motivation . . . 69
4.2 Comparison to Related Work . . . 71
4.3 Problem Definition . . . 72
4.4 Subspace relevance . . . 73
4.5 Decomposition For Feature Relevance Estimation . . . 75
4.6 Redundancy Estimation . . . 81
4.7 Unification of Relevance and Redundancy scores . . . 83
4.8 Time Complexity . . . 84
4.9 Algorithmic enhancement for redundancy estimation . . . 85
4.10 Experimental Evaluation . . . 88
4.10.1 Synthetic Data sets . . . 89
4.10.2 Real world Data sets . . . 93
4.11 Summary . . . 94
5 Multivariate Relevance and Redundancy Scoring in Time Series 97 5.1 Motivation . . . 99
5.2 Comparison to Related Work . . . 102
5.3 Problem Definition . . . 103
5.4 Extraction of Multivariate Ordinal Patterns . . . 105
5.5 Relevance Scoring . . . 108
5.5.1 Theoretical foundations of feature relevance score based on Chebychev’s inequality . . . 110
5.6 Redundancy Scoring . . . 113
5.8 Experimental Evaluation . . . 117
5.8.1 Synthetic Data sets . . . 118
5.8.2 Real world Data sets . . . 121
5.9 Illustration of ordinality . . . 123
5.10 Parameters of Ordex . . . 126
5.11 Summary . . . 127
6 Framework for Understanding Multivariate Correlations 129 6.1 Motivation . . . 131
6.2 Correlation Summary . . . 132
6.3 Multivariate Correlations . . . 133
6.4 Redundancy approximation for FEXUM . . . 135
6.5 Summary . . . 137
7 Summary and Future Research 139 7.1 Summary . . . 141
7.2 Future Research Directions . . . 144
1.1 The task of training a machine learning model [FPSS96] . . . 3
1.2 Time series representing two classes, where the subsequence of in-terest is highlighted in black . . . 7
1.3 Focus of the dissertation . . . 9
1.4 Overview of thesis contributions . . . 14
1.5 Evaluation strategy followed for all algorithmic contributions in this dissertation . . . 15
2.1 The transformation step of the KDD process . . . 19
2.2 With increasing dimensionality of data, the prediction accuracy drops after a threshold number of features[JGDE08] . . . 19
2.3 Visual representation of the two classes, i.e., car and truck, over a single feature . . . 20
2.4 Classification task with two features, where the red line denotes the classification boundary . . . 20
2.5 Classification task with 3 features, where the red plane denotes the classification boundary . . . 21
2.6 Projection of the three-dimensional feature space to two dimensions, where the red line denotes the classification boundary . . . 21
2.7 Correlation of the features to the target [KMB12] . . . 22
2.8 Time series dataset for a supervised feature extraction based on a discrete target Y . . . 27
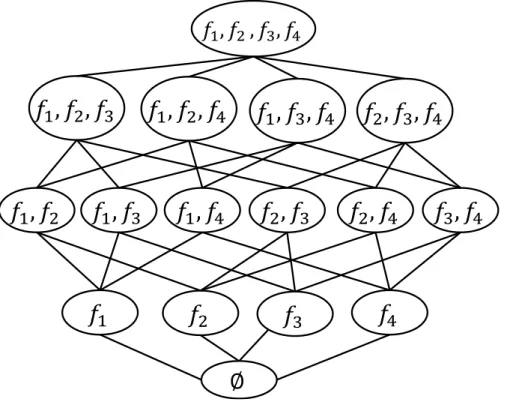
2.9 Different search organization approaches for feature selection [JBB15] 29 2.10 Search space for a given feature space F ={f1, f2, f3, f4} . . . 30
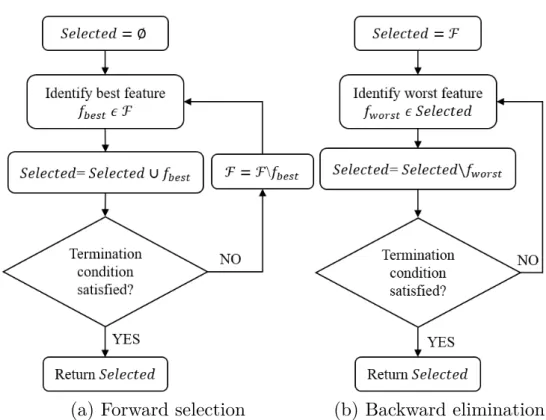
2.11 Iterative search organization techniques . . . 31
2.12 Feature selection paradigms . . . 32
2.13 Contrast as a measure of statistical dependence . . . 37
2.14 Time series approaches . . . 41
3.1 Quality (NRMSE) comparison of the competitor approaches vs. DS3 with increasing dimensionality (20, 40, 80, 120, 160, 200) and
fixed database size of 1000 samples . . . 58
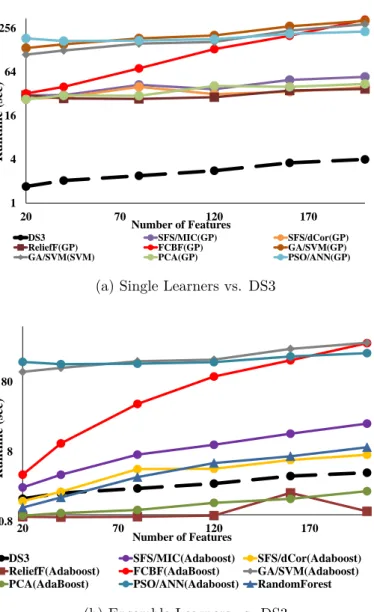
3.2 Run time (selection + training times) comparison of the competitor approaches vs. DS3 with increasing dimensionality (20, 40, 80, 120, 160, 200) and fixed database size of 1000 samples . . . 59
3.3 Run time (selection + training times) comparison with increasing database size (1000, 2000, 4000, 6000, 8000, 12000) and fixed di-mensionality of 80 . . . 60
3.4 Analysis of the influence ofαon test data with different dimension-ality. The circled points denote the minimal test data error . . . 63
3.5 Maximum fit error (using OLS) of initial candidates in each iteration of the symmetric difference search space: α= 0.9 . . . 64
3.6 Feature ranking of different correlation measures. 1 denotes that the ranking is exactly the same and 0 denotes extreme dissimilarity in feature ranking . . . 65
4.1 Proportion of datasets (in percentage) with different data types in UCI repository as on October 2019. Where total number of datasets were 488 and 68 datasets did not have the data type defined in the repository summary . . . 70
4.2 Run time Evaluation: Run times of RaR vs. competitor approaches 90 4.3 Quality Evaluation: CG of RaR vs. Competitor techniques . . . 90
4.4 Parameter Study, on synthetic dataset of 50 features and 20000 instances . . . 91
4.5 Speedup of RaR . . . 91
4.6 Robustness of feature ranking . . . 92
4.7 f-Scores of top 30 features on Isolet dataset . . . 94
5.1 Example of univariate ordinality and the all ordinalities of d = 3 for a smooth driver . . . 100
5.2 Example of univariate ordinality and the all ordinalities of d = 3 for a rash driver . . . 100
5.3 Example of multivariate pattern combination . . . 101
5.4 Workflow of ordex . . . 105
5.5 Illustration of multivariate ordinal pattern set for Example 5.1, where d= 3 . . . 106
5.6 Illustration of relevant and irrelevant feature based on Equation 5.2. Where, length of the colored blocks denote the variance of tions, inverted triangles denote the expected values of the distribu-tions and colors denote the class . . . 109
5.7 Example: A number line with limits [0,1] . . . 111 5.8 Evaluation of scalability using synthetic data, where d = 5 . . . 118 5.9 Robustness of ordex with varying number of irrelevant dimensions
and fixed number (5) of relevant dimensions . . . 119 5.10 Analysis of the parameter using synthetic data, whered = 5 . . . . 120 5.11 Accuracy of top 10 features ofordex . . . 122 5.12 Synthetic dataset for illustration of ordinal patterns ofd = 3 . . . 124 5.13 Frequency of ordinalities denoted using color bar for the synthetic
dataset shown in Figure 5.12. Where, x-axis and y-axis denote the time and ordinalities. The x-mark on the time axis signifies the point where the class changes from A to B . . . 125 5.14 Frequency of ordinalities denoted using color bar for Bosch
multi-variate time series dataset. Where, x-axis and y-axis denote the time and ordinalities. The x-mark on the time axis signifies the point where the class changes . . . 126 6.1 Features drawn using a force-directed graph (right), with the target
highlighted in green. An analysis view of two features (left) for inspecting the correlations. . . 134
2.1 Representation of a dataset with mixed data types, where, FC = {f1,· · ·, f3} are continuous features and FN ={f4} is a categorical
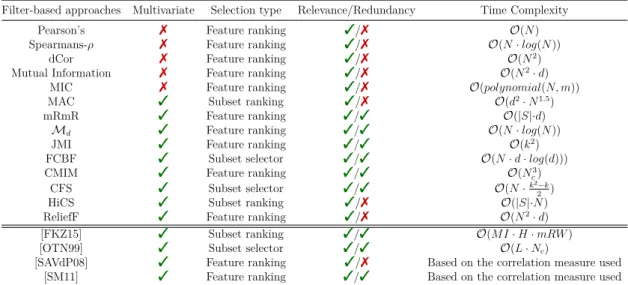
feature . . . 25 2.2 Comparison of search organization techniques [JBB15, DSL15] . . . 32 2.3 Summary of filter-based approaches, where the last four literatures
are ensemble methods . . . 38 2.4 Summary of various feature selection paradigms . . . 40 2.5 Advantage and disadvantage of various time series approaches . . . 43 3.1 Comparison of DS3 with other relevant literatures from different
feature selection paradigms . . . 50 3.2 Properties of real world datasets used for experimental comparison
of DS3 and other competitor approaches . . . 61 3.3 Comparison of prediction errors (NRMSE) of competitor techniques
versus DS3 on real-world datasets on test data . . . 62 3.4 Comparison of run times of competitor techniques versus DS3 on
real-world datasets . . . 62 4.1 Comparison of RaR with other relevant literatures from different
feature selection paradigms . . . 71 4.2 Illustrative example of feature constraints for 3 Monte Carlo iterations 79 4.3 Illustrative example of feature constraints for 3 Monte Carlo iterations 86 4.4 Properties of datasets used for experimental comparison of RaR and
other competitor approaches . . . 89 4.5 Average f-score of 3 fold cross-validation using KNN (K=20) classifier 92 4.6 Feature ranking run times in sec of RaR vs. competitor approaches 92 4.7 Number of features required to obtain the quality in Table 4.5 . . . 94 5.1 Comparison of ordex with other relevant literatures from different
5.2 Illustrative example of ordinal pattern redundancy . . . 114 5.3 Test data accuracy in % withordex d = 5 and m0 = 3. SAX word
size and alphabet size is 3. LSTM of maximum epochs 100 and mini-batch size 10. Experiments that had run times more than one day are denoted as ** . . . 121 5.4 Runtime insec, experiments that had run times more than one day
are denoted as ** . . . 121 5.5 Real world data experiment parameter settings . . . 127 6.1 Comparison of feature selection tools . . . 132 6.2 Illustrative example of Algorithm 7 . . . 136 6.3 red collection dictionary based on our example in Table 6.2 . . . . 136
Acronyms
AI Artificial Intelligence ANN Artificial Neural Networks
CFS Correlation-based Feature Selector
CG Cumulative Gain
CMIM Conditional Mutual Information Maximization CPU Central Processing unit
dCor Distance Correlation
DS3 Diverse Subset Selection Strategy DTW Dynamic Time Warping
ECG Electrocardiography
FCBF Fast Correlation-Based Filter
FEXUM Framework for exploring and understanding the multivariate correla-tions
FFT Fast Fourier Transform GA Genetic Algorithms GP Gaussian Processes
GPU Graphical Processing Unit
H Shannon entropy
HCTSA Highly Comparative Time series Analysis HiCS High Contrast Subspaces
IG Information Gain IoT Internet-of-Things
JMI Joint Mutual Information
KDD Knowledge Discovery in Databases KLD Kullback–Leibler Divergence KNN K-Nearest Neighbors
LSTM Long Short-Term Memory
MAC Multivariate Maximal Correlation Analysis
MCMR Maximum Correlation and Minimum Redundancy MFS Mixed Feature Selection
MI Mutual Information
MIC Maximal Information Criterion
mRmR maximum Relevance minimum Redundancy mRW modified Relief Weight
NRMSE Normalized Root Mean Square Error OLS Ordinary Least Squares
Ordex Ordinal feature extraction PCA Principal Component Analysis PSO Particle Swarm Optimization RaR Relevance and Redundancy
SAX Symbolic aggregate approximation SBE Sequential Backward Elimination SFFS Sequential Forward Floating Selection SFS Sequential Forward Selection
SU Symmetric Uncertainty
SV Shapley value
Feature selection notations
f Feature
Y Target
F Feature space
d Number of features in a feature space
div Divergence function
N Number of instances or samples in a dataset
FN Set of categorical features
FC Set of continuous features
D Dataset comprising of feature space and target, i.e, F ∪Y corr(f, Y) Correlation of a feature to target, also denoted as corr(f)
S Feature subset
Feature extraction notations
X A univariate time series
t Time series index
T A multivariate time series sample
m Dimensionality of a multivariate time series sample
D A time series dataset
n Number of time series samples in a dataset
s An ordinal pattern
S A set of ordinal patterns
Define the analytical task Preprocessing Transformation Data mining Evaluation Data Knowledge
Figure 1.1: The task of training a machine learning model [FPSS96]
1.1
From Data to Knowledge
In the modern era of Internet-of-Things (IoT), data from a plethora of sensors are readily accessible. With the availability of such vast amounts of data in various applications such as bio-informatics, automotive, finance, media and medical, the first question that arises is: How to extract useful knowledge from the data? The Knowledge Discovery in Databases (KDD) process delineates the different steps for acquiring valuable knowledge from the data [FPSS96]. As shown in Figure 1.1, this process involves five major steps. The first step is understanding the domain and defining the analytical task. Having fixed a tangible goal, the second step involves data preprocessing, i.e., removal of noisy data and treatment of missing values. The dimensionality of the preprocessed data is reduced at the transformation step by selection or extraction of information that are relevant to the analytical task.
This supervised transformation phase of the KDD process is the primary focus of the dissertation. Finally, the transformed or reduced data is used as an input for various data mining algorithms, e.g., classification and regression, and the results are evaluated for obtaining useful knowledge from the data.
As we focus on supervised transformation, our predominant application will be prediction systems with a target. The KDD process supports in systematic build-ing of such prediction systems and we provide an example from our application. In automotive domain, data from hundreds of sensors in the car and driving
char-acteristics are used to predict the health of an automotive fuel system [SdSFS18]. In this case, the health of the automotive fuel system serves as a target vector that is to be predicted. Using the data from various sensors as features and the target, a concrete analytical objective is defined for the prediction system, i.e., step one of the KDD process. Typically, sensor data contain a lot of incomplete and noisy information. The data is thus cleaned and structured, i.e., the preprocessing step of the KDD process. However, not all sensors are influenced by the health-state of a fuel system. Hence, relevant information like fuel quantity and temperature are selected from the cleaned data, i.e., the transformation step of the KDD process. As a supervised learning task, the transformed data and the target vector repre-senting the health-state of fuel system are fed into the classification or regression algorithms. The algorithm learns the latent function, between the transformed data and the target vector, i.e., the data mining step of the KDD process. The results are evaluated by domain experts to gain insights on the health-state of fuel system, i.e., evaluation step of the KDD process.
The transformation step is one of the most time consuming in the entire KDD process chain [FPSS96, ON14]. Selection of relevant information prior to applica-tion of classificaapplica-tion or regression algorithms have several advantages such as:
• Reduced dimensionality [SSM17, SBS+17].
• Increased efficiency and accuracy of prediction systems [MBN02, YL03].
• Enhanced user understandability of prediction systems [DP05].
• Reduced susceptibility to over-fitting [GE03].
• Reduced storage and measurement cost [HS98].
In short, problem of selecting information relevant to the target, i.e., transforma-tion step, is of great importance for predictransforma-tion systems. Hence, this work targets on qualitative and quantitative enhancements in the transformation step. Moreover, this dissertation will substantiate the need for such enhancements and introduce novel algorithmic frameworks for the same.
1.2
Goals
Feature selection and extraction are the pivotal components of the transformation step. The main goal of multivariate feature selection and extraction is to provide a small and predictive subset of features based on its correlation with the tar-get. They are proven to be useful in several application domains [HLY08, SBS+17, RSA+18, SdSFS18] and has therefore been an extensively researched topic in the data mining community [Qui14, NAM01, GE03, RˇSK03, WSH06, KMB12]. How-ever, there are multiple open research questions that enhance the selection and extraction processes. In this section, we motivate these research questions and introduce our goals using examples from various application domains such as au-tomotive, medical, marketing, aerospace, economical analysis and bio-informatics. However, they are not limited to these application domains. Following the sum-mary of thesis goals, in the next section, we elaborate the challenges that we are confronted with. Finally, we provide a summary of the contributions we present in this work.
Multi-view
In large datasets that contain features acquired from multiple sensor sources, dif-ferent feature combinations, i.e, multiple views, can exhibit difdif-ferent type of cor-relation with the target [SSM17]. For example, in automotive domain, a wide range of sensors such as pressure sensor, thermistor and potentiometer are used for data acquisition. Due to the heterogeneity of the sources, different feature subsets interact differently with the target. In other words, each feature subset shows a different type of correlation with the target. For example, the features representing the air system of an automobile correlates differently to the target when compared to the features representing the fuel system. Selecting such multiple views of the dataset can improve the prediction quality in comparison to selection of a single large feature subset. This necessitates an algorithm to exploit the correlations in multiple views of the data. Such a framework acknowledges the local interactions in the high-dimensional feature space to enrich the prediction model and improve its accuracy. Hence, we aim to systematically generate and evaluate multiple views of the feature space to capture these local interactions.
Higher-order interactions
In dependency-oriented datasets, i.e., datasets that exhibit multivariate correla-tions with the target, individual features may show a low magnitude of relevance to the target. These individual features in combination with other features in the dataset can be strongly relevant for the target prediction. This means that multiple features exhibit higher-order interactions among themselves. Performing bivariate correlation analysis in such cases can lead to distorted knowledge about the fea-ture’s relevance [SBS+17]. Hence, it is necessary to estimate its relevance based on the higher-order interactions for better prediction accuracy. Let us assume the task of identifying features that correlate with the health of a particular component in an aircraft. In such a system, features representing the individual components and environmental conditions exhibit higher-order interactions [RSA+18]. Hence, evaluating the relevance of a feature without analyzing its interactions with the other features is misleading. We aim to develop an algorithm that scores a feature’s relevance based on its interaction with several other feature combinations.
Mixed data types
Several datasets from real world applications such as medical, marketing and economical analysis contain different data types, i.e., continuous and categorical [HLY08]. For example, let us assume a categorical variableN ationality with three different categories {Indian, German, F rench}. During the analysis of multivari-ate correlations, a subset of features can have a mix of both cmultivari-ategorical and con-tinuous features. In such scenarios, the categories cannot be treated as numerical values because each state or category denotes a qualitative property. This implies that their relevance for predicting the target needs to be evaluated differently in comparison to the continuous feature values. However, evaluation of continuous and categorical features with different correlation functions can be problematic because they are not directly comparable to each other [TM07]. Hence, our goal is to evaluate the relevance of a mixed feature subset based on a single criterion function that is not affected by the data type.
0.00 0.25 0.50 0.75 1.00 0 50 100 Time (s) Amplitude
(a) A time series representing class 1
0.00 0.25 0.50 0.75 1.00 0 50 100 Time (s) Amplitude
(b) A time series representing class 2
Figure 1.2: Time series representing two classes, where the subsequence of interest is highlighted in black
Multivariate time series
Similar to continuous and categorical features, time series is yet another data type that is prevalent in several applications [WSH06, WWW07, YK09]. A time series is a sequence of numerical values indexed by time. That is, the order of a se-quence should not be altered during correlation analysis. For example, Figure 1.2 shows the ECG signals representing two different classes [CKH+15, YK09]. Each of them have a subsequence of the time series highlighted in black. These subse-quences are characteristic or unique for that particular class. Correlation analysis on time series data involves identifying these subsequences that are relevant to tar-get and encoding them into features for performing predictions. In a multivariate time series, subsequences from multiple dimensions interact to be discriminative for the prediction task. In other words, they exhibit higher-order interactions, i.e., a single subsequence form a dimension may be less relevant in comparison to a collection of subsequences from multiple dimensions. For example, in stock market data, subsequences from multiple time series can be used collectively to predict bullish or bearish markets [KvD10]. In such applications, it is crucial to evaluate the co-occurrences of subsequences from different companies for better predictions [AEG14]. Hence, our goal is to evaluate such higher-order interactions in a multivariate time series dataset.
Redundancy
As discussed above, feature selection evaluates the feature vs. target correlations. However, two relevant features can also be redundant to each other. For example, in bio-informatics applications, thousands of features pertaining to genetic infor-mation are used to classify cancer tissues from normal tissues. Several features in such high-dimensional feature space render similar information, i.e., they exhibit correlation amongst themselves [DP05, SBS+17]. These redundant features affect the efficiency of the prediction model, i.e., larger training time [MBN02, YL03]. In the KDD process depicted in Figure 1.1, the transformation step precedes the clas-sification or regression task. Hence, it is ideal to eliminate the redundancy prior to training a machine learning model. This dissertation will aim to address the problem of information redundancy for feature selection and extraction to enhance the generalization ability of the prediction model [PLD05, DP05].
Understanding the correlations
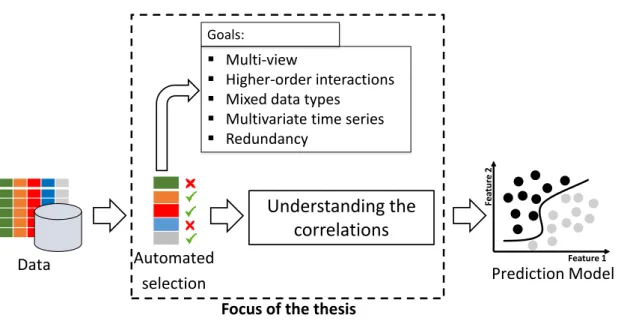
Feature selection involves evaluation of a large number of feature combinations. The complex statistical tests and large number of evaluations deter the user’s understanding of feature selection. Hence, the domain experts look at feature selection as a black-box technique [KRT+17]. Nevertheless, the domain experts perform the first and most important step of defining the analytical task in the KDD process (c.f. Figure 1.1) chain. Hence, it is necessary for the experts to understand the reason for a feature’s relevance to determine whether a correlation is merely a statistical coincidence or a general dependency that influences the target. For example, in automotive applications few features can exhibit high correlation to the target due to the measurement technique applied. That is, they are merely statistical coincidences that can happen due to the measurement system and is not founded by the physics of an automotive device. As a step towards enhancement of feature selection transparency, we aim to visualize all correlations in a dataset, i.e., feature-target relevance and feature-feature redundancy. Secondly, we aim to guide the user in understanding these multivariate correlations. In Figure 1.3 we illustrate a glimpse of all the goals that we will address in this work.
Data Automated
selection Prediction Model
Understanding the
correlations
Focus of the thesis Multi-view
Higher-order interactions Mixed data types
Multivariate time series Redundancy Goals: Feature 1 Fe atu re 2
Figure 1.3: Focus of the dissertation
1.3
Challenges
In Section 1.2, we discussed our goals such as multiple-views of data, higher-order interactions, mixed data types, multivariate time series feature extraction, redun-dancy and user understandable correlation analysis that we will address in this dissertation. However, in the process of achieving these goals, we are confronted with several challenges and in this section we briefly discuss them.
Challenge 1: Exponential Search Space
The estimation of multivariate correlations involve analyzing multiple feature sub-set combinations. For a datasub-set with 200 features, the number of possible feature subset combinations escalates to 2200. In real world applications, the dimension-ality can be much larger and analyzing the relevance of every possible combina-tion is computacombina-tionally inefficient. Tradicombina-tional approaches handle this problem by designing efficient search organization techniques [DV11, BALD14]. However, the challenge is not only exploring the exponential search space but also to infer maximum knowledge of the higher-order interactions while evaluating the subsets. Hence, it requires an ideal combination of a search organization and correlation inferring technique.
Challenge 2: Multi-view
Considering multiple views (subsets) of the high-dimensional feature space for the evaluation of correlations may enhance the prediction quality by capturing the interactions between different dimensions. Traditional selection algorithms [KJ97, MBN02, YL03, LMD+12] aim to select a single feature subset by evalu-ating the correlation based on a single statistical property. However, evaluevalu-ating multiple statistical properties in a dataset can enhance the prediction quality. Two major challenges exists in the process of selecting multiple views of a dataset. The first challenge is to select the views that are relevant for a given task. Secondly, multiple views that capture the same dependencies will not provide any novel in-formation for the prediction task. Hence, it is necessary to ensure that the multiple views are complementary to each other. Overall, it is still an open research ques-tion on how to exploit the heterogeneity of the feature dependencies in multiple feature subsets for improving the prediction quality.
Challenge 3: Higher-order interactions
In complex systems, an individual feature exhibiting higher-order interactions in-fluences the target differently when combined with different feature combinations [SBS+17, KRT+17]. In such cases, assigning a feature’s importance without eval-uating its higher-order interactions is misleading. Hence, it is necessary to assess the role of a feature by analyzing its interactions in multiple subsets. However, to include the higher-order interactions in high-dimensional datasets, it is not efficient to perform an exhaustive search [JBB15]. Traditional approaches [PLD05, Hal00] are based on pairwise correlation analysis and fails to capture interactions between more than two features. Thus, the challenge is to efficiently obtain a reasonable estimate of the feature relevance by evaluating its interactions in multiple subsets.
Challenge 4: Redundancy
In addition to estimating a feature’s correlation to the target, it is also neces-sary to evaluate its non-redundancy with respect to other features in a subset. This ensures that each feature is not only relevant but also provides new infor-mation for a classification or regression algorithm. Experimental and empirical analysis from several feature selection literatures prove that removal of redundant features enhance the speed and accuracy of classification and regression algorithms
[Hal00, KJ97, YL03, PLD05, DP05]. As redundancy does not only imply that two features are identical, the challenge is to quantify the magnitude of novelty that a feature contributes for the prediction task without actually training a prediction model.
Challenge 5: Mixed datasets
Modern datasets usually contain a mixture of continuous and categorical data [SBS+17]. Traditional approaches transform the dataset with mixed data types into homogeneous data type by discretization of the continuous features [Hal99]. Such transformation techniques avoid the necessity to treat each data type differ-ently. However, it leads to information loss and the effectiveness of the selected features is strongly influenced by the discretization method employed [JS02]. The other na¨ıve preprocessing step is to encode the categories with numerical values. Such encodings are not meaningful because the categories represent a qualitative property and assigning random numbers can be misleading, i.e., computing dis-tances between two differently coded categorical features versus the target can show different results [HLY08]. Hence, the major challenge is to perform multi-variate relevance and redundancy estimation of large datasets without the need for such additional preprocessing (i.e., discretization and encoding) techniques.
Challenge 6: Multivariate time series correlation
The transformation of time series into static features is a prevalent concept in the literature. However, several existing approaches [NAM01, M¨or03, WWW07, FJ14] do not address the multivariate nature of the time series. That is, by performing univariate transformations on multiple dimensions they fail to encode the multi-variate interactions of the time series into the resulting features. As explained in Section 1.2, in lengthy time series, it is only a subsequence that is informative for the prediction task. In a multivariate time series, by including the co-occurrences of subsequences from multiple dimensions, there exists an exponentially growing number of subsequence combinations to evaluate. However, not all of them are relevant for the target and non-redundant to the already selected subsequences. In such a scenario, traditional approaches perform unsupervised feature transfor-mation [NAM01, WSH06, WWW07, LKL12, Kat16] and may lead to generation of irrelevant and redundant features. Hence, the challenge lies in identifying the
relevance of time series subsequences by evaluating its multivariate nature and non-redundancy.
Challenge 7: Efficiency
Both feature selection and extraction involve analysis of an exponentially grow-ing number of feature subset or subsequence combinations. Upon this, several application domains incorporate new sensors and collect more data from exist-ing sensors [LP03]. This directly leads to increasexist-ing dimensionality and data-base size. Regardless of the increasing volume of data, it is necessary to perform the correlation analysis efficiently. For this reason several feature selection and extraction algorithms focus on the algorithmic efficiency in addition to quality [MBN02, Fle04, YL03, BPZL12]. The computational efficiency of the correlation function and the search organization technique together influence the runtime of the feature selection algorithms. Hence, the challenge is to compute the feature dependencies with efficient correlation functions and search space exploration tech-niques that are scalable.
Challenge 8: Understanding multivariate correlations
To inspect the results of a feature selection algorithm, it is necessary for domain-experts to understand the algorithm. Conventional selection algorithms [KJ97, MBN02, YL03, LMD+12, DP05, PLD05] provide only a set of highly correlated features and do not show a summary of all correlations in a high-dimensional data-set. Though a few approaches aid in the understanding of bivariate correlations, difficulty arises when trying to comprehend the dependencies between more than two features. Overall, the dimensionality and the complex dependencies in the data impair an expert’s understanding of the correlations. Hence, making multi-variate correlation analysis as a transparent process is still an unresolved problem. In high-dimensional datasets, there are both feature-to-target (i.e., relevance) and feature-to-feature dependencies (i.e., redundancy). For a dataset with hundreds of features, the major challenge is to visualize both the dependencies and explain the detected multivariate correlations to domain-experts.
1.4
Contributions
This dissertation presents four major contributions to address the goals described in Section 1.2.
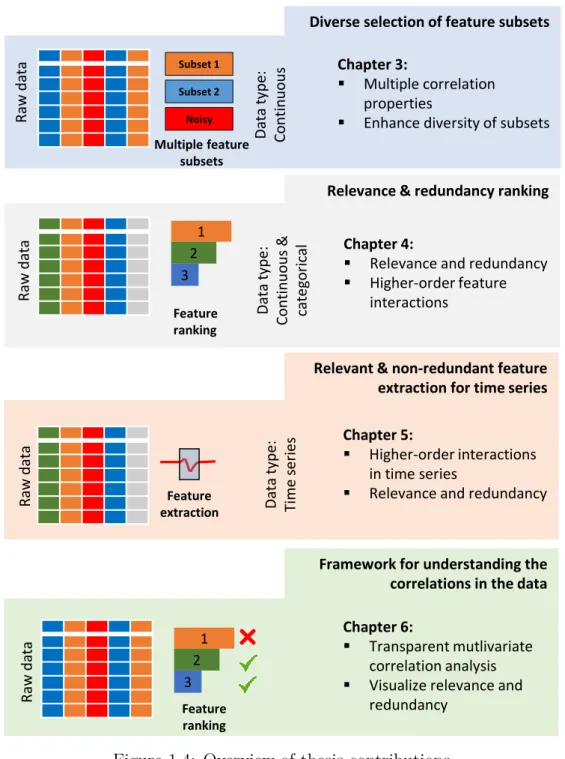
Diverse selection of feature subsets: In Chapter 3, we introduce a novel algorithmic framework to identify multiple diverse views of the high-dimensional feature space. Section 1.2 explains the necessity and Section 1.3 provides a glimpse of the challenges involved while capturing such views of datasets with features that are acquired from different sensor sources (c.f. Challenge 1 and 2). Our framework tackles these challenges using multiple correlation measures to evaluate different types of dependencies in the data. Additionally, based on a diversity criterion, we enhance the diversity of multiple views to ensure complementary information in each view. Conceptually, the proposed solution falls into the category of hybrid selection, i.e., a mix of filter and wrapper paradigms.
Relevance and redundancy ranking: In Chapter 4, we propose the first fea-ture ranking framework to compute a single score that quantifies the feafea-ture rel-evance by considering the higher-order interactions between features and redun-dancy in mixed datasets. In comparison to the previous contribution, which is limited to continuous features, we broaden the concept of multiple views to mixed datasets as well. In addition, to enhance the efficiency in comparison to the pre-vious contribution, we adhere to the filter-based paradigm for the feature ranking framework. We accomplish an efficient methodology of feature scoring by consid-ering the feature’s influence in multiple data views and novelty. Hence, the top ranked features are characterized by maximum relevance and non-redundancy (c.f. Challenge 1, 3 to 5 and 7).
Relevant and non-redundant feature extraction for time series: This dissertation tenders the first feature extraction framework that encodes the multi-variate nature of ordinality in the time series into static features. As a supervised approach, our extraction scheme in Chapter 5 concurrently extracts and evaluates the correlations, i.e., relevance and redundancy of the extracted feature. Hence,
Raw
da
ta Chapter 3:
Multiple correlation properties
Enhance diversity of subsets Subset 1 Subset 2 Noisy Raw da ta Chapter 4:
Relevance and redundancy Higher-order feature interactions Da ta type: Co nt in uo us Da ta type: Co nt in uo us & ca teg o ric al Feature ranking Raw da ta Chapter 5: Higher-order interactions in time series
Relevance and redundancy
Da ta type: Tim e ser ies Feature extraction
Diverse selection of feature subsets
Relevance & redundancy ranking
Relevant & non-redundant feature extraction for time series Multiple feature
subsets
Framework for understanding the correlations in the data
Raw da ta Chapter 6: Transparent mutlivariate correlation analysis Visualize relevance and
redundancy Feature ranking 1 2 3 1 2 3
Figure 1.4: Overview of thesis contributions
the extracted features are not only relevant but also hold novel information. Thus, we further augment the concept of higher-order interactions and redundancy to feature extraction in time series applications (c.f. Challenge 6). By performing the evaluations in linear time complexity, our relevance scoring function is efficient (c.f. Challenge 7).
Understanding the correlations in the data: In Chapter 6, this dissertation proposes an interactive software framework for exploring and understanding mul-tivariate correlations. With this framework we bolster our previous contributions by aiding the user to understand feature selection. The interactive framework aims to enhance the transparency of feature selection by presenting the complex corre-lation analysis calcucorre-lations in a user-understandable way. To gain novel insights into the data, we provide a summary of all correlations in the feature space. Ad-ditionally, using various statistical visualization techniques, we guide the user in comprehending multivariate correlations (c.f. Challenge 8).
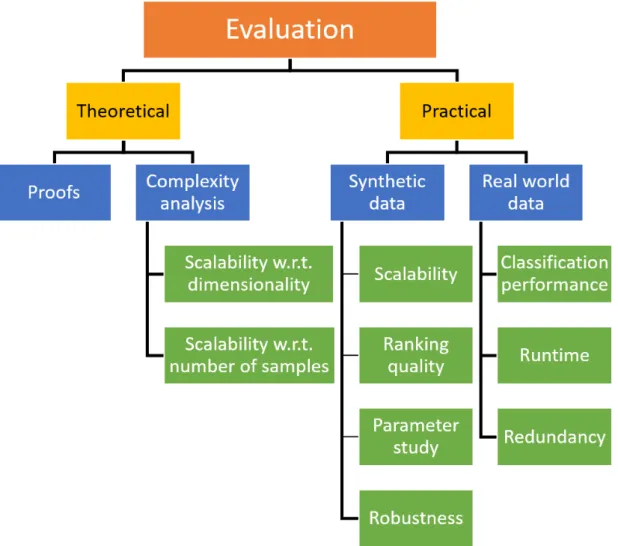
Figure 1.5: Evaluation strategy followed for all algorithmic contributions in this dissertation
In Figure 1.4, we summarize the major contributions of this dissertation. To emphasize the qualitative and quantitative improvements, our algorithmic
con-tributions are evaluated based on theoretical time complexity and practically on synthetic and real world datasets. Our contributions are substantiated with theo-retical proofs and foundations whenever necessary. Using synthetically generated datasets, we analyze the scalability, ranking quality, parameters and robustness of our approach. As we do not know the ground truth in real world datasets, we eval-uate the relevance and redundancy based on the classifier accuracy. In addition, we also tabulate the runtime our algorithms on real world dataset. All practical evaluation results are compared with a variety of state-of-the-art techniques from different paradigms. A consolidated overview of the evaluation strategy we follow in this dissertation is shown in Figure 1.5. To obtain finer details about each of the aforementioned contributions, it is necessary to revisit the preliminary concepts and the existing works on correlation analysis. Hence, in Chapter 2, we begin with the basic concepts that lay the foundation for multivariate correlation analysis. This also aims to ensure that the contents of the dissertation are self-contained. Furthermore, we also identify and discuss the novelty of our work with respect to the state-of-the-art approaches.
Fundamentals and literature
overview
2.1
Fundamentals
2.1.1
Feature selection
Transformation Step
Feature Selection Feature Extraction
Reduce dimensionality by selecting relevant features
Transform data by extracting relevant information
Correlation Analysis
Figure 2.1: The transformation step of the KDD process
Feature selection and feature extraction are the two crucial components of the transformation step in the KDD process (c.f. Figure 2.1). Performing data mining tasks on high-dimensional data hampers the quality and efficiency of the prediction task due to thecurse-of-dimensionality[Pow07, KMB12, Agg15]. As represented in Figure 2.2, with a growing number of dimensions, the prediction accuracy increases up to a maximum. Beyond this point, the accuracy of a prediction model declines due to the curse-of-dimensionality [JGDE08].
Figure 2.2: With increasing dimensionality of data, the prediction accuracy drops after a threshold number of features[JGDE08]
In other words, using a large number of features does not guarantee the best pre-diction accuracy. Consequently, feature selection is necessary to eliminate features that are non-contributing for a defined analytical problem. For better understand-ing, we explain the curse-of-dimensionality with a simple example [Spr14].
Example 2.1. Let us consider the task of classifying cars from trucks based on a three-dimensional feature space. Using a linear classifier, in Figure 2.3, we show that a single feature cannot perfectly classify all the cars from trucks.
Figure 2.3: Visual representation of the two classes, i.e., car and truck, over a single feature
Hence, we add an additional dimension (feature 2) in Figure 2.4. Addition of second dimension still does not allow for perfect classification of all samples in the data. However, by classifying 80% of the data correctly, it performs better than using a single feature.
Figure 2.4: Classification task with two features, where the red line denotes the classification boundary
To improve the classification accuracy further, we add a third dimension in Figure 2.5 and show a linear plane that perfectly separates all samples of trucks from cars. That is, a linear combination of features 1, 2 and 3 is able to classify all training samples without error. From the first look, it is alluring to conclude that addition of more features lead to better accuracy. However, this can be deceptive and we explain the underlying reason by computing the density of the data.
Figure 2.5: Classification task with 3 features, where the red plane denotes the classification boundary
In the one-dimensional case (c.f. Figure 2.3), ten samples are spread across an interval of 5 units of feature 1. Therefore, the density of samples per unit distance is 105 = 2 samples/unit. Analogously, the density of samples for the two and three-dimensional cases are 1052 = 0.4 samples/unit and 1053 = 0.08 samples/unit
respectively. From the above example, we show that density of samples reduces (i.e., data gets sparser) with increasing number of dimensions. Eventually, the task of identifying a separable plane on the sparse feature space is easier (see Figure 2.6, where the 3-dimensional feature space is projected onto a 2-dimensional feature space). Hence, the classification algorithm memorizes the training data and this problem directly leads to overfitting.
Figure 2.6: Projection of the three-dimensional feature space to two dimensions, where the red line denotes the classification boundary
Testing the over-fitted classification model on unseen real world data yields a poor prediction quality. This can also occur on using a complex non-linear classifier on a simple low-dimensional feature space. Hence, in Example 2.1, it is ideal to use a combination of feature 1 and 2 as it can generalize better for unseen real world data. A possible solution to resolve this problem is by identifying the relevance of each feature based on its potential to discriminate the two vehicle
categories, prior to training a prediction model. This process is called feature selection.
Quote: “Features are relevant if their values vary systematically with the tar-get” [GLF89]. −2 0 2 4 −0.03 −0.02 −0.01 0.00 0.01 0.02 Feature Target
(a) An irrrelevant feature
0 5 10 15 −3 0 3 6 Feature Target (b) A relevant feature
Figure 2.7: Correlation of the features to the target [KMB12]
Feature selection is an expedient step to select the relevant features prior to training supervised machine learning algorithms such as classification and regres-sion. Given a prediction target (e.g., cars and trucks in Example 2.1), an irrelevant feature corroborates no correlation with the target (c.f. Figure 2.7a) and distorts the accuracy of the prediction model [GE03]. On contrary, relevant features exhibit predictive relationships (correlation) with the target and improve the prediction quality (c.f. Figure 2.7b). In addition, a subset of relevant features can also be redundant among themselves and they do not provide any novel information for the data mining task [DP05, SBS+17]. This means, in addition to relevance, it is necessary to ensure that the information we provide to the data mining algorithm is complementary. A subset of novel and relevant features are those which poses high feature-target correlations and minimum feature-feature correlations [Hal99].
2.1.2
Feature extraction
The second elementary component of the transformation step is feature extraction. It is the task of extracting parts of relevant information from a time series. The
unique property of time series data is their adherence to inherent ordering with respect to time, i.e., the relevance estimation in time series data is to be done without distorting the order of the data. For example, Figure 1.2 (in Chapter 1) shows the Electrocardiography (ECG) time series data representing two classes [CKH+15]. Out of the entire series, only a subsequence (highlighted in black) is discriminative for distinguishing the two classes. The other parts of the time series (highlighted in red) exhibit similar behavior and cannot be used to discriminate the two series. In time series applications, such regions of interest are extracted and transformed into numerical features [NAM01, M¨or03, WWW07, FJ14]. The advantage of feature extraction is the possibility to provide a compact and infor-mative set of features for a given prediction task [GE06]. The extraction is often performed based on a transformation function that evaluates specific properties of the time series and encodes them into features. For example, frequency and am-plitude of the time series data are captured using Fast Fourier Transform (FFT) as a transformation function. That is, unlike feature selection, the feature extrac-tion applies transformaextrac-tions on the raw data to encode the informaextrac-tion from a region of interest into numerical features. However, similar to feature selection, it is necessary to evaluate the relevance and novelty of the transformed feature for the prediction.
From a high-dimensional dataset, feature selection identifies relevant and non-redundant features for the prediction model. On the other hand, feature extraction aims to extract relevant and non-redundant subsequences from the data and trans-form them into features. However, relevance and redundancy estimation in both feature selection and extraction is performed by evaluating the correlation between the features and the target. Hence, as depicted in Figure 2.1,both feature selection and extraction are established upon the concepts of correlation analysis.
2.1.3
Correlation Analysis
Correlation analysis is the task of evaluating the statistical dependency between a dependent and independent variables. A dependent variable is also denoted as a target and the task of correlation analysis aims to evaluate the influence of different independent features on a dependent feature. On the other hand, an independent variable is called a feature. Based on the number of features involved in the
analysis, it can be classified into bivariate or multivariate correlation analysis. Bivariate correlation analysis is limited to evaluation of relationship between a feature and the target. On contrary, the benefit of multivariate analysis is the possibility to analyze the influence of interactions between multiple features on a target. The choice of analysis can be made based on the type of data [Agg15]:
• Non-dependency-oriented data: Being the simplest form of data, the fea-tures in the non-dependency-oriented data do not exhibit any dependencies among themselves. Thus, it requires analysis of a single feature’s correlation to the target prediction or bivariate correlation analysis.
• Dependency-oriented data: In this case, multiple features in the dataset may have certain dependencies or interactions among themselves. Thus, it requires inclusion of these interactions for the target prediction, i.e., multi-variate correlation analysis.
Feature selection on high-dimensional dependency-oriented datasets involves evaluation of complex interactions between multiple features. That is, for dependency-oriented datasets, there can be several features that change simultaneously to in-fluence the target prediction. Including these interactions between the features for correlation analysis provide novel insights from the data. Such datasets are common in various application domains such as automotive [SBS+17], aerospace [RSA+18] and bio-informatics [DP05]. Hence, it is essential to estimate the cor-relation between a set of features and the target. This motivates the importance of using multivariate correlation analysis for the selection process. In this work we focus on the task of multivariate correlation analysis for feature selection and extraction.
Existence of correlation between two variables implies that the change in one variable influences the other as well (c.f. Figure 2.7b). Based on the nature of change, correlations can be classified as linear and non-linear. The correlation be-tween the feature and target in Figure 2.7b is an example of non-linear correlation. Real world applications are predominantly non-linear, hence we focus on non-linear correlations in this work.
2.1.4
Basic Notions
Feature selection: Feature selection and extraction demands correlation or dependency analysis between the features and a target. The term feature is used interchangeably with attribute, dimension and variable in various literatures [NAM01, GE03, RˇSK03, WSH06, KMB12, Qui14]. As discussed in Section 1.2, a dataset can have features with different data types. Hence, we begin with the formal definition of a feature and different data types in Definition 2.1.
Definition. 2.1: Feature
• A continuous feature f = (x1,· · ·, xN) | xi ∈ R of N samples is a
vector of real numbers with an infinite number of possible values.
• A categorical feature of N samples is a vector with a fixed number of possible categories C = {C1, ...,Cmax}. Each value in a
categori-cal feature f = (x1,· · ·, xN) | xi ∈ C denotes a category based on a
qualitative property.
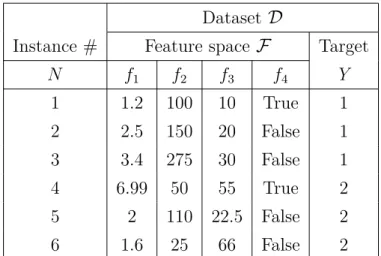
Dataset D
Instance # Feature space F Target
N f1 f2 f3 f4 Y 1 1.2 100 10 True 1 2 2.5 150 20 False 1 3 3.4 275 30 False 1 4 6.99 50 55 True 2 5 2 110 22.5 False 2 6 1.6 25 66 False 2
Table 2.1: Representation of a dataset with mixed data types, where,
FC ={f1,· · ·, f3} are continuous features and FN ={f4} is a categorical
feature
Given ad-dimensional feature space F ={f1,· · ·, fd} of N samples, a dataset
is a collection of the feature space and a target Y, i.e., D = {F, Y}. A feature space with mixed data types is defined by a set FC ⊆ F of continuous and set
of a dataset with mixed data types, i.e., continuous and categorical, and a discrete target, i.e., classification task. For a regression task, the target Y will be a column of continuous values.
As discussed in Chapter 1, the goal of feature selection is to eliminate features that are irrelevant for the target prediction by evaluating the magnitude of correla-tion between the features and the target. Quantifying the correlacorrela-tion is performed using a cost function that evaluates the feature-target dependency. We formally define the task of feature selection in Definition 2.2.
Definition. 2.2: Feature Selection Task
Given a dataset D such that it contains a feature frel ∈ D relevant to
the target Y and an irrelevant feature firr ∈ D. Based on the number of
features that a cost function can handle, it can be classified into bivariate and multivariate.
• A bivariate correlation measure corr : (f ∈ F) 7→ R computes the relevance of f such that, corr(frel) corr(firr).
• A multivariate correlation measure corr : (S ⊆F)7→R computes the relevance of a set of multiple features by including the higher-order interactions between them.
The task of feature selection aims to select a set of features that are relevant to the target such that corr(S |frel∈S)corr(S\frel).
Feature extraction: For a time series dataset, we aim to perform extraction of subsequences that are discriminative for the target prediction. In Definition 2.3, we formally define a univariate time series.
Definition. 2.3: Time Series
A time series X of length l is a collection of real numbers that are indexed based on time t={1,· · ·, l}, i.e., X = (x1,· · ·, xl)|xi ∈R.
As we aim to perform supervised correlation analysis on the time series data to identify relevant subsequences, each univariate time series X is provided with a target instance. For example, the univariate time series dataset in Figure 2.8a
(a) A univariate time series dataset of 3 time series samples
(b) A multivariate time series dataset of 3 time series samples and 3 dimensions
Figure 2.8: Time series dataset for a supervised feature extraction based on a discrete target Y
is a collection of three time series samples of length (l) 500 from healthy (Y = 1) and defective (Y = 2) sensors. That is, an entire series of length l is assigned a target value. Likewise, a multivariate time series sample is a collection of multiple univariate time series and each of them represents a dimension. This collection of univariate samples is assigned a target value. For example, Figure 2.8b shows a three-dimensional time series dataset with three samples and two classes.
Definition. 2.4: Feature Extraction Task
For a given time series X = (x1,· · ·, xl) |xi ∈ R indexed by t ={1,· · ·, l},
the task of feature extraction aims to extract one or more relevant subse-quence Xrel = (xa,· · ·, xb) | a 6= b, a < l and b > 1 for the prediction
of target Y. The subsequence is mapped to numeric features based on a defined property, i.e., T :Xrel 7→R.
Feature extraction aims to map the dynamic properties of the time series data-set into features based on a transformation function T (c.f. Definition 2.4). The transformation function defines the property of the series to encode in the feature. For example, skew:X 7→Rtransforms the time series Xinto a static feature that characterizes the degree of asymmetry of values around the mean value [NAM01].
2.2
Overview of feature selection literature
A feature selection algorithm should address the following points [Hal99]:
• Search organization: An exhaustive search in the high-dimensional feature space leads to high computation time. Hence, search strategies or heuristics that systematically traverse through the search space are applied. A search organization technique requires definition of a right starting point and a stopping criterion.
• Starting point: A feature selection algorithm should have a defined starting point in the search space to begin exploration and evaluation.
• Stopping criterion: The feature selection algorithm can be provided with a termination condition after which the search is stopped. For example, the user has an option to preset the maximum number of features to select and the algorithm stops further execution once this threshold is reached.
• Evaluation strategy: In order to judge if a feature is of any relevance for the target prediction, the algorithm needs a well defined quality evaluation criterion, i.e., the cost functioncorr(f) in Definition 2.2.
Search organization
Exponential Iterative Random
Random walk Genetic algorithm
Particle swarm optimization Harmony search Differential evolution SFS SBE SFFS Exhaustive search Branch-and-bound
Figure 2.9: Different search organization approaches for feature selection [JBB15]
2.2.1
Search organization
To identify multivariate correlations in a d-dimensional feature space, there are 2d
feature subset combinations to evaluate. A search organization technique facili-tates generation of the subset combinations to explore the search space. The gen-erated subset combinations are evaluated for relevance based on the cost function, i.e., corr in Definition 2.2. The search organization is classified into exponential, iterative and random search (c.f. Figure 2.9).
Exponential
The exponential search technique such as exhaustive search generates all possible subset combinations for evaluation. In Figure 2.10, we show the search space for a dataset of four features and the 15 (excluding the null set) different feature combi-nations. For high-dimensional datasets (e.g., 100 features), exhaustive evaluation of all feature combinations (i.e., 2100−1) is highly time consuming and not pre-ferred. However, exhaustive search can achieve high accuracy in comparison to the other strategies and is preferable for dataset with low dimensionality (e.g., d≤20 features).

![Figure 2.9: Different search organization approaches for feature selection [JBB15]](https://thumb-us.123doks.com/thumbv2/123dok_us/9013588.2799196/55.892.163.723.156.387/figure-different-search-organization-approaches-feature-selection-jbb.webp)