Theses, Dissertations, and Student Research in
Agronomy and Horticulture Agronomy and Horticulture Department
Spring 5-20-2016
Identification of QTLs for Resistance Against
Rhizoctonia solani
and
Phoma glycinicola
in Soybeans
(
Glycine max
L. Merr)
Herbert Sserunkuma University of Nebraska-Lincoln
Follow this and additional works at:http://digitalcommons.unl.edu/agronhortdiss
Part of theGenetics Commons,Molecular Genetics Commons, and theOther Genetics and Genomics Commons
This Article is brought to you for free and open access by the Agronomy and Horticulture Department at DigitalCommons@University of Nebraska -Lincoln. It has been accepted for inclusion in Theses, Dissertations, and Student Research in Agronomy and Horticulture by an authorized administrator of DigitalCommons@University of Nebraska - Lincoln.
Sserunkuma, Herbert, "Identification of QTLs for Resistance AgainstRhizoctonia solaniandPhoma glycinicolain Soybeans (Glycine maxL. Merr)" (2016).Theses, Dissertations, and Student Research in Agronomy and Horticulture. 103.
IDENTIFICATION OF QTLS FOR RESISTANCE AGAINST RHIZOCTONIA
SOLANI AND PHOMA GLYCINICOLA IN SOYBEANS (GLYCINE MAX L.
MERR)
By
Herbert Sserunkuma
A THESIS
Presented to the Faculty of
The Graduate College at the University of Nebraska
In Partial Fulfillment of Requirements
For the Degree of Master of Science
Major: Agronomy
Under the Supervision of Professor George L. Graef
Lincoln, Nebraska
IDENTIFICATION OF QTLS FOR RESISTANCE AGAINST RHIZOCTONIA
SOLANI AND PHOMA GLYCINICOLA IN SOYBEANS (GLYCINE MAX L.
MERR)
Herbert Sserunkuma, M.S.
University of Nebraska, 2016
Advisor: George L. Graef
A QTL (Quantitative trait locus) is a chromosome location of a gene controlling a specific phenotypic trait. The trait maybe governed by multiple genes. Fungal pathogens are responsible for over 50% of all soybean diseases. Rhizoctonia
solani Kühn causes seedling dumping off, root and hypocotyl rots and other
disease in soybeans. Phoma glycinicola de Gruyter & Boerema causes Red leaf blotch disease, predominantly in Sub-Saharan Africa. There is no reported complete resistance against these fungal pathogens in soybeans. Reaction to
R.solani is reportedly a quantitative trait controlled by major and minor genes. Three QTLs contributing to reaction to R. solani were reported in a study using SSR markers on chr 6 (Satt 177), chr 6 (Satt 281) and chr 7(Satt 245) that explained 7%, 11% and 6.8% respectively. The objective of this study was to identify QTLs that control reaction to R. solani and P. glycinicola using RIL populations genotyped with the 1,536 GoldenGate SNP assay and also identify similarity and co-localization in QTL regions controlling resistance to other fungal pathogens. The RIL populations in this study were used to map QTL for
resistance to Sclerotinia sclerotiorum (Lib.) de Bary. Two RIL populations UX990 (Williams 82 X DSR 173) and UX988 (Williams 82 X Corsoy 79) segregating for the traits were evaluated. Data for the UX990 population was used for QTL analysis. This population had 90 lines and 350 polymorphic SNP markers covering about 1917.2 cM of the 3000 cM according to Hyten et al.
(2010). A significant QTL was identified on Chr 10 (LG-O) that explained 43.1% of the variation in the response to R. solani and was located in the same region as QTLs reported for reaction to two other fungal pathogens, Sclerotinia
sclerotiorum and Phytophthora spp. Analysis of P. glycinicola data identified a significant major effect QTL on Chr 2 at 32.4 cM and a minor effect QTL on Chr 15 at position 97.3cM. These regions also contain QTL regions contributing to reactions to fungal pathogens Sclerotinia sclerotiorum, Phytophthora sojae and
Acknowledgments
I would like to extend my gratitude to my advisor Dr. George Graef for the remarkable opportunity to study, learn and work under his guidance, supervision and tutelage. He has been an incredible mentor and am proud of the time I spent under his guidance. I also extend my thanks to the members of my graduate committee, Dr. Loren Giesler, Dr. Jim Steadman, and Dr. Phinehas
Tukamuhabwa for all of their guidance and contribution towards my research and project. This thesis research would not have been possible without their
assistance, support and encouragement.
A notable thank you to my fellow graduate students and friends Amritpal Singh who helped me a lot especially during the data analysis, Joey Jedlicka, Kyle Kocak, Diego Juaquin, Leah Ruff, Samantha McConaughy, Jorge Perez and Michael Greene, I have learned so much from all of you and it has been an honor to work beside you. You were always available to offer assistance and advice whenever I needed it. Also gratitude to everyone in the Stewart Seeds Lab, you were great to work with and taught me a lot as well especially Eric, Les, Justin, Mason, Aaron, Becky and all the undergrads. Thanks also to those in the Steadman pathology lab that helped and guided during many hours in the lab, Becky, Serena, Rachana, I appreciate all your help. I am also tremendously grateful to Dr. Stephen Opiyo at Ohio state university for the encouragement, inspiration, motivation and all the various support during this period, Thank you very much.
Finally, I would like to thank my family for all of their love and support throughout my education. Thank you to my parents, Magdalene Nayiga Kiwuuwa and Lameck Kamya Kiwuuwa, who have always supported me and inspired me to achieve greatness and deserve credit for where I am and everything I have achieved. To my brothers Brian and Humphrey and sister Racheal, Thank you too for all you have done for me and wish you success and prosperity in your lives and endeavors. My Friends Joseph Sevume, Brian Sengendo, Bill and Sherry Wright, Thank you all for being dependable and always being there for me.
Grant and Support
This material is based upon work supported by the United States Agency for International Development , as part of the Feed the Future Initiative, under the CGIAR Fund, award number BFS-G-11-00002, and the predecessor fund the Food Security and Crisis Mitigation II grant, award number EEM-G-00-04-00013.
I also recognize and appreciate The University of Nebraska-Lincoln Soybean Breeding and genetics program contribution and support towards this work, my training and education. Funding from the Nebraska Soybean Board provided to Dr. George Graef for support of the soybean breeding program supported part of this work. Also, support from USDA NIFA through Dr. James Steadman at the Plant Pathology department of the Agronomy and Horticulture College of the University of Nebraska- Lincoln contributed to this research.
Table of Contents
Acknowledgments... iv
Grant and Support ... vi
List of abbreviations ... viii
List of Tables ...ix
List of figures ... xii
Introduction ... 1
Literature Review ... 6
Materials and Methods ... 20
Results ... 32
Discussion and Conclusion ... 38
Tables and figures ... 43
REFERENCES ... 80
Appendix ... 90
List of abbreviations
Chr–chromosome
C.I. – confidence interval
CIM-Composite interval mapping cM– centiMorgans
Chr- chromosome
DAP- Days after planting DNA– deoxyribonucleic acid
EM–expectation maximization algorithm LOD– logarithm of odds
LG– linkage group
MAS– marker-assisted selection MR– marker regression
PDA- Potato Dextrose Agar
QTL or QTLs– quantitative trait locus or loci RCBD- Randomized complete block design RLB- Red leaf blotch
RIL or RILs– recombinant inbred line or lines SIM- Simple interval mapping
SNP– single nucleotide polymorphism SSR– simple sequence repeat
USDA- United States Department of Agriculture USLP– universal soy linkage panel
List of Tables
Table 1: Least Square means of Rhizoctonia solani disease score of eight parent lines grown in 10 replications of a Randomized Complete Block Design at University of
Nebraska greenhouse in 2014 ...43 Table 2: Analysis of variance for the dependent variable Rhizoctonia solani disease score for eight parent lines soybean grown in 10 replications of a randomized complete block design at University of Nebraska-Lincoln greenhouse in 2014. ...44 Table 3: Pairwise comparisons of LS means of the eight parent lines grown in 10
replications of a randomized compete block design at University of Nebraska greenhouse in 2014. The experimental units were inoculated with Rhizoctonia solani. ...45 Table 4: Analysis of variance of the DSR 173 population Lines. The experimental units were inoculated with Rhizoctonia solani. ...46 Table 5: Average score for the Rhizoctonia disease score phenotype of the UX990 DSR 173 population grown at the University of Nebraska-Lincoln green house in 2015 ...47 Table 6: Average Red leaf blotch disease scores of the Nebraska parent lines and Uganda local cultivars grown in 4 replications of a randomized complete block design at
Namulonge, Uganda in 2015 on date 2 (61 DAP) of evaluation. ...50 Table 7: Analysis of Variance of Red leaf blotch disease scores of the Nebraska parent lines and Uganda local cultivars grown in 4 replications of a randomized complete block design at Namulonge, Uganda in 2015 on date 2 (61 DAP) of evaluation. ...51 Table 8: Average Red leaf blotch disease scores of the Nebraska parent lines and Uganda local cultivars grown in 4 replications of a randomized complete block design at
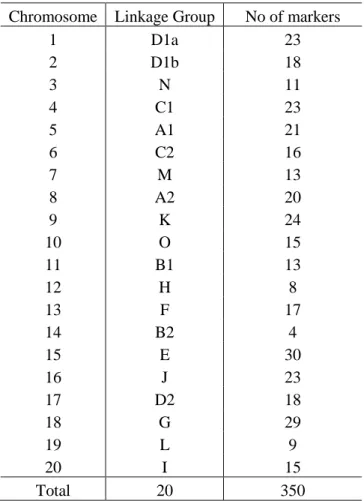
Table 9: Analysis of Variance of Red leaf blotch disease scores of the Nebraska parent lines and Uganda local cultivars grown in 4 replications of a randomized complete block design at Namulonge, Uganda in 2015 on date 3 (71 DAP) of evaluation for rea ...52 Table 10: Analysis of Variance of Red leaf blotch disease scores of the DSR 173 RILs grown in 4 replications of a randomized complete block design at Namulonge, Uganda in 2015 on date 2 (61 DAP) of evaluation for reaction to Red leaf blotch disease. ...53 Table 11: Average disease rating score of Red leaf blotch for DRS 173 RILs grown in 4 replications of a randomized complete block design at Namulonge, Uganda in 2015 on date 2 (61 DAP) ...54 Table 12: Analysis of Variance of Red leaf blotch disease scores of the DSR 173 RILs grown in 4 replications of a randomized complete block design at Namulonge, Uganda in 2015 on date 3 (71 DAP) of evaluation for reaction to Red leaf blotch disease. ...57 Table 13: Average disease rating score of Red leaf blotch for DRS 173 RILs grown in 4 replications of a randomized complete block design at Namulonge, Uganda in 2015 on date 3 (71 DAP) ...58 Table 14: Summary of number of polymorphic markers on chromosomes or linkage groups based on the genetic map by Hyten et al. (2010) of the 1536 SNP markers in the Williams 82 X DSR 173 (UX990) population. ...61 Table 15: Fit QTL summary: Multiple imputation method for the QTL on Chr 10 for the reaction to R. solani in the DSR 173 population. ...62 Table 16: Estimated effects of the QTL on chromosome 10 in the soybean RIL
Table 17: Fit QTL summary: Multiple imputation method for the QTL on Chr 2 for the reaction to Phoma glycinicola in the DSR 173 population. ...63 Table 18: Average score for the Rhizoctonia disease score phenotype of the DSR 173 population grown at the University of Nebraska-Lincoln green house in 2015 ...64
List of figures
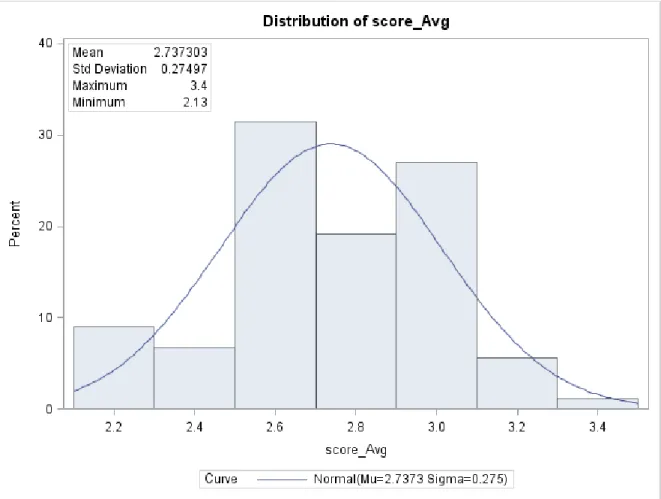
Figure 1: Distribution of the average disease score of the RIL lines in the DSR173
(UX990) population of soybeans inoculated with Rhizoctonia solani in the greenhouses at the University of Nebraska in 2015 ...67 Figure 2: Distribution of Average Red leaf blotch disease scores of the DSR 173 RILs in 4 replications of a randomized complete block design at Namulonge, Uganda in 2015 on date 2 (61 DAP) of evaluation ...68 Figure 3: Distribution of Average Red leaf blotch disease scores of the DSR 173 RILs in 4 replications of a randomized complete block design at Namulonge, Uganda in 2015 on date 3 (71 DAP) of evaluation. ...69 Figure 4: Distribution of Average Red leaf blotch disease scores of the DSR 173 RILs in 4 replications of a randomized complete block design at Namulonge, Uganda in 2015 across scoring dates at 61 and 71 DAP. ...70 Figure 5: Map positions of the 1536 SNP markers for the Soybean Genetic Map for the Universal Soy Linkage Panel 1.0 (Hyten et al.., 2010)...71 Figure 6: The SNP markers genetic map constructed from the 350 polymorphic markers from the 1536 SNP chip GoldenGate assay in the DSR 173 population ...72 Figure 7: Genome-wide LOD score threshold scans showing threshold score of 3
generated by running 1000 permutations in R/qtl for the DSR 173 RIL population
genotyped with the 1536 SNP chip. ...73 Figure 8: Genome-wide LOD score scans generated with Haley-Knott regression method showing threshold LOD score in R/qtl for the disease score of reaction to Rhizoctonia Solani phenotype of the DSR 173 population...74
Figure 9: Genome-wide LOD score scans of Composite interval mapping using Haley-Knott regression method showing significant LOD score of QTL on chromosome 10 for disease score of reaction to Rhizoctonia Solani phenotype of DSR173 (UX990)
population. ...75 Figure 10: Genome-wide LOD score scans of Composite interval mapping using Haley-Knott regression method showing no additional QTL after refining positions for reaction to R. solani ...76 Figure 11: Genome-wide LOD score scans of Composite interval mapping peak LOD on chromosome 5 at position 15cM for disease score of reaction to Red leaf blotch
phenotype of DSR173 (UX990) population. ...77 Figure 12: Genome-wide LOD score scans of Composite interval mapping significant LOD score of QTL on chromosome 2 for disease score of reaction to Phoma glycinicola phenotype of DSR173 (UX990) population at 71 DAP (left) and Average score
(Right). ...78 Figure 13: Genome-wide LOD score scans of Composite interval mapping showing significant QTL and LOD score of QTL on chromosome 2 for disease score of reaction to Phoma glycinicola phenotype of DSR173 (UX990) population at 71 DAP. ...79
CHAPTER 1: INTRODUCTION
Soybeans [Glycine max (L.) Merr] is one of the most valuable crops in the world (Masuda and Goldsmith, 2009). Soybeans are grown on approximately 6% of the world’s arable land and the area under soybean production has the highest percentage increase since 1970s compared to other major crops (Hartman et al., 2011). It is grown for its seed oil and protein as well as a variety of other uses including human consumption. Major soybean producing countries include United States, Argentina, Brazil, China and India. Soybean can be utilized as an oil crop, seed crop and feed for livestock and aquaculture, but also as a good source of protein for the human diet and as a biofuel feedstock (Masuda and Goldsmith, 2009). The crop was first domesticated in the Eastern part of China around the 11 century B.C. and production was localized in China until 1894 to1895 when the Chinese-Japanese war led to the Japanese importation of soybean oil cake for fertilizer (Hymowitz et al. 1990). Hymowitz et al. (1990) also reports that the crop was first introduced in the American colonies in 1765. The acreage of soybeans grew gradually, especially during the 1920’s when its production increased in the Corn Belt.
According to the USDA, US soybean production has risen from 1.9 billion bushels (33.3 bushels per acre) in 1986 to 3.2 billion bushels (43.3 bushels per acre) in 2013 with 2009 recording nearly 3.4 billion bushels, a record 44 bushels per acre (http://www.nass.usda.gov. USDA crop production summary, 2015, American Soybean Association, 2015)
Soybean diseases are among the largest constraints to soybean production, and fungal diseases are of particular importance. Seedling diseases including
Rhizoctonia root rot, stem rot and damping off were ranked among the six most
important diseases affecting soybean yields in the US from 1996 to 2007 (Wrather and Koenning, 2009; Frohning, 2013).
Rhizoctonia solani Kühn (teleomorph Thanatephorus cucumeris) is a soil borne fungal pathogen that causes seedling dumping off, root rots and hypocotyl rots in soybeans (Grau et al. 2004) and other important food crops like cotton ( Howell and Stipanovic, 1995), beans (Godoy-Lutz et al. 2008), Lettuce (Grosch
et al. 2005), tomato (Asaka and Shada, 1996), potato (Grosch et al. 2005). The fungus is soil borne and survives in the soil as sclerotia which are overwintering fungal structures. These are capable of surviving in the soil for many years and germinate when the conditions for fungal growth become conducive. Warm, moist sandy soils provide the most favorable conditions for pathogen growth and reproduction (Agrios, 2005). Soil conditions, especially temperature, become conducive at 10 to 30oC, the sclerotia develop into fungal mycelia and hyphae (Agrios, 2005). The fungus is saprophytic and survives on dead tissue in the soil until opportunity to colonize new tissue arises. The mycelia continue to grow if optimal temperatures ranging around 18 oC to 28 oC persist, until they get attracted to plant tissue. They develop infection cushions with penetration pegs and colonize plant tissue. The fungus keeps growing within the plant tissues, intracellular mycelial development is preceded by growth in the endodermis and causes disease in susceptible host (Van Etten et al., 1967). Dead plant tissue falls
to the ground and the fungus form sclerotia which will be the source of inoculum for the next infection cycle. The fungus also manifests as lesions on roots,
hypocotyls, stems, young cotyledons and other plant parts. These lesions present as reddish to brown in color on the roots, hypocotyl and stems just above the soil line. The lesions may become sunken and create depression in the roots and hypocotyl and eventually kill the plant especially at an early development stage or young plants. Some infected plants will appear stunted and the stand will look uneven. Root rots affect nodulation and later in the season, infected older plants will snap at the base and break. The pathogen also presents foliar symptoms like yellowing and wilting and lesions can be seen on cotyledons as the seedling emerges after germination. Plants can also be affected late in development and will appear light green in color with decayed poor lateral roots (Yang,
1999).Other stresses like pest injury, herbicide injury, hailstorms and nematode feeding, among others can facilitate the development and infection of plants by the pathogen causing disease (Grau et al. 2004).
Wrather and Koenning (2009) confer that management of the pathogen is achieved in various ways in the different cropping systems around the world, especially since the pathogen is widely distributed and has been reported in all soybean growing regions in the world. Crop rotations and tillage provide some, albeit limited control since the sclerotia persist in the soil for many years.
Removal of plant debris after harvest to avoid sclerotia or mycelia overwintering in the soil has been recommended and employed. Planting seeds at shallow depths to limit exposure to inoculum as well as encourage fast emergence of plants has
offered some management against the pathogen. It is recommended to plant tolerant cultivars if available and also to use fungicide applications and seed dressing to offer some protection to seed against rots and infection. Seed treatments have been noted to protect against stand losses. Soil management to maintain good drainage, aeration and water infiltration also offer some mitigation against the pathogen and its effects. Some degree of management is required to ensure good stand counts and avoid stunting all of which affect yields (Wrather and Koenning, 2009).
Red leaf blotch is a foliar disease of soybeans caused by the fungus
Phoma glycinicola (Gruyter and Boerema 2002). The disease is also known as
Pyrenochaeta leaf spot, Dactuliophora leaf spot or Pyrenochaeta leaf blotch. It has also been reported on wild perennial soybeans Neonotonia wightii. The disease was first characterized and reported in Africa by Stewart (Stewart, 1957) and is found in parts of central and southern African countries including Uganda,
Cameroon, DRC, Zimbabwe, Zambia, Ethiopia, Malawi, Rwanda. Presence of the pathogen in mycological leaf collections in Bolivia (Hartman et al. 1987) is the only incident reported outside of Africa. Yield losses of 10 to 50% have been attributed to this fungal disease which manifests as lesions on leaves associated with the primary leaf veins, petioles, pods and stems.
The fungus produces pycnidia and can be cultured on normal growth media like water agar and Potato Dextrose Agar (PDA) (Hartman et al. 1987). The red leaf blotch disease is frequent in fields previously under soybean crop. It over winters in the soil for years through over wintering structures called
sclerotia, which have the capacity to germinate and produce pycnidia or
secondary sclerotia to cause infection of new hosts (Hartman and Sinclair, 1996). The fungus is not known to be seed borne or wind transmitted (Hartman et al. 1987). Transmission from infected field maybe due to soil movement from that field to a new field.
CHAPTER 2: LITERATURE REVIEW
Diseases caused by fungal pathogens account for approximately 50% of all soybean diseases and crop loses around the world (Wrather et al. 2001, 2003; Wrather and Koenning 2006). Most of these fungal pathogens and diseases, especially the soil borne kind, are recalcitrant to fungicide control (Wang et al. 2010). Control and management is therefore heavily reliant on cultural practices and genetic resistance in the cultivars. This has led to a steadfast increase in interest in breeding for quantitative or multigenic resistance and the use of
molecular genetic markers to tag quantitative resistance genes related to resistance towards R. solani (Wang et al. 2010). To facilitate breeding of resistant cultivars, it is important to understand the genetics of resistance in soybeans (Zhao et al. 2005). Quantitative Trait Loci, resistance genes and markers associated with resistance in soybeans to many fungal pathogens like Sclerotinia sclerotiorum
(Arahana et al., 2001), brown stem rot caused by Phialophora gregata (Bachman
et al., 2001), sudden death syndrome, caused by Fusarium solani (Austeclinio et al., 2006), Phytophthola sojae (Burnham et al. 2003), and Phakopsora pachyrhizi
(Danielle et al. 2008) among others have been reported. Wang et al. (2010) report at least 107 QTLs of fungal resistance in soybeans have been identified and mapped. Zhao et al. 2005 have reported three SSR markers associated with reaction to Rhizoctonia solani in an F2 and F4:5 RIL population of soybeans.
Rhizoctonia solani
Rhizoctonia solani Kühn (teleomorph: Thanatephorus cucumeris (Frank)
Donk) causes Rhizoctonia root and hypocotyl rot on soybeans (Bradley et al. 2001). Rhizoctonia solani was first characterized in Germany by Julius Kühn in 1858 on potato tubers (Kühn 1858). The fungus is a basidiomycete whose sexual stage occurs as the teleomorph Thanatephorus cucumeris (Frank) Donk.
Rhizoctonia root and hypocotyl rot disease is common in soybean in the North Central United States (Doupnik, 1993). The disease is a brooding problem to soybean production in the United States and the world over. It is ranked fourth among causes of yield loss in the United States and is responsible for an estimated worldwide yield losses of over 108,000 metric tons (Wrather et al. 1997).
Seedling diseases which include the diseases caused by Rhizoctonia solani are among the top six diseases responsible for yield and production losses in soybeans from 1996 to 2007 (Wrather and Koenning, 2009)
The pathogen R. solani is prevalent and commonly spread in nearly all soils of the world, reportedly, 27% of the fungal taxa isolated from soybean seedlings in Iowa in 1993 and 1994 was R. solani (Rizvi and Yang.1996).
Rhizoctonia solani has a broad host range and attacks fruit, vegetable, and field crops like cotton (Gossypium hirsutum L.; Howell and Stipanovic 1995, Brown and McCarter 1976), beans (Phaseolus vulgaris L.; Godoy-Lutz et al. 2008), canola (Brassica campestris L.; Yitbarek et al. 1987), wheat (Triticum aestivum
L.; Wiseman et al. 1995), beet (Beta vulgaris L.; Carling et al. 1987), potato (Solanum tuberosum L. subsp. tuberosum; Grosch et al. 2005, Escande and
Echandi 1991), rosemary (Rosemarinus officinalis L.; Conway, et al. 1997), Lettuce (Lactuca sativa L.; Grosch et al. 2005), tomato (Solanum lycopersicum
L.; Asaka and Shada, 1996) and many turf grass species (Blazier and Conway, 2004).
Overwintering on decaying material and in soil is a characteristic that
Rhizoctonia solani has in common with Sclerotinia sclerotiorum (Lib.) de Bary,
the fungal pathogen that causes Sclerotinia stem rot in soybeans (Arahana et al. 2001) and Phoma glycinicola, the fungal pathogen that causes Red Leaf Blotch in soybeans (Hartman and Sinclair, 1996).
The occurrence and effect of R. solani on soybeans is influenced by the environment and variation in the pathogen (Grau et al. 2004). Activity of
Rhizoctonia solani is usually confined to the upper 10 cm of the soil and may not
have the capacity to colonize soil depths greater than 20 to 25 cm. (Papavizaz et al. 1975). R. solani affects soybeans at any stage of development; the young seedlings suffer the most severe effects of infection and are often attacked before the first trifoliolate leaf develops. The disease can cause early stand losses and premature yellowing (Dorrance and Mills 2010). Considerable yield loses have been attributed to this pathogen, loses of up to 80% have been reported in Brazil (Yang, 1999) and reports of as high as 48% loses in Iowa (Tachibana et al. 1971). Higher loses are experienced when numerous plants throughout the field are infected as compared to a few scattered diseased plants spread across the field (Grau et al. 2004). R. solani causes both pre-emergence and post-emergence symptoms. Pre-emergence symptoms of seed decay, seedling death and cotyledon
rots may not be evident in the field or may be present as gaps in the field in cases where the effects are very severe. Plants infected with this pathogen develop reddish-brown lesions on the hypocotyls at or near the soil line. Root rots develop later as the plant matures from the vegetative stages to the reproductive stages. The infected plants are stunted in growth and may develop chlorotic foliage. Plants that withstand seedling infection exhibit the characteristic symptoms of sunken reddish-brown cankers on the lower stems near the soil surface (Dorrance and Mills, 2010). Symptoms of infection may also include wilts, especially if weather conditions are hot. Optimal levels of soil moisture may mask the symptoms of infection and as such, shallow rooted plants are most adversely affected (Grau et al. 2004). Dorrance and Mills (2010) point out the difficulty in identifying pathogens responsible for pre-emergence dumping off as great similarities in symptoms of Rhizoctonia spp occur with Pythium spp and
Phytophthora spp.
Rhiozoctonia spp are readily isolated from infested soils and diseased
plants. Isolates of R. solani differ in morphology and pathogenicity as well as in cultural and physiological characteristics (Ogoshi 1987). Isolates of R. solani are grouped into 12 sub specific groups, anastomosis groups (AGs) based on
anastomosis behavior of the various individual isolates (Carling and Kuninaga, 1990, Ogoshi 1987, Parmeter et al. 1969). Isolates in each AG group are associated with different symptoms if incident on a specific hosts (Anderson, 1982). Hyphae of closely related isolates have the capacity to anastomose unlike those of unrelated isolates (Carling and Kuninaga, 1990). Anastomosis of R.
solani hyphae involves fusion of walls and membranes, but according to Carling and Kuninaga (1990), an intermediate form of anastomosis where the hyphae walls and possibly membranes connect but do not fuse is a possibility. Mostly, isolates that cause root rot of soybean are in AG-4, although some isolates within AG-2-2, AG- 5, and AG-7 are capable of causing root rot of soybean (Grau et al. 2004, Zhao et al. 2005). Isolates of Rhizoctonia solani characteristically have brown pigmentation of the hyphae and young hyphae possess multinucleate cells (Parmeter and Whitney, 1970). Young vegetative hyphae branch near the distal septum of the cells, have a dolipore septum. Other characteristics include right angled hyphae branching, septum formation near points of hyphal origin (Blazier and Conway, 2004), Blazier and Conway (2004) also report the optimum growth temperatures for R. solani isolates is 20°C to 30°C according to Agrios (2005)
The disease cycle
The disease cycle begins with the overwintering structures, sclerotia, found in the soil or on plant tissue. Optimum conditions of temperature and humidity stimulate growth of fungal hyphae. Chemical stimuli produced by growing plants attracts the fungi and infection is achieved by penetration of the plant by hyphae. Hyphae attach to the plant and produce a structure called an appressorium which penetrates through natural plant openings (Agrios, 1997). The fungus may also release enzymes that breakdown plant cell structures and thus colonize the plant (Agrios, 1997). Hyphae continue to grow in the
intracellular regions continuing to move into the endodermis (Van Etten et al. 1967). Any means that transport infected soil will spread the pathogen, these
include rain water, flood or irrigation water, infected plant material, tools and equipment. Agrios (1997) also reports the disease being more severe in moderately wet soils as compared to either water logged soils or dry soils.
Control of R. solani
Control of R. solani involves use of various combinations of cultural, biological and chemical methods such as seed treatments, fungicides, soil amendments, micro floral antagonism. No single treatment offers sufficient control of R. solani (Henis et al. 1978). Fungicide application has been employed with some success in many crops like radish (Henis et al. 1978), rye grass (Gross
et al. 1998), tomato and turf grass. Some fungicides used include PCNB
(Pentachloronitrobenzene), Chlorothalonil (2,4,5,6-tetrachloroisophthalonitrile),
Aracur 72.2% SL (Propamocarb Hydrochloride), Hymexate 30% (Hymexazol) ,Monceren 25% WP (pencycuron), Moncut 25% WP (Flutolanil), Tachigaren 30% SL (Hymexazol) and Topsin M 70% WP (Thiophanate Methyl). Seed treatment with chemicals like Maxim 4 SF, active ingredient fludioxonil, have also been used to control this pathogen.
Crop rotations with non-susceptible crops have also been employed to control the pathogen, by reducing the amount of inoculum available in the soil. Cultural manipulations like shallow planting so seedlings emerge faster, delayed planting to take advantage of warmer soil temperatures, use of clean seed material free from pathogens, appropriate crop spacing to prevent high humidity micro climates, removal of plant residues to minimize accumulation of inoculum, have been used in mitigating effects of R. solani. Mechanisms that improve soil
drainage and also enhance water infiltration, aeration as well as avoid soil compaction also make a contribution in the management of R. solani diseases. The use of resistant cultivars is also recommended as a management practice against R. solani disease. There are no commercial cultivars marketed as resistant
to Rhizoctonia solani and few reports have been published on evaluation of
soybean resistance to R. solani (Bradley et al. 2001). In an evaluation of 90 ancestral lines and 700 commercial soybean cultivars, only 20 commercial cultivars and 21 ancestral lines exhibited partial resistance to R. solani with no evidence of complete resistance (Bradley et al. 2001). This study was conducted under greenhouse conditions.
Biological control measures have been explored in the control of R. solani. Organisms like Bacillus pumilusSQR-N43 (Huang et al. 2011), Trichoderma harizianum (Karima et al. 2012, Henis et al. 1978) Trichoderma viride, Bacillus subtilis and Phytophthora fluorescens, (Karima et al. 2012) and many fungi and bacteria (Lahlali et al. 2007) have been observed to have an impact on R. solani.
Phoma glycinicola (Red leaf blotch)
Red Leaf Blotch of soybeans is caused by the fungal pathogen Phoma glycinicola (Gruyter & Boerema 2002) previously called Dactuliochaeta glycines (Hartman G.L. & Sinclair J.B., 1988), Dactuliophora glycines (Leaky, 1964), Pyrenochaeta glycines (Stewart, 1957). The pathogen is soil borne and produces sclerotia in infected tissue which over winter in the soil and have the ability to germinate producing inoculum through pycnidia or secondary sclerotia (Harman and Sinclair 1996).
The symptoms of red leaf blotch caused by the fungus P. glycinicola are lesions on leaves, petioles, pods and stems of the infected plants. The lesions are initially dark red to brown in color, circular to angular in shape, 1 to 3 mm in diameter (Hartman et al. 1987). Dark red spots develop on the upper surface and reddish brown spots develop on the lower surface after the trifoliolate leaves have expanded (Hartman et al. 1987). These lesions may then enlarge and coalesce into irregular necrotic blotches with buff colored centers and dark margins. Diseased plants defoliate prematurely and also senesce earlier than normal plants (Hartman et al. 1987). Older larger blotches maybe surrounded by chlorotic tissue and may cover up to 50% of the leaf surface. Dead brown centers of the blotches at times disintegrate producing a shot hole appearance. The lowest leaves usually have more severe symptoms compared to the upper one and the disease
progresses vertically in the plants.
The disease results in reduction in seed weights, seed size, number of pods and number of seeds per pod. All of these contribute to a reduction in yield. Reduced seed weights maybe a result of reduction of photosynthesis (Datnoff et al. 1987) associated with premature defoliation and chlorosis on the infected parts of the plants.
Because it is not widely found, there are only a few studies where disease has been evaluated using methods like the lowest attached leaf (Datnoff et al. 1987) and fully expanded leaf from upper canopy (Levy et al. 1990). These studies do not take into account defoliation, an aspect of the disease reported to be most damaging (Stewart, 1957).
The disease cycle has not been fully characterized on either soybean or
Neonotonia wightii. The initial source of inoculum is not known in newly planted
fields, primary inoculum maybe be conidia or sclerotia from infected plants of N. wightii or other unknown alternative hosts. (Hartman et al. 1987). Infection may occur when rain splashes sclerotia found on the soil surface onto leaf surfaces. The sclerotia on the leaf surface germinate to cause infection. Heavily diseased leaves drop to the ground discharging pycnidia and sclerotia back into the soil which provides for secondary infection by conidia or sclerotia. The sclerotia and probably the pycnidia overwinter in the soil and provide inoculum for the next growing season and the cycle repeats. (Hartman et al. 1987). Wet and humid conditions promote disease development.
The disease is managed by using fungicides, Hartman and Sinclair (1996) reported improved yields with fungicide application in managing red leaf blotch in soybeans. Cultural practices also may provide some results in controlling the disease. Use of resistant cultivars is recommended if they are available. Datnoff et al. (1987) reported soybean cultivars, ‘Jupiter’ and ‘Tunia’ in Zambia to be resistant to P. gylicinicola. However, no other reports of resistance to the disease have been made in other countries. It is imperative to study resistance to red leaf blotch in soybeans and develop resistant cultivars to employ in the management of this disease.
QTL analysis
Quantitative Trait Loci (QTLs) are regions within genomes that contain genes associated with particular quantitative traits (Collard et al. 2005). QTL analysis and identification is based on the analysis of marker genotype association or linkage with phenotypes and other makers or loci. Methods of QTL analysis include single-marker analysis, simple interval mapping and composite interval mapping. Of these three common methods, single-marker analysis is the simplest; this tests the quantitative trait value differences of each genotype one marker at a time. Statistical methods used in single-marker-analysis may include a simple t-test, analysis of variance (ANOVA), linear regression, likelihood ratio test or maximum likelihood estimation (Hui Liu, 1998). Linear regression is more commonly used because the coefficient of regression (R2) from the marker
explains the phenotypic variation associated with the QTL linked with that marker (Collard et al. 2005).
Single marker analysis does not involve complicated data analysis or require complete linkage maps and gene orders and can therefore be performed using basic statistical software programs (Hui Liu, 1998 and Collard at al. 2005). However, this method is disadvantageous in that the further the QTL is away from the marker, the less likely it is to be detected and the magnitude of the QTL to be underestimated (Tanksley, 1992; Collard et al. 2005; Hui Liu, 1998).
Interval mapping has an advantage over single marker analysis as it takes into account missing genotype data at putative QTLs (Broman and Sen, 2009). Simple interval mapping (SIM) utilizes linkage maps to analyze intervals between
adjacent pairs of linked markers instead of single marker analysis (Collard et al. 2005; Lander and Botstein, 1989; Hui Liu, 1998). This is considered statistically more powerful than single marker analysis and compensates for recombination between markers and QTLs (Collard et al. 2005). Simple Interval Mapping (SIM) involves testing for a single QTL at each interval across the order of markers in the genome. These results are reported as a Logarithm of Odds (LOD) score (Doerge, 2002).
Composite Interval mapping (CIM) has become more commonly used recently (Collard et al. 2005). CIM includes a combination of interval mapping and linear regression, and also includes additional genetic markers in the statistical models in addition to the adjacent pair of linked markers for interval mapping (Collard et al. 2005; Jansen, 1993; Jansen and Stam, 1994). Collard et al. (2005) also note that this method is more precise and effective compared to SIM and single-marker analysis. One crucial disadvantage of marker regression is that considering presence of one QTL at a time limits ability to detect linked QTLs or QTL interactions (Broman and Sen, 2009).
Development of the 1,536 SNP chip via the GoldenGate assay (Illunina Inc., San Diego, CA) has reduced the cost and time required to obtain genotype data. The high throughput multiplex nature of the GoldenGate assay is a great attribute as a platform for genotyping bi-parental populations in QTL mapping (Hyten et al. 2010). Quantitative Trait Loci associated with reaction to fungal pathogens and diseases have been identified through various studies and methods.
A reported 107 QTLs associated with resistance to fungal pathogens and diseases have been identified and mapped according to Wang et al. (2010).
A study by Zhao et al. (2005) identified three SSR markers associated with reaction to Rhizoctonia solani in a study using F2 and F5 RIL population constitute from a cross between a susceptible parent Sterling and a resistant parent PI442031. These markers were linked to QTLs on chr 6 C2) and chr 7 (LG-M). Zhao et al. (2005) also reported that reaction to Rhizoctonia solani is a quantitative trait controlled by both major and minor genes with additive effects. A study by Arahana et al. (2001) to identify putative QTLs for resistance to
Sclerotinia sclerotiorum ( sclerotinia stem rot) in soybeans was done using five
mapping populations of RILs developed from crossing a susceptible cultivar, Williams 82 (Bernard and Cremeens, 1988a) with five cultivars exhibiting partial resistance to Sclerotinia sclerotiorum (Arahana et al. 2001). The resistant
cultivars used were Corsoy 79(Bernard and Cremeens, 1988b), Dassel (Orf et al. 1987), DSR173 (Dairyland Seed Co., Inc., West Bend, WI, USA), S19-90
(Novartis Seeds, Inc., Minneapolis, MN, USA) and Vinton 81(Fehr et al. 1984).
Arahana et al. (2001) identified 28 putative QTLs for sclerotinia resistance, with alleles that confer this resistance identified from both the susceptible parent as well as the resistant parent. Screening of soybeans for reaction to Sclerotinia sclerotiorum has to be done with consideration of disease escape mechanisms, an observation also made by Kim and Diers (2000). In their study, Kim and Diers (2000) identified 3 QTLs that control resistance to
mechanisms such as lodging, plant height, and date of flowering. Kim and Diers (2000) used a population developed from a cross between S19-90 and Williams 82, similar to one of the populations in the Arahana et al. (2001) study.
In this thesis research, evaluations of soybean lines and populations used in the study by Arahana et al. (2001) to screen for resistance Sclerotinia
sclerotiorum were used to screen for reaction to Rhizoctonia solani Kühn
(teleomorph Thanatephorus cucumeris) and Phoma glycinicola (formerly known as Pyrenochaeta glycines). The cultivars evaluated in this study are Williams 82, Corsoy 79, Dassel, DSR173, S19-90, Vinton 81, Mandarin (Ottawa) and Friskeby III. Recombinant Inbred Line mapping populations developed from crosses involving those parent lines that showed significant differences in response S. sclerotiorum were then screened for reaction to R. solani and Phoma glycinicola
infection.
The 1,536 SNP chip Genotype information from the GoldenGate assay was used in conjunction with soybean linkage maps to identify QTLs for reaction
to Rhizoctonia solani and Phoma glycinicola. Comparisons of QTL involved in
reaction to R.solani, P. glycinicola and S. sclerotiorum in these soybean populations are discussed.
Both pathogens cause significant stand loss through root rots and seedling damping off. Management practices for these pathogens is limited to fungicide application, crop rotations with wheat and corn, improved soil drainage and other cultural practices. Varietal resistance to Rhizoctonia solani has been observed in some soybean lines (Dorrance and Mills, 2010). No resistance or tolerance to P. glycinicola has been reported except for two varieties in Zambia (Datnoff et al.
(1987). There are few studies on the genetic mechanisms that are associated with resistance to these fungal pathogens. The hypothesis is that Soybean reaction to fungal pathogens R. solani and P. glycinicola is controlled by multiple gene regions with varied effects which can be identified using appropriate phenotypic evaluations and genotypic markers through linkage analysis and mapped to specific genomic regions, or quantitative trait loci. These traits are inherited as multigene characteristics. Soybean varieties have varied resistance to R. solani
and P. glycinicola and thus populations segregating for resistance to these pathogens can be constructed. The objectives of this study were to
i. identify QTLs that influence reaction to Rhizoctonia solani and Phoma glycinicola, and
ii. compare results with confirmed QTLs that control reaction to other fungal pathogens
CHAPTER 3: MATERIALS AND METHODS
Rhizoctonia solani
Plant material
Eight soybean parent lines were inoculated and evaluated for disease response to Rhizoctonia solani Kühn. These lines included Williams 82 (Bernard and Cremeens, 1988a), Corsoy 79 (Bernard and Cremeens, 1988b), Dassel (Orf et al. 1987), DSR173 (Dairyland Seed Co., Inc., West Bend, WI, USA), S 19-90 (Novartis Seeds, Inc., Minneapolis, MN, USA), Vinton 81(Fehr et al. 1984), Friskeby III (PI 438471) and Mandarin (Ottawa) (PI 548379). These cultivar lines had been used to develop RIL populations. The F5-derived RIL mapping
populations had been developed by crossing Williams 82, a relatively susceptible cultivar to sclerotinia stem rot, with the other more resistant lines. These plant materials were used in the study by Arahana et al. (2001) evaluating response of soybean lines to Sclerotinia sclerotiorum.
The disease responses of all the cultivars to R. solani were determined and compared to Williams 82 to identify if there were significant differences between these lines and Williams 82, which was a common parent in the crosses to
develop bi-parental RIL populations. This would determine which RIL bi-parental population(s) would be segregating for reaction to R. solani and hence decide which population to evaluate for the QTL analysis. The results from parent
cultivars categorized Williams 82 as a moderately susceptible line while DSR 173 and Corsoy 79 were moderately resistant lines significantly different from
Williams 82. Therefore RIL populations from the crosses Williams 82 X DSR 173 and Williams 82 X Corsoy 79 were selected for evaluation for reaction to R. solani.
For ease of referencing the populations, the RIL populations will be referred to by the variety crossed with Williams 82. The two F5-derived
populations, Williams 82 X DSR-173 (afterwards called DSR 173), Williams 82 X Corsoy79 (afterwards called Corsoy 79) consisted of 89 and 90 individual RILs, respectively (Arahana et al. 2001).
Pathogen Isolate used for Inoculation
The isolate of Rhizoctonia solani used in this study is WN-11 (AG2-2 IIIB) which was collected from 60-to 75-day-old- bean plants in western Nebraska, characterized and verified by sequence in GenBank as FJ492114.2 (Penă et al. 2013, Venegas et al. 2008, Carling and Kuninaga 1990). This isolate was selected for its virulence compared to the other isolates used in the study by Penă et al. (2013). It was stored on sugar beet seeds and refrigerated at 40 C. Reactivation was achieved by placing the seeds on a petri dish of water agar (Difco, MI, USA) to induce fungal growth. After 4 to 5 days of growth, a 6 mm plug of the mycelium was taken from the growing edges of the petri plate and transferred to a petri dish of Potato Dextrose Agar (PDA) to increase the amount of inoculum and also detect contamination by other fungi or bacteria. After 4 to 5 days at 22 ± 10 C pure culture 6mm plugs were then taken from the growing edges of colony and transferred to another PDA plate and allowed to grow in the same conditions for 4 to5 days.
To increase the amount of inoculum, 10 6mm plugs were taken from the edges of the colony and added to a deep petri plate of 100mm X 20mm containing 50 cc of pasteurized soil composed of 3 parts soil and 1 part sand (3:1) and 15 cc of autoclaved Difco potato dextrose broth (PDB), incubated for 15 days at 22±10C and the contents of each petri dish was mixed with pasteurized soil composed of 3 parts soil and 1 part sand in a ratio of 9:1. Two petri plates containing 100 cc were mixed with 900 cc of the soil sand mixture and this was the inoculation media used in the greenhouse experiments. This ratio was determined by Penă et al.
2013 as the best ratio producing consistent disease when compared with ratio 1:100 which failed to produce disease symptoms and 1:5 which produced severe symptoms. Density of inoculum is important given the correlation between inoculum quantity and disease severity (Baker 1971). The soil composition of 3:1 soil to sand was to mimic the soil conditions in western Nebraska fields where the isolates were collected.
About 300 cc of soil and sand mixture (3:1) was added to 4 inch pots, seeds were placed on top of this soil and covered with about 100 cc of inoculum mixture to fill the pots. That was the process of inoculation used in evaluating both the parental cultivars and the RIL populations.
Experimental design
The parent lines were evaluated in a randomized complete block design experiment in the greenhouse. Seven seeds of each cultivar were planted in a 4 inch diameter pot and 8 pots containing seeds of all the parent cultivars were placed on a tray on a bench in the greenhouse. The trays were white in color to avoid heat absorption and retain any excess water that would run off from the pots. The tray represented the block and the experimental unit was the pot. The experiment had 10 trays equivalent to 10 blocks. These were grown in the greenhouse at the University of Nebraska-Lincoln East campus greenhouse in May and June 2014. The greenhouse was maintained at an average relative humidity of 36.7% and average temperature of 70o F (21o C). No fertilizer was applied and the plants were watered daily with 50 ml of water to maintain field capacity.
The plants were grown in the greenhouse for 15 days and scored for disease symptoms of Rhizoctonia solani. Most plants were at the V1 stage (Fehr and Cavinnes 1977) although there were plants observed at different levels of development from VE up to V1, with a few V2 plants observed. The plants were gently removed from the pots and the roots and hypocotyl washed and rinsed gently to reveal lesions and other disease effects. Non-germinated and/or rotten seeds were also scored as the pathogen is associated with pre emergence damping off. The seeds were tested for germination before and after evaluations to
Disease Evaluation of Parent lines
The plants were scored for root and hypocotyl rot using the 1to 9 CIAT scale (Van Schoonhoven and Pastor-Corrales 1987) that was also used in the evaluation of dry beans by Penă et al. (2013). The screening scale had ratings 1 to 3 categorized as resistant, 4 to 6 as intermediate and 7 to 9 as susceptible. The scale was as below:
1 = No visible symptoms, normal plant development; 2 = 10% root infection, small (3 mm) superficial root lesions, normal plant development; 3 = 10 to 20% infection, small (3 to 5 mm) superficial lesions surrounding hypocotyls or roots, normal plant development; 4 = 20 to 35% infection, small (3 to 5 mm) deep lesions surrounding hypocotyls or roots, normal plant development; 5 = 35 to 50% infection, deep (3 to 5 mm) lesions surrounding hypocotyls or roots,
secondary roots and plant development reduced; 6 = 50 to 65% infection, deep (5 to10 mm) lesions surrounding hypocotyls or roots, few secondary roots visible, plant development highly reduced; 7 = 65 to 80% infection, deep (10 mm) lesions surrounding hypocotyls or roots, few or no secondary roots visible, elongation of hypocotyl, and no formation of first trifoliolate leaf; 8 = 80 to 95% infection, emergence followed by loss of cotyledon and absence of secondary roots; 9 = 95 to 100% infection, seed dead, no emergence.
Data analysis
For the evaluations of the 8 parent cultivars, all the scores of the 7 plants in a pot for each cultivar in a block were averaged to obtain a mean score for that
cultivar in that pot and that was the recorded disease score of that cultivar. The disease scores of all the eight cultivars were then used in an analysis of variance (ANOVA) using the PROC GLM procedure of SAS 9.4. The model for the disease score used was: Yij= μ +Li + Bj + Єij;where Li is the effect of the ith parent
line, Bj is the effect jth block and εij is the random error. The PROC MEANS
procedure of SAS 9.4 was used to generate mean scores of the cultivars and to test the significance of difference between the scores of the cultivars, the PROC GLIMMIX procedure of SAS 9.4 (SAS Institute, Inc., 1989) was used to calculate the least square means of the varieties, with the varieties and block effects treated as class variables. Single degree of freedom comparisons of the least square means was made using Type I error of α = 0.05 to test for significance in the difference. Significant differences were realized between Corsoy 79 and DSR 173 in comparison with the common parent Williams 82. Therefore the populations Corsoy 79 and DSR 173 were also evaluated for disease response to Rhizoctonia solani.
Evaluating the populations
The experiment was designed to test the effect of the RILs in the two populations under evaluation. The experiment was set up as completely randomized design (CRD) with RILs randomly assigned to pots in the
greenhouse. The pots were placed on similar trays as the parent lines, each tray holding 8 pots. Each planting date, a replication was made up of 24 trays. All the lines from both the DSR 173 and Corsoy 79 populations were planted in each replication, including the parent lines that constituted the crosses to make these
populations. The experiment was replicated 5 times with each replication planted one week after the previous replication. This study was done at the University of Nebraska-Lincoln East campus greenhouses during February and March 2015. The same evaluation protocol was followed for the RIL populations as described for the parent lines.
Disease score data from the evaluation of the Corsoy 79 and DSR 173 populations was used in an ANOVA using the model Yij= μ +Li + Rj + Єij;where
Li is the effect of the ith parent line, Rj is the effect jth Replication and εij is the
random error. The SAS 9.4 PROC MEANS to generate the mean scores and standard deviations of the individual lines from the populations across all the replications of the study. Analysis of variance was performed using the GLM procedure of SAS 9.4 package and the UNVARIATE procedure of SAS 9.4 was used to test the normality of the distribution of these scores as well as generate the means. Due to inconsistences in germination of seeds in Corsoy 79 population and the variation in seed sources and quality, only disease scores data from the DSR173 population was used in QTL analysis.
QTL analysis
The DSR 173 RIL population data was used in the QTL analysis for the reaction to the fungal pathogen Rhizoctonia solani. The RILs from the DSR173 population and the parent lines DSR173 and Williams 82 were previously genotyped by Arahana et al. (2001) using USLP 1.0 consisting of 1,536 SNP markers that were well distributed throughout the 20 chromosomes (Hyten et al.
2010). The alleles were designated as “A” from the resistant parent DSR 173 and “B” from the susceptible parent Williams 82. Possible genotypes therefore were AA and AB in this RIL population. The R/qtl software package (version 3.2.2, R Core Team, 2015) was used to construct linkage map of the markers using the Hyten et al (2010) marker orders and the Kosambi map distance function. The QTL mapping was performed via Maximum Likelihood using the expectation maximization (EM) algorithm. Haley-Knott regression was used for interval mapping and composite interval mapping was also done.
The R/qtl package was used to check and summarize the data; number of individuals, markers, phenotypes, position of markers on the chromosomes. The marker positions on the chromosomes were then adjusted using the jittermap command as some were located at the same positions on the chromosomes. The proportions of genotypes in the data were checked to compare with the expected 1:1 ratio of RIL populations. Data summary statistics like mean, variance, standard deviation (SD), skewness, and kurtosis were also calculated. Data was also tested for normality via the Shapiro-Wilk normality test.
QTL mapping and simple marker regression was done using the scanone command. This was done with the maximum likelihood via the expectation maximization (EM) algorithm. Interval mapping was then done using the Haley-Knott regression and the results compared. The multiple imputation (IM) method was used to deal with missing genotype data during the interval analysis. A permutation test with 1000 permutations was performed to generate a population specific LOD (Logarithm of odds) threshold score for determining statistical
significance at 5% probability level. This threshold was then used to identify QTL markers to be used as a co-factors in Composite Interval Mapping (CIM) to identify more QTLs in the region or those linked together. The fitqtl in R/qtl command was used to determine the proportion of variation explained by the QTL.
Phoma glycinicola
A study to evaluate response of soybean lines to Red leaf blotch, a fungal disease of soybeans caused by the pathogen Phoma glycinicola was conducted in Uganda, East Africa during September through December 2015. The eight parent lines from the Nebraska Soybean breeding program that were evaluated for the R.
solani study, six Ugandan varieties and 90 RILs from the DSR173 population
that was constituted from a cross between Williams 82 and DSR 173 were planted in a field for an evaluation for response to the disease. The parent lines from Nebraska included Williams 82, Dassel, Corsoy 79, DSR 173, Vinton 81, Friskeby III, Mandarin Ottawa, and S 19-90. Six Ugandan cultivars included in the trial were Namsoy 4M, Maksoy 1N, Maksoy 2N, Maksoy 3N, Maksoy 4N and Maksoy 5N. The entries were planted in September 2015 at the National Crops Resources Research Institute (NaCCRI), Namulonge (00°32’ N, 320°37’ E, 1150m above sea level) under natural infection, no inoculation was performed. The location has a bimodal rainfall pattern with a tropical wet and mild dry climate with slightly humid conditions (average 65%).
All 104 entries were set up in a Randomized Complete Block Design (RCBD) with 4 blocks as replications. They were all planted on the same day on September 4, 2015 in a rain-fed system, weeding was done manually and no fertilizer or pesticide was applied. The seeds from the Nebraska programs were however pretreated with a fungicide Cruizer maxx which has the active
ingredients thiamethoxam (insecticide) and fludioxonil and mefenoxam as fungicides to meet phytosanitary import requirements. Fifty seeds were planted per line in each row of 3ft long with a 1ft alley between rows per replication. A few rows were planted with between 35 to 40 seeds due to insufficient seed quantities.
Evaluation of Disease severity and incidence
The disease severity was scored visually on a scale of 1 to 5 as based on a scoring scale used by Horsfall and Barrat (1945). Because the disease lesions appear on the lower located leaves first and more severely, the lower leaves are evaluated and the proportion of the plants covered by disease symptoms as well as the amount of evident defoliation taken into account while scoring. As the
disease progresses, the upper leaves also show symptoms and defoliation is also more prevalent, therefore the vertical spread of the lesions and defoliation rate affects severity of the disease on a plant. All the plants in a row plot are evaluated and a disease score assigned to the whole row plot. Disease symptoms were scored as follows;
1- Plants in a row predominantly show less than 5% leaf area with lesions, lesions only on lower leaves.
2- Plants in a row predominantly show 5 to 25% leaf area with lesions, lesions only on lower leaves.
3- Plants in a row predominantly show 26 to 50% leaf area with lesions, lesions appear on intermediate leaves
4- Plants in a row predominantly show less than 50 to 75% leaf area with lesions, lesions appear on upper leaves.
5- Plants in a row predominantly show more than 75% leaf area with lesions, disease covers all leaves on all the nodes of the plants.
The trial was evaluated on 3 different dates, starting on 26th Oct (51 DAP), 4th Nov (61 DAP) and then 12th Nov (71 DAP). In experiments with local adapted lines, disease evaluation is usually done at 75 DAP. In this trial, because the lines from Nebraska were not adapted to the Uganda conditions, including but not limited to the day length, they matured sooner compared with the local checks. The Nebraska lines flowered at 30 DAP while the local checks were still vegetative at this stage. The difference in maturity stages was consistent
throughout the experiment and possibly had an influence in the disease response of the lines. The scores on the various scoring dates were summarized and averages generated using the PROC MEANS procedure of SAS 9.4. Analysis of variance was done with the PROC GLM procedure of SAS 9.4 and distribution of these scores was also examined. The model used for the disease score was Yij= μ
+Li + Rj + Єij;where Li is the effect of the ith line, Rj is the effect jth replication
using the GLIMMIX procedure of SAS 9.4 to detect statistically significant differences in the response of the different parents and lines in the DSR173 RIL population.
Disease scores for the RILs were also averaged across replications for the various scoring dates and analyzed. The MEANS procedure of SAS 9.4 was used to generate means and an analysis of variance using the GLM procedure of SAS 9.4 was performed as well. The disease scores across the scoring dates were averaged for the RILs and a similar analysis performed. The scores from each date for the RILs were then used to analyze for QTLs that control reaction to
Phoma glycinicola in soybeans using the genotype SNP marker data used in the
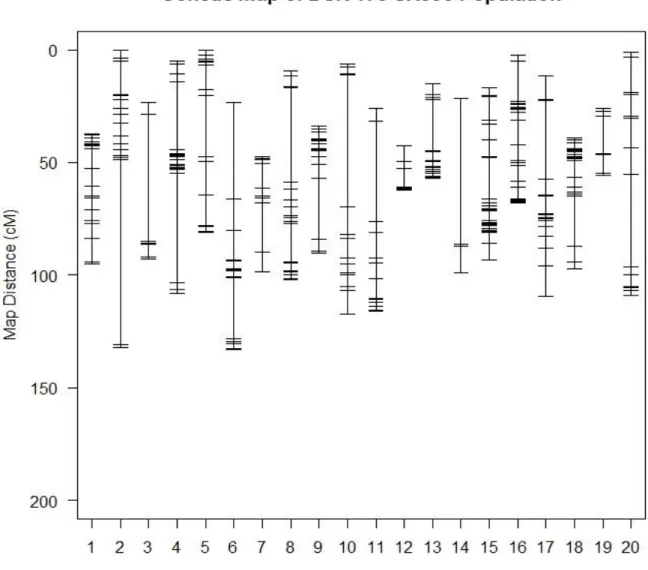
Arahana et al. (2010) study and the Rhizoctonia solani study. Analysis for QTLs using similar protocols and procedures as with the Rhizoctonia solani data using R/qtl package version 3.2.2 (R Core Team, 2015) and the SNP marker genotype for the DSR 173 population. The DSR 173 population had 350 polymorphic SNP markers spanning all the 20 chromosomes according to the linkage map (Figure 3) by Hyten et al. (2010). The Kosambi map distance function was used (Figure 9). A test of 1000 permutations generated a population specific LOD threshold score of ≥3 at a probability level of α=0.05 (Figure 7, Appendix table 4).
CHAPTER 4: RESULTS
Rhizoctonia solani
The greenhouse screening of the 8 parent lines showed variation in response to R. solani. Symptoms ranging from a score of 1 to 9 were observed among the plants in the experiment.
The most resistant line, DSR 173, scored an average disease rating of 3.1 (Table 1) which would be categorized as resistant, while the most susceptible line scored an average disease rating of 5.3 (Table 2). Williams 82, the common parent used in the constitution of the RIL populations scored an average disease rating of 4.6 (Table 1). The minimum average score recorded for the parent lines was 1.9 while average scores of 9, the highest on the scale and rated most
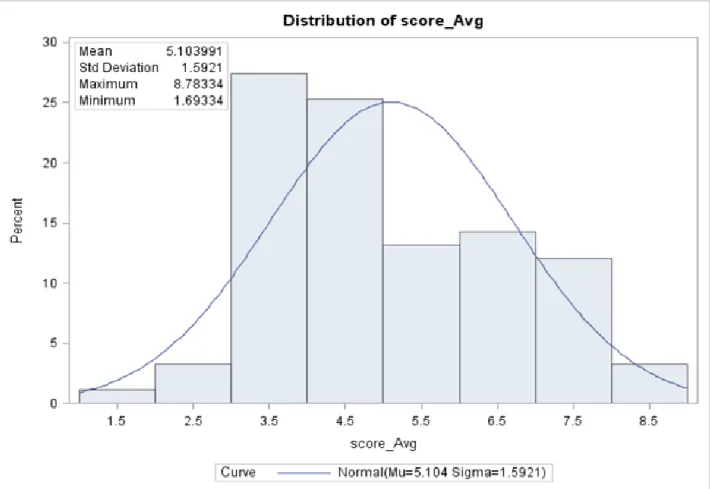
susceptible also were recorded. The scores were centered on the average of 5.1 (Figure1). An analysis of variance (ANOVA) of the scores showed a significant effect of the parent lines (P≤0.0111) while the block treatment was not
significantly different (P≤0.1028) (Table 2).
Single degree of freedom contrasts between Williams 82, the common parent for the RIL populations and the other parent lines showed significant differences (p≤0.05) only between Williams 82 and Corsoy79 and DSR173 (Table 3). Other significantly different single degree of freedom contrasts were between Corsoy 79 and Dassel, Corsoy 79 and S19-90, DSR 173 and Dassel, DSR 173 and Mandarin Ottawa, Friskeby III and S 19-90, S 19-90 and Vinton 81 (Table 3), suggesting that informative RIL populations may be developed from crosses between some of those parental combinations for future studies. The
existing RIL populations constituted by crosses Williams 82 X Corsoy 79 and Williams 82 X DSR 173 were therefore ideal for evaluation of QTLs for reaction to R. solani as they would be segregating for this characteristic.
Evaluating the DSR173 (UX 990) population for response to the fungal pathogen R.solani, the average line scores ranged from a minimum of 1.7 for the parent line DSR 173, to a maximum score of 8.9 for the RIL UX990-023 (Table 5). The scores were normally distributed and centered on the mean of 5.1 (Figure 2). The susceptible parent line Williams 82 had an average score of 3.3 (Table 5). These average scores were used as the phenotype ratings in the QTL analysis.
An analysis of variance indicated significant differences among RILs (p≤0.0001) as well as a significant effect of the block or replications (p≤0.001) (Table 4).
QTL analysis was done using R/qtl package version 3.2.2 (R Core Team, 2015) using the SNP marker genotype information available from a previous evaluation of these populations (Ramamurthy et al. 2014). The DSR 173 population had 350 polymorphic SNP markers spanning all the 20 chromosomes according to the linkage map (Figure 6) by Hyten et al. (2010). The R/qtl software was used to construct a linkage map of these makers using the Kosambi map distances function.
A permutation test of 1000 permutation generated a population specific LOD threshold score of ≥3 at a probability level of α=0.05 (Figure 7, Appendix table 4). Composite interval mapping using the Haley –Knott regression method
and the maximum likelihood with EM (expectation maximization) method
detected one significant QTL that had an LOD score of 11.1 which was above the threshold. This was located on chromosome 10 at a position 99.2 cM (Figure 8). This region is flanked by markers BARC-065663-19627 on the left at position 99.01cM and marker BARC-015925-02017 at 99.69 cM on the right. Additional scans after refining positions did not detect any more significant QTLs either linked to the QTL or in the same region of the genome (Figure 10). The closest highest peak was found on chromosome 15 at 20.6 cM that had LOD score of 2.0 which was below the threshold at probability level of α= 0.05.
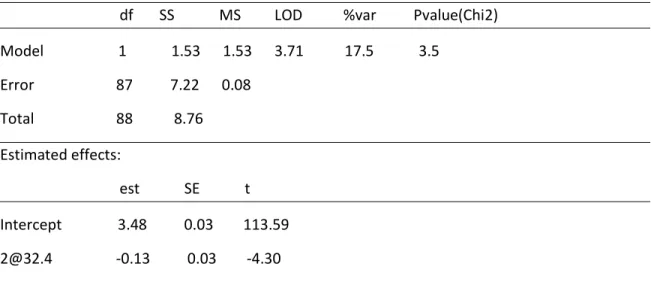
The detected significant QTL on chromosome 10 explained 43.1% variation based on the results from the fitqtl command in R/qtl (Table 15, 16) which makes it a QTL with major effects.
Phoma glycinicola
On the first evaluation date of 51 DAP, there was no variation in the severity of the disease in any of the plots. The disease was observed (incidence) in all the plots but the severity in all plots corresponded to a score of 1 on the scale of 1 to 5 employed in this study.
At 61 DAP, the severity of the disease had progressed in all the plots and some variation was evident with some plots recording different scores compared to other plots. The Uganda local varieties generally had higher (more severe) disease scores compared to the Nebraska parent lines and the DSR 173 RIL population. Average disease scores of the Nebraska parent lines ranged between
a minimum of 1.5 scored by Vinton 81 and maximum of 2.2 recorded by DSR173, Williams 82 had an average severity rating of 1.7 (Table 5). The Ugandan lines scored between 3.0 and 3.2 on average (Table 5). Analysis of variance for the parent lines from both Uganda and Nebraska indicated significant line effects and the replication effects at α=0.05 (Table 6). Single degree of freedom comparisons showed no significant difference (p≥0.05) in comparisons between Nebraska lines and comparisons between Ugandan lines at 61 DAP, however, all comparisons between Nebraska parent lines and Ugandan varieties showed significant differences. (Appendix Table 5). The average scores of the DSR 173 RILs at 61 DAP appear a bimodal distribution with a break at mean of 2.0 (Figure 2).
On the third date of disease evaluation (71 DAP), the severity had increased in all the plots and scores for the Nebraska parent lines recorded a minimum of 2.7 by Williams 82 (up from 1.5 at 61 DAP) and a maximum of 4.0 by Friskeby III (compared to 2.3 at 61 DAP). The same trend was evident in the Ugandan lines, the minimum disease rating was 3.3 by Maksoy 2N and the maximum 4.0 by Maksoy 5N (Table 7). Single degree of freedom contrast of the scores at 71 DAP showed significant differences (P≤0.05) between Williams 82 and Corsoy 79; Williams 82 and DSR 173; Williams 82 and Friskeby III; Williams 82 and Maksoy 1N; Williams 82 and Maksoy 3N; Williams 82 and Maksoy 5N; Williams 82 and Namsoy 4M; Dassel and Maksoy 5N and Dassel and Friskeby III. (Appendix table 6).
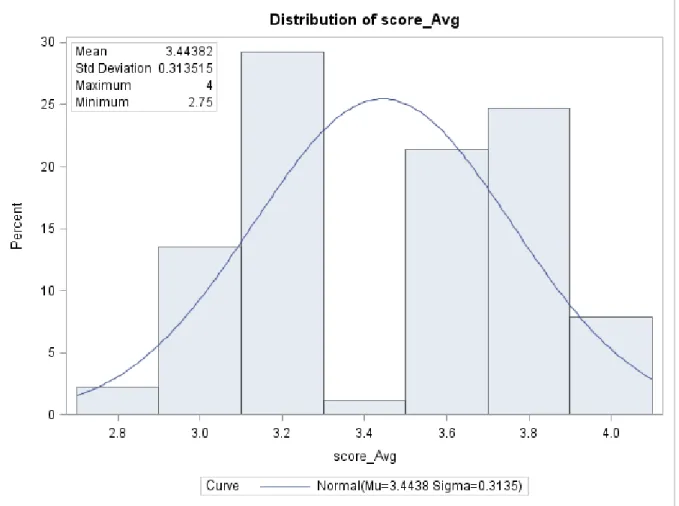
The DSR 173 RILs performed comparably to the Nebraska lines at all the evaluation dates. Again, at 71 DAP, the RILs display a bimodal distribution with a break at the mean of 3.4 (Figure 3). The number of lines below the break point is 42 and 47 lines above the beak point.
The disease rating score for Red leaf blotch at 61 DAP ranged from 1.5 to 2.8 while at 71 DAP, the range of disease scores was between 2.75 to 4. This was a similar trend as observed with the Nebraska parent lines and the Uganda
cultivars which also showed increased severity at 71 DAP compared with 61 DAP. Analysis of variance for the RILs at 61 DAP shows significant RIL and replication effect at α=0.05 (Table 9). Analysis of variance of the disease rating scores for Red leaf blotch of the DSR 173 RIL population at 71 DAP showed significant (P≤0.05) replication effect while the RIL effect was not significant (P=0.205). The average scores across dates are distributed normally centered on a mean of 2.7 and a standard deviation of 0.27. The minimum average score of 2.1 is recorded for UX990-104 while the largest average score across the scoring date is 3.4 recorded for UX990-028.
Analysis for QTLs using data from the scores at 61 DAP yielded a peak on chromosome 5 at position 15cM. This had LOD score of 2.65 which was below the threshold of LOD score 3 for a significant QTL. Data from 71 DAP yielded a significant QTL for the reaction to Phoma glycinicola on chromosome 2 at 32.4cM (Figure 12 and 13). This region had a LOD score of 3.7 which is above the threshold score of 3 for significant QTLs and explains 17.5% of the