Centre for Actuarial Research
(CARE)
A Research Unit of the University of Cape Town
An Investigation into Healthcare
Costs in the Last-Year-of-Life
CARE Monograph No. 2
Prepared by Prabashini Moodley and
Heather McLeod
July 2001
ISBN 0-7992-2084-1
Centre for Actuarial Research
University of Cape Town Private Bag Rondebosch 7701 SOUTH AFRICA Telephone: +27 (21) 650-2475 Fax: +27 (21) 689-7580 E-mail: care@commerce.uct.ac.za
R57 272.29 R17 918.47 R13 929.75 R15 010.56 0 20000 40000 60000 1345 819 344 84 co st in R
lyol 2lyol 3lyol 4lyol
Synopsis
The aim of this project is to examine studies already carried out on healthcare costs in the last-year-of-life, in order to develop and apply a methodology to selected South African private medical schemes.
In America, and parts of Canada, studies on the costs of healthcare at the end of life have shown that on average health costs are highest in the last-year-of-life.
In 1984 Lubitz and Prihoda studied the payments made by Medicare, America’s national medical cover programme for people over age 65. They found that payments for beneficiaries in their last-year-of-life were 6.21 times more than payments for beneficiaries who were not in their last-year-of-life. The most significant difference in payments for survivors and decedents was for costs incurred in hospital.
Studies including all medical costs showed that the last-year-of-life became more expensive as age increased. [Scitovsky, 1994] The Medicare studies, which exclude payments for frail care and most acute medication, showed that the last-year-of-life costs decreased as age increased. [Scitovsky, 1984]
The number of decedents with extremely high costs incurred near death was insignificant. This led the researchers to conclude that high costs in the last-year-of-life were not due to aggressive medical treatment in a bid to save lives.
This project analyses data for beneficiaries from eight private medical schemes for the years 1997, 1998, 1999 and 2000. Actual cost data was used for the period during which the beneficiary was covered by the scheme.
It was found that the last-year-of-life was the most expensive year-of-life. The average costs in each year-of-life from the last to the fourth-last are shown below. Averages were found by dividing total costs by the total number of years of exposure that was available.
Average costs in the last-year-of-life were 3.2 times average costs in the second-last-year-of-life. The four highest expenditure service categories in the last-year-of-life were hospital procedures and visits, hospital accounts, hospital accommodation and trauma-related services. Hospital accounts covered theatre fees and equipment, blood transfusions, organ transplants and hospital medicines.
The ratio of decedent costs to survivor costs was higher than 10 times in each year of the study period. Much further work needs to be done on understanding the patterns in these ratios.
Replicating the study on data from other schemes will distinguish the valid findings of this project from those that are due to characteristics of the data set.
Table of contents
Synopsis... ii
Table of contents ... iv
Glossary ... vi
1. Introduction... 1
1.1 Objectives of the Research... 1
1.2 Sources of Information ... 1
1.2.1 Existing studies ... 1
1.2.2 Medical scheme data... 1
1.2.3 South African mortality and healthcare... 2
1.3 Scope and Limitations of Project... 2
1.4 Acknowledgements... 2
2. Literature Review ... 3
2.1 Early Studies ... 3
2.2 Research on Cancer Patients... 3
2.3 Research on Critical-care Patients ... 4
2.4 Medicare Studies in the USA... 4
2.4.1 Introduction to Medicare ... 4
2.4.2 Reimbursements for decedents... 5
2.4.3 Trends in decedent reimbursements... 7
2.4.4 Medicare study with nursing home costs ... 9
2.4.5 Summary of the Medicare findings ... 11
2.4.6 Limitations of research on Medicare data... 11
2.5 Non-Medicare Studies ... 11
2.5.1 Manitoba provincial data ... 11
2.5.2 American private group practice data... 13
2.5.3 British Columbia Linked Health Data ... 13
2.5.4 American employer’s retirement plan data ... 15
2.5.5 Summary of findings of non-Medicare studies... 16
3. South African Medical Scheme Data ... 17
3.1 Source and Description of the Data ... 17
3.2 Classification of Claims... 18
3.3 Adjustments for Inflation... 18
3.4 Demographics of the Data ... 19
4. Healthcare Costs in the Last-Year-of-Life ... 23
4.1 Methodology ... 23
4.2 Analysis of Results ... 24
4.2.1 Average costs in the last-year-of-life ... 24
4.2.2 Last-year-of-life costs according to age at death ... 25
4.2.3 Spending on different medical services in the last-year-of-life ... 26
5. The Relationship between Decedent Costs and Survivor Costs ... 33
5.1 Methodology ... 33
5.2 Ratio of Decedent Costs to Survivor Costs... 33
6. Findings and Recommendations... 36
6.1 Key Findings... 36
6.1.1 Overseas Studies ... 36
6.1.2 South African Medical Scheme Experience ... 36
6.2 Recommendations for Further Work ... 37
Bibliography ... 38
Glossary
beneficiaryA person eligible for benefits of the scheme is called a beneficiary of the scheme.
decedent
A person now deceased.
enrolee
American equivalent of beneficiary. A person entitled to benefits from a medical scheme
last-year-of-life
The twelve months before death.
population ageing
Phenomenon where the birth rate is lower than the mortality rate, so that the average age of the population increases.
prospective adjustment basis
Where provision is made for an event, according to some criteria, before the event occurs. Specifically in terms of the Medicare payment system, service providers are paid a pre-determined amount before seeing the patients. The amount is an estimate of the actual cost of services that will be provided. It will either under- or over-estimate the actual costs.
1. Introduction
1.1 Objectives of the Research
USA studies have shown that health costs are the highest in the last year of life. No evidence of similar studies in the South African environment has been found.
A South African study of the private sector health costs in the last-year-of-life will add to the understanding of the financial dynamics of South African medical schemes. The issue is of particular interest in investigating possible risk equalisation mechanisms for South Africa.
The detailed objectives of the research were as follows:
• Examine studies already done on healthcare costs in the last-year-of-life.
• Develop a methodology for studying healthcare costs in the last-year-of-life.
• Apply the methodology to cost data for beneficiaries of selected South African medical schemes.
• Consequently, develop an estimate of average costs in the last-year-of-life for people with private sector medical cover.
• In the same context, examine the relationship between costs for beneficiaries in their last-year-of-life to costs for beneficiaries not in their last-year-of-life, for each calendar year.
1.2 Sources of Information
1.2.1 Existing studies
Information on similar studies conducted in the USA and Canada came largely from journals. Most last-year-of-life studies were published in medical journals, rather than actuarial or financial journals. The increasing availability of information on internet sites and the ability to communicate with authors electronically, facilitated the study. Several efforts were made to find work done outside North America. It is believed that some research on healthcare costs at the end of life may have been done in Switzerland. [Van den Heever, personal communication, March 2001] Attempts to gain access to material was made through the actuarial profession and through healthcare research contacts internationally. All of these attempts were unsuccessful in providing information on studies in other parts of the world.
1.2.2 Medical scheme data
A single, large South African scheme administrator generously provided cost and usage data for eight of the schemes it administers. The administrator’s staff provided assistance in resolving data classification ambiguities.
The data comprised membership and claims information for beneficiaries over the period 1 January 1997 to 31 December 2000. The data set is described in detail in Chapter 3.
1.2.3 South African mortality and healthcare
Two government publications provided South African statistics that were useful in interpreting the data.
• The Department of Health publishes an annual report on health trends in South Africa. The most recent publication includes data on deaths that occurred in 1994,1995 and 1996.
• The Central Statistical Service (CSS) report provides summary information on all recorded deaths for the whole of South Africa. Information on age at death, cause of death and place of death are included in the report.
1.3 Scope and Limitations of Project
By design, the project is confined to people with private medical scheme cover. The results can therefore not be generalised to the extent that the findings apply to all South Africans.
The data came from a single administrator. It is possible that certain observed patterns in the data are influenced by the benefit or scheme structures of the types of schemes administered by this particular administrator. The specific demographics of the study population are another factor to bear in mind when interpreting the findings of the study.
Estimating average costs from medical schemes claims data assumes that all medical costs incurred resulted in a claim. Realistically, some medical costs will be defrayed entirely by the person incurring the cost. No record of these costs is available through medical schemes claims data. The estimate of total costs from claims data therefore underestimates the true total cost. The extent to which people with private sector medical cover incur costs not covered by their medical scheme cover is not known.
1.4 Acknowledgements
The contribution to this project of the following people and institutions is much appreciated:
• The Administrator that provided the data
• The Administrator’s staff for assisting with data queries
• Prabashini specifically acknowledges her flatmates, Magesh and Deepali, for sharing her “good, bad and ugly moments”. Her colleagues, Ndi and Adele, are recognised for their help in proof reading her Honours research report which forms the basis of this monograph.
2. Literature Review
2.1 Early Studies
Sutton conducted one of the earliest known American studies in 1965 on the use of hospital services in the last year of life in Hyattsville, USA. The results are shown in Table 1. It is not possible to say whether this is relatively high or low since the study did not include comparable data for survivors. [Scitovsky, 1984]
Table 1: Sutton’s findings on hospital service utilisation in the last-year-of-life
All deaths Deaths over age 65
Death in short-stay hospital 48% 45%
Utilised some hospital services 63% 61%
In 1971 Timmer and Kovar published an article on the use of hospital and institutional care in the last-year-of-life together with data for survivors, in Hyattsville, USA. Last-year-of-life data was for adults aged 25 and over who died in 1964 or 1965.
The study found that 73% of adult decedents received some care in hospitals and institutions in their last-year-of-life. Only 13% of survivors received some hospital and institutional care during a 12-month period. The median bill for decedents was 2.7 times higher for decedents ($691 compared to $259). [Scitovsky, 1984]
2.2 Research on Cancer Patients
A number of studies on healthcare costs at the end of life focus on terminally ill patients. Studies on cancer patients dominate the research.
Scotto and Chiazze examined the results of the Third National Cancer Survey in the USA in 1976. They considered payments in the twenty-four months, 1 January 1969 to 31 December 1970. Hospital payments for cancer patients who died in this period were 1.88 times payments for cancer patients who survived ($3 317 compared to $1 769). [Scitovsky, 1984]
A study by Lubitz and Prihoda in 1984, found that:
“the pattern of expenses in the last year of life of patents who died of cancer was virtually identical to that of all decedents.” Anne A. Scitovsky, 1984 Data on the use of all medical services by cancer patients is widely available in the USA. However the findings of end of life studies on cancer patients, and terminally ill patients in general, cannot be generalised to all people at the end of life because they deal with one specific disease.
2.3 Research on Critical-care Patients
Studies on the use of intensive or critical care units show a high expenditure for patients that do not survive the hospitalisation. [Scitovsky, 1984]
Detsky, et al. did a study in 1981 on patients in Massachusetts General Hospital’s intensive care unit. The most significant finding was that the mean expenditure for patients who did not survive treatment in the unit, was statistically significantly higher than the mean expenditure for patients who did survive. (P<0.01) [Scitovsky, 1984]
2.4 Medicare Studies in the USA
Most of the research on healthcare costs of the elderly and at the end of life is concentrated in the USA. The Medicare programme provides cover for the over 65 age group and concern over the cost and the financial viability of the programme as the population ages, has focussed research attention.
In 1984, Anne A. Scitovsky reviewed the studies done in the USA, on medical costs at the end of life. Medicare studies reviewed included a 1973 study by Piro and Lutins, a 1983 study by Helbing, McCall’s 1984 work on Colorado beneficiaries only and the 1984 study by Lubitz and Prihoda. The Lubitz and Prihoda study was the most comprehensive study done at the time of Scitovsky’s review.
Ten years later, in 1994, Scitovsky looked at additional work that had been done since the 1984 review.
2.4.1 Introduction to Medicare
Medicare, America’s largest health insurance program, started in 1965. It is administered by the Healthcare Financing Administration. The program covers about 40 million Americans who are either 65 years and older, disabled and under 65 or have end-stage renal disease.
Medicaid is similar to Medicare and was also instituted in 1965. Medicaid focuses on America’s poorest of the poor.
In 1983, reimbursements to service providers by these schemes changed to a prospective adjustment basis. This basis sometimes under- or over-estimates costs. The service provider then absorbs the loss or makes a profit in that year.
Medicare does not cover the costs of nursing home stays. Acute medication costs are only partly covered.
2.4.2 Reimbursements for decedents
The relatively small number of Medicare enrolees who died in each year that was studied accounted for a relatively high proportion of total Medicare reimbursements. [Scitovsky, 1984]
Table 2: Medicare reimbursements for decedents
Study year % Died % of Total Costs 1967 5.0% 22.0% 1978 5.9% 27.9% 1979 4.9% 21.0%
Source: Milbank Quarterly, 62, 1984
Costs for the 1967 decedents studied by Piro and Lutins and the 1979 decedents studied by Helbing include costs in the calendar year of death only. Costs for the 1978 decedents studied by Lubitz and Prihoda includes costs for the twelve months before death.
A study of Colorado decedents only showed that average Medicare reimbursements for enrolees who died were six times the average for enrolees who survived ($6 000 compared to $1 000) [Scitovsky, 1984] Decedents were beneficiaries who died in 1978. Costs considered were for the full twelve months preceding death.
Table 3: Findings of Lubitz and Prihoda Study (1984)
Finding Decedents Survivors Ratio of Decedents to
Survivors
Had some Medicare
reimbursements 92% 58% 1.59
One or more
hospitalisations in 1978 74% 20% 3.70
Average reimbursements $4 527 $729 6.21
Hospital care average $3 484 $478 7.29
Hospital care as a % of
total cost 77% 66% 1.17
Reimbursements of
$5 000 or more 32% 4% 8.00
Source: Milbank Quarterly, 1984
Average reimbursements for those who died were 6.21 times average reimbursements for survivors. Further, 30% of all decedent expenses were incurred in last 30 days of life. 46% of all decedent expenses were incurred in the last 60 days and 77% of all decedent expenses were incurred in the last 6 months of life.
Reimbursements per enrolee and per person receiving Medicare services decreased with increasing age for decedents but increased for survivors. [Scitovsky, 1984] Raw data was not included. As a result the difference between the two groups decreased with increasing age.
Source: Milbank Quarterly, 62, 1984
Figure 1: Ratio of decedent costs to survivor cost in Lubitz and Prihoda study
The ratio of decedent to survivor costs was high in the 67-69 years age category (9.8), but decreased considerably for the over 85 years age category (3.7). The above results would probably change significantly if costs of nursing home stays, which are not covered by Medicare, were included. [Scitovsky, 1984] Old age survivors would have high nursing home costs, which would offset some of the high decedent costs. So the ratios at each age would probably be smaller.
Lubitz and Riley (1993) examined the age distribution of average Medicare payments for decedents and survivors in the 1988 calendar year.
Table 4 : Average payments in 1988, classified by age and survival status for Medicare enrolees, Lubitz and Riley study (1993)
Age Decedents Survivors Ratio of decedents to survivors
65-69 $ 15 346 $ 1 455 10.55 70-74 15 778 1 845 8.55 75-79 14 902 2 176 6.85 80-84 12 838 2 403 5.34 85-89 11 422 2 578 4.43 90+ 8 888 2 258 3.94 Total 13 316 1 924 6.92
Source: Milbank Quarterly, 72, 1994
The ratio of costs clearly decreases as age increases.
67-69 yrs
9.8 1
decedents survivors
85 yrs & over 3.7 1
decedents survivors
2.4.3 Trends in decedent reimbursements
After the results of initial Medicare studies were published, there was growing concern amongst USA policymakers and the public that health resources were being ‘wasted’ by the elderly and dying.
Lubitz and Riley (1993) examined the trends in Medicare payments in the last year of life to see if the proportion of payments accounted for by decedents had changed. Their reasoning was that:
“ If payments for people in their last year increased more rapidly than overall Medicare payments, more attention to services received in the last months of life might be called for.” - Lubitz, Riley, 1993
Medicare data for 1976, 1980,1985 and 1988 were used. 1976 was the earliest and 1988 was the latest year’s data available. Payments, for each study year, were classified according to whether they were for people in their last-year-of-life, that is decedents, or for survivors. Decedent payments were further classified into intervals of 30 days prior to death. Trends were examined according to age.
To enable comparisons of findings across the different study years, the payments were adjusted for changes in the study population to the 1976 Medicare population. Factors that were adjusted for included sex, age and the death rates.
Lubitz and Riley found that the percentage of total Medicare payments accounted for by decedents varied little during the study period. The average over the study period was 28.75% and the full range of results is shown below.
Table 5: Trend in decedent payments found by Lubitz and Riley (1993)
Study year 1976 1980 1985 1988
% Died 5.2% 5.4% 5.3% 5.1%
Decedents % of total costs 28.2% 30.6% 26.9% 27.2% % Costs adjusted to 1976 population 28.2% 30.8% 27.4% 28.6%
Source New England Journal of Medicine, April 15,1993
Table 6 : Trends in payments found by Lubitz and Riley (1993)
Year Decedent payment per person-year
Survivor payments per person-year
Ratio of decedent payments to survivor payments 1976 $ 3 488 $ 492 7.09
1980 7 025 902 7.79
1985 10 617 1 621 6.55
1988 13 316 1 924 6.92
The fall in the ratio of average decedent payments to average survivor payments seen from 1980 to 1985 is due to the change in the Medicare payment structure to a prospective system in 1983. It is not due to any changes in the pattern of decedent and survivor payments in general. [Lubitz and Riley, 1993] The ratios are fairly stable over the study period, allowing for the change in payment basis.
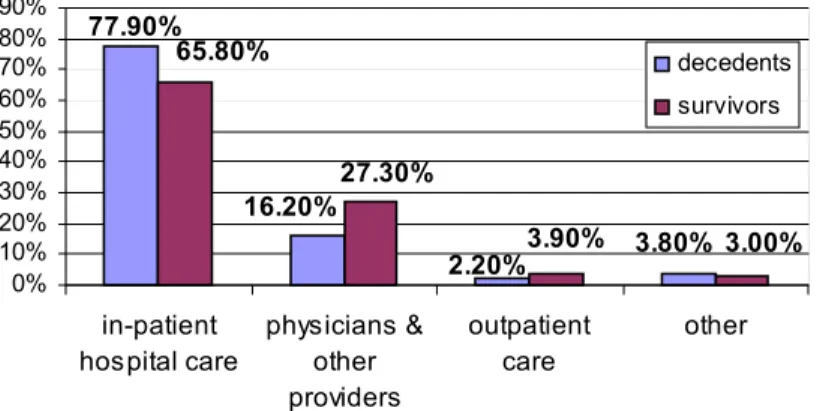
Lubitz and Riley also considered the percentage of different medical services used by decedents and survivors. Shown below are the distribution of medical services used in 1976 and 1988 according to Medicare payments for these services. Lubitz and Riley (1993) did not provide details on what was included under ‘other providers’ and in the ‘other’ category.
The 1976 and 1980 distributions were very similar, as were the 1985 and 1988 distributions. This is due to the change in payment basis in 1983. The 1980 and 1985 distributions have therefore been omitted.
Source: New England Journal of Medicine, April 15, 1993
Figure 2: Distribution of medical services used in 1976, Medicare data
Source: New England Journal of Medicine, April 15, 1993
Figure 3: Distribution of medical services used in 1988, Medicare data 77.90% 3.80% 2.20% 16.20% 3.00% 3.90% 27.30% 65.80% 0% 10% 20% 30% 40% 50% 60% 70% 80% 90% in-patient hospital care physicians & other providers outpatient care other decedents survivors 34.10% 4.80% 4.70% 20.20% 70.30% 3.50% 9.20% 53.30% 0% 10% 20% 30% 40% 50% 60% 70% 80% in-patient hospital care physicians & other providers
outpatient care other decedents survivors
Over 70% of Medicare reimbursements for decedents and over 50% of Medicare reimbursements for survivors were in respect of in-patient hospital care. The proportion of payments for in-patient hospital care decreased over the study period for both decedents and survivors. The proportion of payments for all other types of care increased. The change in distribution of payments for in-patient and outpatient services was due to a change in the Medicare reimbursement system in 1983. [Lubitz and Riley, 1993]
Lubitz and Riley also found that last-year-of-life costs were concentrated in the last days of life. 36% of last-year-of-life costs were incurred in the last 30 days of life, 14% in days 31-60 before death and 9.4% in days 61-90. [Scitovsky, 1994] That means a total of 59.4% of last-year-of-life costs were incurred in the last three months of life.
The high proportion of costs in the last 30 days reflects the fact that over half the deaths of elderly persons occurred in hospital.
The major finding of the Lubitz and Riley studies was that the share of expenditures accounted for by decedents in the last year of life remained the same from 1976 to 1988. Forces like inflation, new technology and societal changes that increased overall expenditures, affected both care for decedents and survivors. [Lubitz and Riley, 1993]
A relatively small number of people had very high expenditures in the last-year-of-life. [Scitovsky, 1984]
Table 7: High cost deaths in the Medicare studies
Study done on 1978 decedents by. …
Average Cost % of decedents
with higher costs
McCall $21 128 5%
33 094 1%
30 000 1%
Lubitz and Prihoda
20 000 3%
The data do not support the assertion that a large proportion of costs in the last-year-of-life are due to aggressive medical treatment on behalf of those who die. [Scitovsky, 1984]
2.4.4 Medicare study with nursing home costs
A comparison study of elderly populations who were only Medicare eligible and those that were both Medicare and Medicaid eligible was done by Temkin-Greener, et al. and reviewed by Scitovsky (1994). Data was on 1988 decedents from Monroe County, New York. The study also compared annual per capita payments over the four calendar years prior to death with those of the general population and survivors.
The new findings from this study were:
• Nursing home costs rose sharply with age. In the 65-74 year age group nursing home costs accounted for 24% of the total. In the 85+ group they accounted for 62% of the total. Information was not provided on total costs for each age group, so conclusions regarding absolute spending cannot be drawn.
• It would seem that older decedents received mainly supportive care. Younger decedents received more of the intensive care provided by hospitals.
• Higher than average use of services extended well before the calendar year of death. Across the three age categories used, 65-74 years, 75-84 years and 85 and older, this result was most marked for decedents in the 65-74 year age category.
• Almost 46.8% of Medicare-only decedents and 70.5% of Medicare-Medicaid decedents had NO hospitalisation in the last calendar year of life.
In 1994, Scitovsky reviewed the new studies since her 1984 article on the topic and found that Medicare studies still ignored nursing home data. She attempted to estimate the national distribution of costs in the last year of life by age group if non-covered nursing home costs were included.
Scitovsky used data from the 1986 National Mortality Followback Survey (U.S. Department of Health and Human Services 1992) and Nursing Home Utilization by Current Residents: United States 1985. Costs were inflated to 1988 prices by using the medical care component of the CPI.
Scitovsky found that when nursing home charges are included the differences between the three age categories disappear. The per capita charges rise slightly with age. As primarily acute care services covered by Medicare declines, the share of nursing home charges rises form 6.6% for 65-74 yr decedents to 40.4% for the 85+ age group. Scitovsky warns that these are rough estimates. However there is a strong suggestion that when all medical services are included it is unlikely that costs at the end of life are significantly lower for the very old than for the younger old.
Table 8: Scitovsky’s estimates of per capita medical care charges in the last-year-of-life, including nursing home charges
65-74 yrs 75-84 yrs 85 yrs & older Age 65 & over
Estimated nursing home charges $1 215 3 417 7 561 3 987 Adjusted Medicare payments 15 632 13 887 10 208 13 316 Estimated total charges 18 441 18 720 18 810 18 661
Source: The Milbank Quarterly, Vol. 72, No 4, 1994
2.4.5 Summary of the Medicare findings
All of the Medicare studies cited above show the same general trends in Medicare payments.
• There are significantly higher levels of use and expenditures by decedents than survivors.
• Average decedent costs in the last-year-of-life are about 6 times higher than average survivor costs.
• The ratio of decedent costs to survivor costs decreases as age increases.
• There are relatively few decedents with very high costs.
• As age increases, acute medical costs for decedents decreases. Acute medical costs for survivor costs increase with increasing age.
• The data do not support the assertion that ‘heroic’ medical interventions close to the end of life are responsible for high decedent costs.
• The proportion of total expenditures accounted for by decedents appeared to be fairly stable across different studies.
• Hospital costs account for the highest proportion of payments for both survivors and decedents.
• Within the last-year-of-life costs are concentrated in the weeks before death.
2.4.6 Limitations of research on Medicare data
The features of the care provided by Medicare limit the extents to which the findings of Medicare studies can be generalised. These limitations must be kept in mind when analysing the findings of studies on Medicare data.
• Medicare only covers people from age 65 onward, with a few exceptions. The effect of this limitation of data is mitigated somewhat by the fact that 67% of all deaths in USA occur over the age of 65.
• Nursing home costs are not covered at all
• Acute medication costs are only partly covered
• The cost data is for Medicare reimbursements and not actual costs incurred. The reimbursement ratio differs according to the type of service. In 1987 Medicare paid 44.6% of total medical costs incurred by enrolees. [Scitovsky, 1994]
2.5 Non-Medicare Studies
Very few USA studies were done on data other than Medicare data. These studies are vital in ascertaining which results found by Medicare research are truly due to an ‘end of life effect’ and which results are peculiar to the Medicare data set.
2.5.1 Manitoba provincial data
Roos, Montgomery and Roos examined medical care utilization data for decedents covered by Manitoba’s comprehensive provincial health system. (Manitoba is a province of Canada.) Decedents were beneficiaries who died between July 1974 and June 1976, aged 45 years or older at death. Expenses were estimated for the four years before death.
0 20 40 60 80 100 120
hospital stays nursing home stays physician visits 45-64 yrs 65-74 yrs 75-84 yrs 85+ yrs
Roos, Montgomery and Roos found that decedents aged 85 years and older had health expenditures that were:
• 29% higher than those of decedents aged 75 to 84 yrs • 74% higher than those of decedents aged 65 to 74 yrs • 100% higher those of decedents aged 45-64 yrs
The dollar estimates may overstate expenditures, especially for the oldest group, but there is a clear indication that death at older ages is likely to be MORE rather than less expensive. [Scitovsky, 1994] This is completely opposite to the findings of all Medicare studies reviewed.
The most dramatic difference in expenses, relative to proximity to death, was for hospital use.
Scitovsky (1994) reviewed the study and split up the utilization of different medical services by age. Roos, Montgomery and Roos detailed the actual costs for each age group in the original article. Attempts to obtain to a copy of this article were unsuccessful.
No. of days No. of days No. of visits
Figure 4: Service usage of Manitoba decedents, calculated by Scitovsky
In the graph above, hospital stays and nursing home stays are expressed in mean number of days. Physician visits are the mean number of visits. Nursing home stays show an exponential increase as age increases. The mean number of days spent in hospital and the mean number of physician visits in the last-year-of-life is relatively stable.
The most valuable advantage of this study over the Medicare studies is that the cover is comprehensive. Specifically, it includes nursing home costs.
2.5.2 American private group practice data
In 1988, Scitovsky looked at the costs of all medical services for 261 patients of a large multi-speciality, predominantly fee-for-service group practice in the USA. The study population was predominantly white and middle-class. The costs were incurred in the last year of life by patients who died in the period January 1983 to August 1984. Nursing home costs were included.
The data showed that decedents in the under 65 year age category had almost identical medical expenditures in their last year of life to those aged 65 to 74 years. Medical costs in the last year of life for the ‘old-old’ (80 years and over) were about 80% of the ‘young old’ (65-79 years). However, the two groups, old-old and young old, showed a very different pattern of utilization of medical services. [Scitovsky, 1994]
The hospital services costs of the old-old were 56% of the young old. Physician services were 46%. Frail care costs, which included nursing home and home healthcare, were 250% (2.5 times) the young old costs.
The study population was very small. It is therefore very likely that the findings are due to peculiarities of the study population.
2.5.3 British Columbia Linked Health Data
McGrail, Green, et al (2000) analysed British Columbia Linked Health Data for the over 65-year-old part of the population. This data set links records of all encounters of patients with physicians, alternative providers, hospitals, home care, pharmacies and deaths. Total, comprehensive use of services by each individual was calculated. Observed cost patterns are unlikely to be due to poor quality of data. [McGrail, et al., 2000] Costs were calculated for acute and continuing care for the last 6 months of life for British Columbians, in selected age categories, who died during the study period. Costs were only extracted for those decedents for whom cost data for the full last year of life was available. The comparison group comprised people in the age categories in British Columbia who did not die. These two groups together form a complete census of the population over the age of 65, in British Columbia in the study years.
Analysis of the costs revealed that costs of medical care rise with age for survivors but costs of medical care fall with age for decedents. Social and nursing care costs rise with age. In this study the additional costs for those close to death increase with age. So when full costs of care are included, the additional cost of dying falls much slower as age rises.
Table 9: Distribution of average costs by year and age in British Columbia
Age band Cohort Average decedent costs
Average survivor costs
Ratio of decedent costs to survivor costs 1986 20 928 1 259 16.62 65 1993 19 053 1 140 16.72 1986 25 180 2 991 8.42 75-76 1993 22 112 2 558 8.65 1986 29 117 8 561 3.40 85-87 1993 26 246 6 967 3.77 1986 29 500 11 576 2.55 90-93 1993 27 153 10 780 2.52
Source: Age and Ageing, 29, 2000
The ratio of total costs for those who survived and those who died falls from 16.6 for the 65 year age category to 2.5 for the 90 year age category. The ratios are stable between the 1987-88 and 1994-95 cohorts. Average decedent costs increase as age increases, in both cohorts.
The conclusions reached by McGrail, et al. were that costs of care increase with age,
but proximity to death is a better predictor of cost than age. In the older groups the additional cost of dying comes almost equally from additional medical costs and additional nursing and social costs. In the younger age groups it is mainly additional acute medical care that is used closer to death.
Evidence is that patterns of costs have remained relatively stable, despite the increase of around 15% in the elderly population between the two cohorts. This conclusion is reinforced later on by Reese (2000) in his review of Medicare data.
The authors found the stability in costs
“surprising in the light of evidence that much of the increase in healthcare costs is the result of more services being provided (relative to services provided in
previous years) for any given pattern of morbidity” McGrail, et al., 2000
Another point of interest is the similarity between those entering the study at ages 65 and 75-76. The patterns of decedents costs from these age groups are not very different.
This contrasts with the fall in medical costs of dying for those in their eighties and nineties. It was thought to be likely that the reason for the reduction in medical care costs between the two cohorts is the change in acute care provision in British Columbia, rather than the result of falling age-specific mortality. [McGrail, et al., 2000]
2.5.4 American employer’s retirement plan data
Adam J. Reese (2000) applied the last year of life cost approach to developing a valuation model for retiree medical plans. Reese developed costs by matching data for a large employer’s retiree healthcare plan with data for employees who were also participants in a retiree life insurance plan. The employer’s healthcare plan included costs for hospital, surgical and medical services. Charges paid by Medicare and costs of prescription drugs were excluded.
The average cost per decedent represented an average of claims in the twelve months preceding death for each decedent. The total volume of claims for 1992, less the aggregate volume of claims for the retirees who died in 1992, divided by the number of retirees alive on 31 December 1992, gave the average cost per survivor.
Reese noted that this cost allocation method left a six month time lag between the midpoint of the claims incurral period for the survivors and that of the decedents. The table below gives ratios of decedent costs to survival costs for employer data.
Table 10: Average costs for retirees from Reese’s last-year-of-life valuation plan
Age Average cost per Decedent Average Cost per Survivor
Ratio of Decedent cost to Survival cost 55-59 $25 306 $2 314 10.9 60-64 27 378 3 243 8.4 65-69 3 704 734 5.0 70-74 3 834 777 4.9 75-79 3 515 840 4.2 80-84 2 889 766 3.8 85-89 2 297 758 3.0 90 & over 2 196 595 3.7
Source: North American Actuarial Journal, April 2000
Like the Medicare studies, the ratio decreases as age increases. However 3.7 times survivor costs for decedents over 90 years of age is still high. These ratios can be compared to the results of the Medicare study by Lubitz and Prihoda, as shown below.
Table 11: Ratios of decedent costs to survivor costs in Medicare data Lubitz and Prihoda (1993)
Age 1976 1988 Reese Study
65-69 10.6 10.6 5.0 70-74 8.6 8.6 4.9 75-79 6.5 6.8 4.2 80-84 5.3 5.3 3.8 85+ 4.1 - - 85-89 - 4.4 3.0 90+ - 3.9 3.7 Source: North American Actuarial Journal, April 2000
The ratios are lower for the employer-paid benefits, from Reese’s study, at each age. Reese found that by looking at the average cost per decedent, the volume of services used in the last year of life increased through to age 74, then decreased as age increased. The absolute decedent costs at age 75 and over were below those for a retiree aged between 65 and 69 years.
The survivor costs, on the other hand, increased through to age 79 and then decreased gradually. They only fell below the 65-69 years age category level after age 89. Reese (2000) noted that:
“The stability and consistency in the Medicare data of the ratios of the
decedent costs to the survivor costs over time indicates it may be possible to construct a standard table of such factors.”
2.5.5 Summary of findings of non-Medicare studies
Some of the findings of the Medicare studies on healthcare costs in the last-year-of-life were reinforced by the findings of the studies on other data.
• Medical costs in the last-year-of-life are high
• Costs for decedents are much higher than costs for survivors
• The pattern of medical service utilisation in the last-year-of-life differs according to age
The most significant finding of the non-Medicare studies was that in two different, data sets the ‘cost of dying’ increased as age increased. The key difference between these data sets and Medicare data is that they covered all medical care costs. That is, nursing home and hospice care are included.
3. South African Medical Scheme Data
3.1 Source and Description of the Data
The data was obtained from a single large South African administrator. It covers eight different schemes, which are a mix of open and restricted schemes. The number of each type is not known.
The names of the schemes and their detailed rules and benefit structures were not made available. The administrator indicated that all the chosen schemes had “similar” benefit structures.
The study period runs from 1 January 1997 to 31 December 2000. People included in the study have either been beneficiaries of one of the schemes from before 1 January 1997, or joined a scheme during the study period. The data set included beneficiaries who left the schemes during the study period.
Each beneficiary is classified according to a member and dependent number. The date on which a person joined the scheme, date of leaving the scheme, date of death and the person’s date of birth have been recorded. This allows the number of months for which each beneficiary was part of the scheme that is the exposure, to be calculated. The age of a beneficiary at any time point during the study period can also be calculated.
The data includes all claims that were incurred by the beneficiaries during the study period. Each claim had been assigned to the beneficiary who incurred the claim. The administrator provided the actual costs that were incurred and not the benefit paid on each claim.
The type of service for which the claim was incurred was recorded. Claims were classified into 27 different medical services or medical expenditure categories.
Each claim amount was assigned to a month and year. The administrator maintains that this is a ‘month of service’ date, i.e. the month in which the claim was incurred. The authors noted with concern that there were ‘month of service’ dates in the data set that were later than the date of death of the beneficiary. This led the authors to believe the classification date could be a ‘month of payment’ date. This point was discussed at length and on a number of occasions with the administrator. The staff steadfastly maintained that the date was “month of service”, but could give no explanation for the discrepancies.
The authors suggest that it is possible that the administrator has defined ‘month of service’ as the date on which the claim is received from the provider or first recorded by the provider. This is the way in which ‘month of service’ dates have been interpreted throughout this project.
3.2 Classification of Claims
Due to time constraints, and in order to ease data manipulation, the 27 service categories were amalgamated into three broad categories, as shown in the Appendix. The categories were chosen to reflect the major risk pools from which the scheme would have paid the claim.
The first category is pooled benefits. It includes all major medical services that would have been paid out of the pool of funds of the scheme and not the beneficiary’s personal savings account.
Day-to-day benefits cover the lower cost, high usage services like doctors visits, acute medication, pharmacist’s therapy, basic dental and optical services. These benefits are typically paid out of the beneficiary’s individual savings account. Where a traditional option may exist as part of the scheme, the separation of day-to-day benefits is still relevant.
Chronic medication has been classified separately because the costs are usually monitored separately by medical schemes. Historically, certain high cost drugs prescribed after surgery or for disease treatment are classified under chronic medication, although they are actually of an acute nature.
3.3 Adjustments for Inflation
In order to make cost comparisons meaningful in real terms, all costs were adjusted to 1 January 2000 Rands. Costs incurred prior to this date were inflated to 1 January 2000 and costs incurred after 1 January 2000 were deflated appropriately. 1 January 2000 was chosen as the base time because of the way in which the inflation factor was derived.
The choice of what inflation factor to utilise was not clear. The price of private medical scheme cover can be measured by member contributions. The rate at which contributions have been increasing is higher than the Consumer Price Index (CPI). The CPI will therefore underestimate the price inflation for medical schemes.
Scitovsky (1994) used the medical component of the CPI to inflate costs. Scitovsky was working with national data, so this measure of price inflation was appropriate. The medical component of the CPI in South Africa is calculated on the price change of a basket of medical goods for the average South African household. Only about 6.8 million South Africans out of a total population of over 40 million people have private sector medical cover. The medical basket for the average South African household is very different from the basket of medical goods for the average South African household WITH private sector medical cover. The medical component of the CPI was thus seen to be inappropriate for adjusting costs in this study.
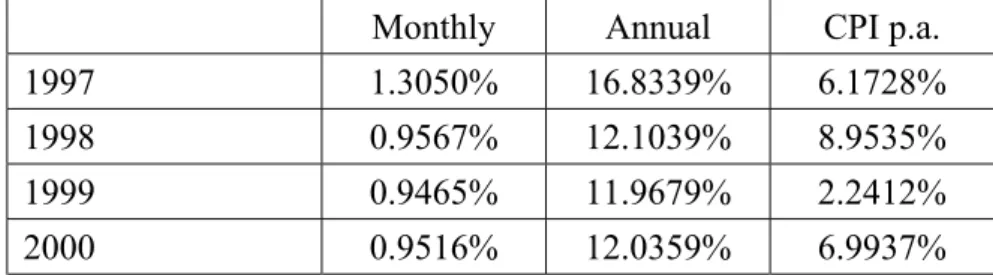
A price inflation factor for medical schemes is needed. Data on the contributions charged and benefits provided by all registered South African medical schemes from 1974 to 1999 was available. [Rama and McLeod, 2001] Total contributions per member per year were calculated and annual percentage increases were derived. These annual factors were converted into monthly increase factors for 1997, 1998 and 1999. 2000 Figures were not available. An increase factor for 2000 was estimated by analysing the series of factors from 1974 to 1999.
Table 12: Inflation factors derived from total contributions of all registered medical schemes
There is a significant difference between the rate of increase in contributions paid to private medical schemes and the rate of increase in the CPI.
There will be some error in the 2000 estimate. In order to reduce the impact of this error on inflation-adjusted costs, costs from 1997, 1998 and 1999 were inflated to 1 January 2000 using the calculated increase factors. Costs incurred in the 2000 calendar year were deflated to 1 January 2000 using the estimated increase factor for 2000. Hence the error in the estimated increase factor only affects costs incurred in the year 2000. The impact of the error is not the same for all costs. Costs are incurred throughout the year and are deflated with a monthly inflation rate. So, the compounding of the error in the monthly inflation rate is greater for costs arising later in the year than for costs arising early in the year.
3.4 Demographics of the Data
The schemes varied in the number of beneficiaries covered. The largest scheme covered a total of 67 132 beneficiaries and the smallest scheme covered 4 864 beneficiaries. This is shown in Table 13 below.
A crude death rate was calculated by dividing the number of deaths experienced by each scheme by the total number of beneficiaries covered during the study period. This rate was not stable across schemes. The schemes with the three highest death rates, Schemes E, B and D, had the highest average ages, 35, 62 and 27 years respectively.
Monthly Annual CPI p.a.
1997 1.3050% 16.8339% 6.1728%
1998 0.9567% 12.1039% 8.9535%
1999 0.9465% 11.9679% 2.2412%
0 5000 10000 15000 20000 25000 30000 0-1 1-5 5-10 10-15 15-20 20-25 25-30 30-35 35-40 40-45 45-50 50-55 55-60 60-65 65-70 70-75 75-80 80-85 85-90 90-95 95+ deaths alive total
Table 13: Demographics of the data set
For the purposes of establishing an age profile, ‘Age’ was calculated as the age in years and months on 1 January 1997, i.e. the start of the study period. The ‘Age’ of people entering the study after 1 January 1997 is the age at the date of entry into the scheme. This does introduce a timing difference between those in the scheme on 1 January 1997 and late entrants. Intuitively, the reader can think of ‘Age’ as the age at which the beneficiary entered the study.
Beneficiaries were classified into age categories spanning five-year age bands. The only exception is the 0-1 year or birth category. The age distribution of all beneficiaries is illustrated below.
Figure 5: Age distribution of beneficiaries in the data set
scheme beneficiaries deaths 'death/rate' average age
A 67132 374 0.00557111 24 B 6377 68 0.01066332 62 C 58864 293 0.00497758 25 D 44452 402 0.00904346 27 E 8125 183 0.02252308 35 F 33038 242 0.00732490 23 G 4864 24 0.00493421 24 H 20236 64 0.00316268 24 total 243088 1650 0.00678767 26
The number of people over the age of 30 covered by the data set, decreases exponentially as age increases.
There were a total of 1650 deaths that occurred during the study period. Four of these deaths occurred within the first five days of the 2001 calendar year. These deaths were included in the study since a full history of last-year-of-life costs was available. The deaths were allocated to the 2000 calendar year
Table 14: Number of deaths in schemes in each calendar year of the study period
All schemes experienced fewer deaths in the 2000 calendar year compared to the first three years of the study. The total number of deaths in the data set occurring in year 2000 accounts for 12.55% of the total number of deaths occurring over the four year period.
The age profile of beneficiaries who died during the study, according to age at date of death, is illustrated below.
Figure 6: Distribution of age at death for beneficiaries who died
scheme 1997 1998 1999 2000 total A 93 90 111 80 374 B 16 23 20 9 68 C 59 122 96 16 293 D 151 175 71 5 402 E 49 48 49 37 183 F 65 60 72 45 242 G 9 9 4 2 24 H 15 17 19 13 64 total 457 544 442 207 1650 0 20 40 60 80 100 120 140 160 180 0-1 1-5 5-10 10-15 15-20 20-25 25-30 30-35 35-40 40-45 45-50 50-55 55-60 60-65 65-70 70-75 75-80 80-85 85-90 90-95 95+ age category co u n t
The cause of death of beneficiaries has not been recorded. It is therefore difficult to ascertain whether the number of deaths in certain age categories is specific to the data or due to age specific mortality factors. A high number of deaths in the 0-1 age category are typically a result of premature births. [Central Statistical Service, 1995] It was not possible to ascertain how many of the deaths occurred amongst beneficiaries who were HIV+. Although the administrator estimates that 10% to 12% of the beneficiaries in the schemes may be HIV+, the period since becoming infected is not known. It is likely that a small number of deaths could have occurred amongst HIV+ beneficiaries, but the effect is likely to be small given the time period covered in the study. Should this study be repeated in future, the number of deaths due to AIDS is likely to increase.
Some of the beneficiaries in the data set incurred no claims over the four-year study period. Such cases were found for beneficiaries who survived the entire study period and for beneficiaries who died during the study period. These could be healthy individuals who use little or no medical services, or value the savings element of medical scheme membership more than having costs covered. It is possible that cause of death could be violence or an accident in those cases.
4. Healthcare Costs in the Last-Year-of-Life
4.1 Methodology
The last-year-of-life is defined as the twelve months before death. Overseas studies on healthcare costs at the end of life revealed interesting patterns among costs in this period. A methodology has been developed and applied to the data to see what emerges in the South African context.
The date of death was available for all beneficiaries who died. This was used to calculate the start date of the last-year-of-life. The start date of the last-year-of-life was defined as twelve months before the date of death, thus the last-year-of-life for someone dying on 1 July 1998 starts in July 1997. The exact start date was not used because cost data were recorded by year and month of service. If deaths are assumed to occur uniformly over any month, then this method overestimates the last year by an average of half a month.
Costs in the last-year-of-life were all costs with month of service the same as or after the start date of the last-year-of-life. As discussed in Section 3.1, there were a few cases in the data where month of service dates were past the date of death. These costs have been included in the last-year-of-life costs. The costs in the last-year-of-life of life may be a slight overestimate of the true last-year-of-life costs.
Costs were extracted for the years prior to the last-year-of-life in the same way. The start date of a specific ‘year-of-life’ was calculated. Then all costs incurred on or after this date, but before the start of the next year of life formed the costs in that year. The data set covered a four-year period. Data for the years prior to the last-year-of-life was not always complete as they often extended to before the start of the study period. Once again, if the data is not true month of service data, costs in the years prior to the last-year-of-life will under- or over-estimate the true cost in these years.
Within each year, costs were further classified according to age and the type of medical service for which it was incurred. ‘Age’ is age in years and months at the date of death.
Average costs in each age category and type of service classification were calculated by dividing total costs by the number of months of exposure divided by twelve. This generated a ‘per-person-per-year’ average. The average costs for the 0-1 year age category were calculated using counts of decedents. This was thought to better represent the average costs for beneficiaries in this age category, because they often do not survive a full twelve months. All of the beneficiaries in this age category were covered by the scheme from birth.
It was not unusual to come across beneficiaries with zero costs in the last-year-of-life and sometimes the entire study period. Possible reasons could be violent deaths of healthy persons and sudden deaths of young people, through for example car accidents.
R57 272.29 R17 918.47 R13 929.75 R15 010.56 0 20000 40000 60000 1345 819 344 84 co st in R
lyol 2lyol 3lyol 4lyol
4.2 Analysis of Results
Costs in the last-year-of-life were examined in four ways.
• Firstly, costs in the last-year-of-life were compared to average costs in other years of life.
• Average costs in the last-year-of-life were compared according to age at death
• Costs were then classified according to the type of healthcare services that were used
• Lastly, the number and ages of high cost deaths were identified
4.2.1 Average costs in the last-year-of-life
Average last-year-of-life (lyol) costs were compared to average costs in prior years of life, that is the second-last-year-of-life (2lyol), third-last-year-of-life (3lyol) and fourth-last-year-of-life. Data points in the fourth-last-year-of-life were sparse. The number of member years (total months exposure divided by twelve) are indicated on the graph below, for each year-of-life.
.
member years
Figure 7: Average medical costs for each year of life
Costs in the last-year-of-life were significantly higher than other years of life. There does not seem to be much difference in average costs in the second, third or fourth years before death.
The relationship between year of life and healthcare costs is much clearer when costs for each year are expressed relative to the year before.
3.20 1.29 0.93 0 1 2 3 4 year of life lyol/2lyol 2lyol/3lyol 3lyol/4lyol 0 10000 20000 30000 40000 50000 60000 70000 80000 90000 0-1 1-5 5-10 10-15 15-20 20-25 25-30 30-35 35-40 40-45 45-50 50-55 55-60 60-65 65-70 70-75 75-80 80-85 85-90 90-95 95+ age category co st in R
Figure 8: Average costs in each year-of-life, relative to the costs in the previous year
The average cost in the last-year-of-life was 3.2 times the cost in the second-last-year-of-life. In contrast, costs in the second-last-year-of-life were only 1.29 times costs in the third-last-year-of-life. Third-last-year-of-life costs were 0.93 times average costs in the fourth-last-year-of-life.
The last-year-of-life appears to be the most expensive medical year of life. The costs in any other year of life appear to be fairly stable from one year of life to the next.
4.2.2 Last-year-of-life costs according to age at death
The average costs above were developed from costs for all beneficiaries who died. American research shows that use of medical services at end of life varies according to age at death. [Scitovsky, 1984] Calculating average costs in the last year of life according to age at death illustrates whether this is so in this data set.
Figure 9: Average costs in the last-year-of-life according to age at death
The 50-55 year age category had the highest average cost in the last year of life. Costs are also high at the younger ages, more specifically under age 5. Minor peaks occur in the 35-40 and 65-70 year age categories.
The American studies suggest that last-year-life costs are higher at younger ages because more aggressive medical intervention is used to save younger lives. [Lubitz, Riley, 1993].
The 35-40 year age category peak could be a result of HIV/Aids related deaths. The average cost in the last-year-of-life clearly decreases with age as age increases past age 70. This reinforces the Medicare findings in the USA. The cost data here, as opposed to the Medicare studies, includes frail care and nursing home costs.
The credibility of this finding is limited by the sparseness of data at older ages.
4.2.3 Spending on different medical services in the last-year-of-life
The data shows that costs in the last-year-of-life are substantially higher than in prior years. Allocating costs according to the type of service for which they were incurred shows where the additional costs are being incurred.
Service costs have been split according to their benefit classification in medical schemes. The two major categories that have been used are pooled benefits and day-to-day benefits, with chronic medication in a separate class.
Figure 10: Cost incurred for services falling under pooled benefits
‘Hospital accounts’ are the biggest contributor to high last-year-of-life costs. Other major service components of last-year-of-life costs are hospital procedures and visits, hospital accommodation and other trauma-related costs.
0 2,000 4,000 6,000 8,000 10,000 12,000 14,000 16,000 18,000 hos pi ta l pr oc edur es & vi si ts radi ol ogy & pat hol ogy hos pi ta l acco m m . hos pi ta l ac count s phy si ot her apy ot her tr aum a dent al & opt ic al s ur g. sc ans appl ianc es fr ai l ca re /hos pi ce pos t op benef its cost in R lyol 2lyol 3lyol
Hospital accounts covers the following costs:
• theatre fees and equipment
• hospital medicines
• blood transfusions
• organ transplants
• confinements
• private hospitals: private ward
Trauma-related costs are high in the second-last-year of life as well. Post-operative benefits are high in the last-year-of-life and decrease over time away from death. The same pattern can be seen for radiology and pathology spending.
Figure 11: Average costs of chronic medication and ‘day-to-day’ services
It is evident from the graph above that absolute spending on almost all medical services is higher in the last-year-of-life. The exceptions are dental and optical services.
Spending on chronic and acute medication is high in all years of life. However, chronic medication accounts for only 3.59% of last-year-of-life costs. In the second-last-year-of-life chronic medication accounts for a higher, 9.15% of total costs and 11.04% in the third-last-year-of-life. Acute medication accounts for only 4.15% of last-year-of-life costs. However in the second and third-last-year-of-life acute medication accounts for 10.45% and 12.05% of average total costs respectively.
Healthcare needs change with age. It is therefore possible that the absolute amount spent on different services differs by age from the comprehensive pictures presented above.
To illustrate whether this is indeed the case, the four highest cost services in the last-year-of-life have been broken down according to age at death.
These services are: hospital procedures and visits, hospital accommodation, hospital accounts and other trauma-related costs. The age-usage of chronic and acute medication has also been investigated.
0 500 1,000 1,500 2,000 2,500 ch roni c med GP & S pe cia lis t R ad. & Pa th . D ent al Ac ut e med. phar mac is t opt ic al ot her R lyol 2lyol 3lyol
0 2,000 4,000 6,000 8,000 10,000 12,000 14,000 16,000 0-1 1-5 5-10 10-15 15-20 20-25 25-30 30-35 35-40 40-45 45-50 50-55 55-60 60-65 65-70 70-75 75-80 80-85 85-90 90-95 95+ age category co st in R
Figure 12: Spending on hospital procedures and visits in the last-year-of-life
An average of R73 816.18 was spent by beneficiaries in the 0-1 year age category in their last-year-of-life on hospital procedures and visits. The main cause of death in the under 1 year age category is premature birth. [Department of Health, 1997] It is therefore not surprising that beneficiaries in this age category incur high hospital costs.
The 45-50 year age category spent relatively little on hospital procedures and visits. Expenditure on hospital accommodation showed a different age distribution to hospital procedures and visits.
Figure 13: Expenditure on hospital accommodation in the last-year-of-life
0 5,000 10,000 15,000 20,000 25,000 30,000 35,000 40,000 45,000 50,000 55,000 60,000 65,000 70,000 75,000 0-1 1-5 5-10 10-15 15-20 20-25 25-30 30-35 35-40 40-45 45-50 50-55 55-60 60-65 65-70 70-75 75-80 80-85 85-90 90-95 95+ age category co st in R
0 2,000 4,000 6,000 8,000 10,000 12,000 14,000 0-1 1-5 5-10 10-15 15-20 20-25 25-30 30-35 35-40 40-45 45-50 50-55 55-60 60-65 65-70 70-75 75-80 80-85 85-90 90-95 95+ age category co st in R
Hospital accommodation costs were highest for the 0-1 year and 1-5 years age groups. The type of hospital ward in which the patient was accommodated influences this type of cost. Critical and intensive care wards are more expensive than general wards. Younger patients nearing the end of life are likely to be put in critical care, as medical intervention is high for young lives. [Lubitz and Riley, 1993]
While at hospital, costs accumulate in the form of theatre fees and equipment, medicines, blood transfusions and private ward fees. These are shown below under the blanket heading of hospital accounts. Also included under hospital accounts are the costs associated with organ transplants.
Figure 14: Average last-year-of-life costs incurred in hospital
Hospital accounts was the core cost component for most of the age categories. It accounts for 20% or more of last-year-of-life costs in all age categories except the 5-10 year (15.94%) and 45-50 year (18.09%) age categories.
Figure 15: Other trauma-related spending in the last-year-of-life
0 10,000 20,000 30,000 40,000 50,000 60,000 70,000 0-1 1-5 5-10 10-15 15-20 20-25 25-30 30-35 35-40 40-45 45-50 50-55 55-60 60-65 65-70 70-75 75-80 80-85 85-90 90-95 95+ age category co st i n R
0 500 1,000 1,500 2,000 2,500 3,000 3,500 4,000 0-1 1-5 5-10 10-15 15-20 20-25 25-30 30-35 35-40 40-45 45-50 50-55 55-60 60-65 65-70 70-75 75-80 80-85 85-90 90-95 95+ age category co st in R
High trauma costs in the 20-25 year age group reflects the high number of motor vehicle accident related deaths at these ages. Unnatural causes are among the main causes of death in South Africa. [Department of Health, 1997]. This seems to agree with the high percentage of last-year-of-life costs incurred for trauma related services. Trauma related expenditure fell to almost zero at the older ages. This seems reasonable, as older deaths are more likely to be due to natural causes and frailty. Overseas research has found that resuscitation efforts at older ages are not as intense as at younger ages. [Lubitz and Riley, 1993]
Chronic and acute medication made up a high proportion of costs in the second and third-last-year-of-life. The relationship between age and percentage spending on these
two medical costs is shown below.
Figure 16: Spending on chronic medication in the last-year-of-life
High spending on chronic medication appears to be concentrated past age 45, with the exception of the 10-15 year age group.
The age distribution of expenditure on acute medication is distinctly different form the age distribution of expenditure on chronic medication. All age categories, except the 15-20 year and 20-25 year age groups, spent more than R1000 on acute medication.
0 500 1,000 1,500 2,000 2,500 3,000 3,500 0-1 1-5 5-10 10-15 15-20 20-25 25-30 30-35 35-40 40-45 45-50 50-55 55-60 60-65 65-70 70-75 75-80 80-85 85-90 90-95 95+ age category co st in R
Figure 17: Spending on acute medication in the last-year-of-life
4.2.4 High cost deaths
The American studies found that relatively few decedents incurred very high medical costs in the year-of-life. [Scitovsky, 1984] Higher than average costs in the last-year-of-life would indicate more aggressive medical treatment during the last twelve months of life.
It is not clear as to what measure of ‘high’ should be utilised in determining high cost deaths. The number of beneficiaries, in this study, with total costs in the last-year-of-life in excess of increments of R100 000 has been expressed as a percentage of the total number of deaths (1650). The average last-year-of-life cost was R57 272. R100 000 represents 1.75 times the average last-year-of-life cost.
13.76 % of beneficiaries incurred costs in excess of R100 000 in their last-year-of-life. Of these beneficiaries, 4.55% had costs over R200 000. This is illustrated below. At the same time, it must be noted that there were beneficiaries with zero costs in the last year of life. 5.5% of the total number of beneficiaries who died during the study period incurred no claims during the period 1 January 1997 to 31 December 2000.
Figure 18: Percentage of beneficiaries with high costs in the last-year-of-life 1.76% 13.76% 4.55% 0.48% 0% 2% 4% 6% 8% 10% 12% 14% >R100 000 >R200 000 >R300 000 >R400 000
Total cost in last-year-of-life
% o f to ta l d e a th s
5. The Relationship between Decedent Costs
and Survivor Costs
Overseas studies found that in any calendar year, the healthcare costs incurred by people in their last-year-of-life was substantially higher than costs incurred by people not in their last-year-of-life. Studies on Medicare data found ratios of decedent costs to survivor costs in the order of 6.21 [Lubitz and Prihoda, 1984] and 6.92. [Lubitz and Riley, 1993]
5.1 Methodology
The data set in this study spans the years 1997 to 2000. The costs in each year have been allocated to ‘survivors’ or ‘decedents’. Survivors are beneficiaries not in their last-year-of-life. Decedents are beneficiaries who are in their last-year-of-life. The costs incurred in that part of each calendar year that is part of a beneficiary’s last-year-of-life are allocated to decedents. All other costs are allocated to survivors. The number of months for which the beneficiary has been part of the scheme is allocated in the same way as the costs, to either survivors or decedents. Average costs per member-year are then calculated. One member-year is equal to twelve months of membership in the scheme.
For this purpose, ‘Age’ is defined as the age in years and months on 1 January of each study year.
5.2 Ratio of Decedent Costs to Survivor Costs
The ratio of average decedent costs to average survivor costs was calculated for each year of the study period.
Figure 19: Ratio of average decedent costs to average survivor costs in each calendar year 10.01 31.62 15.92 12.20 0 5 10 15 20 25 30 1997 1998 1999 2000