Sounds Reset Rhythms of Visual Cortex
and Corresponding Human Visual Perception
Vincenzo Romei,
1,2,3,*
Joachim Gross,
1and Gregor Thut
1,*
1Institute of Neuroscience and Psychology, University of
Glasgow, 58 Hillhead Street, Glasgow G12 8QB, UK
2
Wellcome Trust Centre for Neuroimaging at UCL, Institute of
Neurology, 12 Queen Square, London WC1N 3BG, UK
3UCL Institute of Cognitive Neuroscience, 17 Queen Square,
London WC1N 3AR, UK
Summary
An event in one sensory modality can phase reset brain
oscil-lations concerning another modality [
1–5
]. In principle, this
may result in stimulus-locked periodicity in behavioral
per-formance [
6
]. Here we considered this possible cross-modal
impact of a sound for one of the best-characterized rhythms
arising from the visual system, namely occipital
alpha-oscilla-tions (8–14 Hz) [
7–9
]. We presented brief sounds and
concur-rently recorded electroencephalography (EEG) and/or probed
visual cortex excitability (phosphene perception) through
occipital transcranial magnetic stimulation (TMS). In a first,
TMS-only experiment, phosphene perception rate against
time postsound showed a periodic pattern cycling at
w
10 Hz
phase-aligned to the sound. In a second, combined TMS-EEG
experiment, TMS-trials reproduced the cyclical phosphene
pattern and revealed a
w
10 Hz pattern also for EEG-derived
measures of occipital cortex reactivity to the TMS pulses.
Crucially, EEG-data from intermingled trials without TMS
established cross-modal phase-locking of occipitoparietal
alpha oscillations. These independently recorded variables,
i.e., occipital cortex excitability and reactivity and EEG
phase dynamics, were significantly correlated. This shows
that cross-modal phase locking of oscillatory visual cortex
activity can arise in the human brain to affect perceptual
and EEG measures of visual processing in a cyclical manner,
consistent with occipital alpha oscillations underlying a rapid
cycling of neural excitability in visual areas.
Results
We hypothesized that a sound may phase-align oscillatory
alpha activity over occipital areas (typically around 8–14 Hz)
and thereby reveal cyclical influences of visual brain rhythms
on subsequent visual processing. We tested this by assessing
in two experiments reports of phosphene perception (using
occipital transcranial magnetic stimulation [TMS] as in [
10,
11
]) at various time points after a critical sound (
Figure 1
, right
panel) and by also measuring electroencephalography (EEG)
in the second experiment.
Experiment 1: Phosphene Perception Shows
w
10 Hz
Periodicity Time-Locked to the Presentation
of a Short Sound
The rate of phosphene perception for occipital TMS provides
an established measure of excitability for visual cortex. On
each trial of experiment 1, a single TMS pulse was delivered
at one of 19 time points between 30 and 300 ms postsound
or without a sound in the baseline condition. The results
re-vealed a cyclical pattern of phosphene perception rate,
time-locked to the critical sound (
Figure 1
, left panel). Percentage
of induced phosphenes differed significantly in relation to
sound onset (F(19,152) = 2.16; p = 0.005) with maximal values
(highest rate of phosphene perception) occurring in two time
windows (
Figure 1
, left panel). The first peak in phosphene
perception rate arose between 75 and 120 ms (reproducing
[
10
]) and the second peak between 180 and 225 ms (at
previ-ously unexplored delays). Comparing the TMS-only baseline
(no preceding critical sound, leftmost point in
Figure 1
, left
panel) with performance in windows centered on the apparent
‘‘alpha’’-like peaks and troughs confirmed enhanced
phos-phene perception in 75–120 ms and 180–225 ms windows
(Bonferroni corrected paired t tests: all p < 0.01). Phosphene
perception in 30–60 ms, 135–165 ms, and 255–300 ms
windows did not differ significantly from baseline, i.e., the
no-sound condition (all p > 0.33).
Thus, phosphene perception followed a cyclical pattern
(best-fitting sine wave: 9.6 Hz, Rsquare: 82% of variance
ex-plained), with roughly
w
100 ms peak-to-peak interval,
consis-tent with the
w
10 Hz nature of occipitoparietal alpha activity,
previously linked to visual perception [
12–21
]. Because the
phosphene data in
Figure 1
(left panel) are all time locked to
the critical sound, this suggests a possible phase locking
of the perceptually relevant, occipitoparietal alpha activity by
the critical sound.
Experiment 2: Phosphene Perception Correlates
with Phase Dynamics of Occipital Alpha Activity
after Phase Locking to the Sound
In experiment 2, we acquired concurrent EEG in the same
paradigm and the same participants as in experiment 1, but
with fewer TMS time points (now 7 rather than 19, see
Experi-mental Procedures
) to allow more trials in each condition for
EEG analysis and a higher proportion (1/8) of no-TMS trials.
Phosphene perception rates were highly correlated between
experiments 1 and 2 (r(7) = 0.90; p < 0.003), for the
sound-TMS relations that were in common between these two
studies, i.e., experiment 2 essentially reproduced the
w
10 Hz
cyclical pattern of phosphene perception of experiment 1 (see
below for more detailed analysis of this pattern). We next
analyzed EEG data from experiment 2, initially for sound-only
trials (no TMS) because these can provide a pure measure of
phase locking of EEG activity to the critical sound in the
absence of TMS (thus without any associated visual percept).
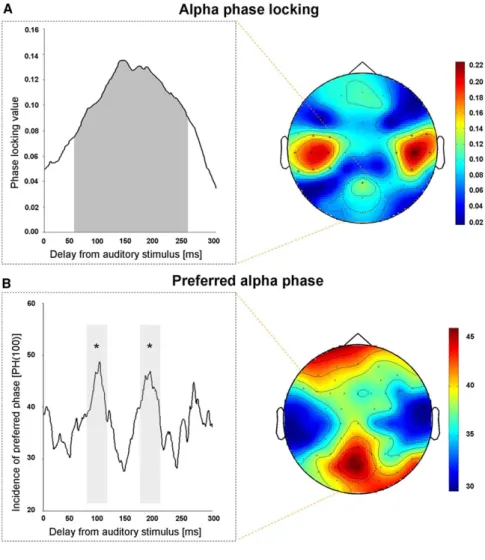
Significant 10 Hz phase locking (p < 0.001) to the critical sound
was evident not only for sensors overlaying auditory cortex
but also over parieto-occipital cortex, from 50 ms to 250 ms
following auditory stimulus onset (
Figure 2
A). Note that none
of the frontal electrodes showed significant phase locking.
We then calculated the number of trials showing a phase
for parieto-occipital electrodes within
6
10 degrees of the
preferred phase at 100 ms (the time point postsound at which
phosphene rate peaked in experiment 1). This measure
showed a cyclical pattern, being significantly higher not only
*Correspondence: [email protected] (V.R.), [email protected]around 100 ms (by definition) but also around 200 ms after the
sound, as compared to the 150 ms delay or the no-sound
baseline (all p < 0.05, Bonferroni corrected); see
Figure 2
B.
This pattern is strikingly reminiscent of the phosphene rate
data from the previous experiment (
Figure 1
) and the
corre-lated phosphene perception rate of the new experiment.
For another view on the same data and to better illustrate the
relationship of EEG phase with phosphene perception, we
plotted the alpha-phase dynamics over time since sound
onset against the phosphene rate over time (
Figure 2
C) and
calculated correlation coefficients. The red dots and line in
Fig-ure 2
C plot phosphene perception rate for different time points
in experiment 1 (taken from
Figure 1
, left panel) against the
preferred phase [PH(100)] EEG data for the same time points
in experiment 2 (from
Figure 2
B). The black dots and line in
Figure 2
C plot the corresponding phosphene rate data from
experiment 2, against the same preferred phase EEG data.
Alpha-phase dynamics (EEG data on no-TMS trials from
experiment 2) were significantly correlated with the
corre-sponding phosphene rate in the separate experiment 1
(r(18) = 0.65 p < 0.003, red dots and line); and also with the
phosphene rate for TMS trials in the same experiment 2
(r(6) = 0.96; p < 0.0008, black dots and line).
Control analysis showed that the relationship between
sound-locked occipitoparietal activity and cyclic phosphene
perception rate is limited to the alpha band, because there
was no comparable effect in other frequency bands above
and below alpha activity (for further results and discussion
see
Supplemental Information
: Control Analysis in Nonalpha
Flanker Frequency Bands and
Figure S1
). This therefore
supports phase locking of posterior alpha activity as the
underlying cause of the periodicity of perception.
Individual Phosphene Perception Frequency Correlates
with Individual Alpha Frequency
To further examine the link between periodicity in phosphene
perception and cyclic brain activity over posterior areas,
we related the periodicity of phosphene perception to the
frequency of ongoing EEG alpha activity that is prominently
observed at baseline (prior to sound onset). We obtained
a significant correlation between the frequency of best-fitting
sinusoids in individual phosphene perception rates and the
individual alpha frequency (IAF), the latter estimated from
pre-sound EEG recordings (r = 0.67; p = 0.024, see
Supplemental
Information
: Correlation between Periodicity in Phosphene
Perception and Individual Alpha Frequency and
Figure S2
).
This therefore provides a further piece of evidence that the
sound-locked cyclic behavior in phosphene perception is
linked to alpha oscillations.
Phosphene Perception Correlates with EEG-Probed Visual
Cortex Reactivity
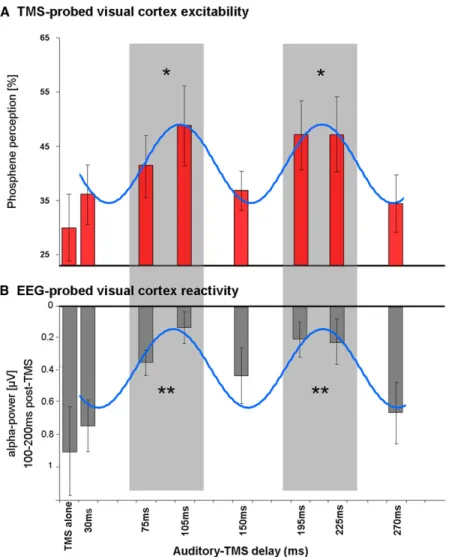
Finally, we turn to the EEG-TMS trials from experiment 2. Rate
of phosphene perception for occipital TMS at the seven time
points after the sound (plus no-sound baseline) is shown in
Figure 3
A, illustrating its cyclical pattern (blue sinusoid
repre-sents best fitting sine wave; 9.1 Hz, Rsquare: 96% of variance
explained). Phosphene rate varied in relation to the sound
(F(7,56) = 2.77; p = 0.015), being higher at 75–105 ms delays,
then again at 195–225 ms, as compared to TMS without any
preceding sound (all p < 0.05 on Bonferroni corrected t test).
This reproduces the cyclical phosphene finding from
experi-ment 1. Using EEG data on the same trials, we then estimated
visual cortex reactivity to the TMS pulse as a function of delay
from sound onset (and thus analogous to the phosphene rate
Figure 1. Paradigm and Results of Experiment 1Right panel shows schematic of the paradigm, illustrating TMS over occipital cortex in blindfolded participants (plus concurrent EEG recordings for exper-iment 2). TMS was applied at 85% of phosphene threshold, after different delays following a salient sound, or with no sound in baseline condition. Left panel shows percentage of trials with TMS-induced phosphene reported (6SEM), against delay since sound onset, for experiment 1. Leftmost point is no-sound baseline (BSL). The shaded areas (75–120 ms and 180–225 ms) represent windows of significantly increased visual cortex excitability by auditory input, i.e., phosphene rate > BSL, **p < 0.01 Bonferroni corrected. Note the periodicity of phosphene perception over time, which cycles at around 10Hz (w100 ms peak-to-peak).
analysis). To this end, we calculated for each condition
event-related alpha power changes over occipitoparietal
sensors, a measure of visual induced activity (cf. [
22
].), in a
time window for which phosphene perception-related activity
Figure 2. Alpha Phase Locking for No-TMS Trials in Experiment 2
(A) Instantaneous EEG phase, time locked to sound onset, was computed with the Hilbert transform after applying a band-pass filter (8– 14 Hz). Right panel shows the 10 Hz phase-lock-ing topography, with the effect evident in sensors overlaying not only auditory but also highlighted parieto-occipital cortex. Left panel depicts 10 Hz phase-locking for highlighted parieto-occipital sensors, which was significant (p < 0.001) between 50 ms and 250 ms following auditory stimulus onset (shaded window). (B) Preferred alpha phase at 100 ms delay. Cir-cular statistics were used to estimate PH(100), the mean instantaneous phase at 100 ms post sound (the time of highest sound-induced enhancement of phosphene detection rate in experiment 1). The number of trials within610 degrees of PH(100) is shown at left against time since sound, with corresponding topography at right. Note that the fluctuation in number of trials showing preferred phase PH(100) peaks not only at 100 ms (by definition), but also at around w200 ms, with the resulting cyclical pattern closely resembling the periodicity of perceived phosphene rate shown inFigure 1, in terms of peak-to-peak interval and peak latencies (i.e., frequency and phase). The shaded windows highlight that PH(100) not only at 100 ms (620 m) but also at 200 ms (620) was significantly higher than baseline (BSL) or the 150 delay (620ms), all *p < 0.05 Bonferroni corrected. (C) EEG-phosphene correlation for separate datasets from experiments 1 and 2 (same partic-ipants). Scatterplot with red points and red line shows that the number of no-TMS EEG trials showing a phase within PH(100) at 19 equally spaced time points in the window 30 ms to 300 ms (experiment 2) correlates with the corre-sponding phosphene rates (scored along right axis) from separate experiment 1 (Figure 1). Please note the baseline (no-sound) condition was not considered in this analysis, as a time window relative to sound onset cannot be set for the preferred-phase EEG measure without a sound. Scatterplot with black points and black line shows a similar correlation between phos-phene perception rate on the TMS trials in exper-iment 2 (scored along left axis) and dynamics of preferred phase for no-TMS trials in the same experiment.
has previously been reported ([
23
];
i.e., 100–200 ms post-TMS), relative to
presound baseline (see
Experimental
Procedures
). Note that alpha power is
considered to be inversely related to
visual cortex activity (smaller values
indicate higher reactivity; e.g., [
22
])
and hence might also show a cyclical
pattern that could relate to that found
for phosphene perception. As
Fig-ure 3
B shows, this pattern was indeed
confirmed. There was a significant cyclical pattern in relation
to sound onset also for EEG-probed visual cortex reactivity
(F(7,56) = 5.91; p < 0.00005, blue sinusoid represents best
fitting sine wave; 8.6 Hz, Rsquare: 81% of variance explained).
Visual cortex reactivity was significantly higher (corresponding
to reduced alpha power) between 75–105 and 195–225 ms
after the sound, as compared to the no-sound baseline, or to
the 30, 150, or 270 ms delays (all p < 0.05 on Bonferroni
cor-rected t tests). Again, for another view on the same data, we
correlated EEG-probed visual cortex reactivity with the rate
Figure 3. Results for TMS-EEG Trials in Experiment 2 (A) TMS-probed visual cortex excitability as indexed by rate of phosphene perception, for the eight conditions (6SEM) relative to a preceding sound (baseline with no sound, plus seven delays after sound). Note the cyclical pattern, with significantly more phosphene reports arising within the two shaded time windows (significantly greater than baseline = no sound, *p < 0.05 Bonferroni corrected t tests).
(B) EEG-probed visual cortex reactivity to the TMS pulses (6SEM). Visual cortex reactivity is estimated by alpha-power changes in a post-TMS time window (TMS locked), as a function of delay relative to critical sound. High reactivity is indicated by low alpha values and low reactivity by high alpha values (y axis; note the inverse scaling with low alpha values plotted upwards and high values downwards). The shaded areas (75–105 ms and 195–225 ms delays after sound) represent windows of significantly enhanced visual cortex reactivity (reduced parieto-occipital alpha activity) after a TMS pulse (i.e., reactivity significantly above baseline, **p < 0.015 Bon-ferroni corrected t tests). Note the periodicity in visual cortex reactivity that is once again found to cycle at aroundw10Hz.
(C) Scatterplot showing the close relation between rate of phosphene perception and visual cortex reactivity for each TMS condition in experiment 2.
of phosphene perception across conditions
within the same experiment 2. Results of this
correlation showed that phosphene
percep-tion increased with visual cortex reactivity
(i.e., as alpha power decreased) (r(7) =
2
.95,
p < 0.0003); see
Figure 3
C.
Discussion
These results indicate that a sound can phase
lock alpha oscillations in human visual cortex,
with direct consequences for perception as
assessed with the phosphene measure. The
rate of phosphene perception in experiment
1 showed a rapidly cycling pattern against
time after sound onset (
Figure 1
), with two
peaks of increased visual cortex excitability
separated by
w
100 ms. EEG data acquired
in experiment 2 after the same sound, on
no-TMS trials, showed alpha phase locking
not only over auditory cortex but also for
posterior parietal-occipital sites implicating
visual cortex (
Figure 2
A). The number of
trials showing the preferred phase at 100 ms
[PH(100)] also showed a cyclical pattern
against time since sound onset (
Figure 2
B),
peaking not only at 100 ms after the sound
(by definition) but also at
w
200 ms, to produce
a pattern that closely resembled the separate
phosphene perception data (
Figure 1
). This
remarkable similarity was evident in the
correlation between these independently recorded variables
from separate trials but of the same participants (
Figure 2
C,
red dots and line). Finally, the TMS trials during EEG also
revealed a cyclical pattern for TMS-probed phosphene
perception (
Figure 3
A) and for EEG-probed visual cortex
reactivity (using a measure of TMS-locked EEG changes at
occipitoparietal sensors;
Figure 3
B), with these two measures
correlating significantly (
Figure 3
C). Because the relationship
between EEG-phase dynamics and phosphene perception
rate were confined to the alpha-frequency band, and because
the frequency of ongoing alpha oscillations matched the
best-fitting frequency in the phosphene data, we conclude
that the periodicity in phosphene perception reflects those of
intrinsic brain rhythms. Note that the observed phase locking
to the sound may either result from phase reset of ongoing
oscillations, or this activity being evoked by the sound. This
being said, the two alternative explanations may not be
unequivocally dissociable on empirical grounds (for a detailed
discussion, see [
24
]). But crucially, the key novel aspect
of our study is the consistent finding of cyclical visual
phenomena in both perceptual and EEG measures after sound
onset, indicating a cross-modally triggered phase locking of
perceptually relevant oscillatory alpha activity over
occipito-parietal areas.
Several authors have proposed that the phase of ongoing
EEG activity cycling in specific frequency bands (typically
between 7 and 10 Hz, so overlapping with alpha activity) may
implement a periodic sampling mechanism for perception
[
9, 25–27
], and determines visual processing in addition to
alpha power [
9, 12–17
]. Recent EEG studies indicate a
correla-tive relation between prestimulus alpha phase and subsequent
visual perception [
17–20
] or visual cortical excitability [
21
].
Here we build on but go beyond such work to show that
mere onset of a salient sound can phase-lock human visual
alpha phase, realigning periodic sampling with direct
conse-quences for human perception, as indicated by changes in
phosphene perception. Because manipulating phase also
modulates perception, we infer that phase causally underlies
visual cortex excitability, rather than representing a
by-product. By experimental design, we also provide information
on causal directionality: because the interrelated phase
dynamics of brain oscillations and cortical excitability were
measured in separate trials, we can exclude that the
periodicity of perception has caused alpha-band activity;
rather, we conclude that electrophysiological activity underlies
the perceptual fluctuations and not vice versa.
Our results cannot be readily explained by the sound merely
serving as a warning signal to produce temporal expectancies
of when TMS (and/or visual percepts) might arise. The different
time intervals after sound onset were equally likely. Although
participants might potentially estimate a central tendency of
this temporal distribution, this would not explain the cyclic
pattern, i.e., the two distinct ‘‘peaks’’ shown in Figures
1
,
2
B,
and
3
A and 3B, each separated by approximately
w
100 ms
(i.e., at around alpha frequency). Application of TMS itself is
associated with an unavoidable ‘‘click’’ sound, but this was
equivalent across all TMS-present conditions. Moreover we
observed phase locking of parieto-occipital alpha by the
critical additional sound, even when no TMS was presented
(
Figures 2
A and 2B).
Recent research of cross-modal influences on visual
pro-cessing has shown that sounds can modulate visual
phos-phene perception [
10, 11, 28
], but the neural basis of this
was not identified, whereas here we uncovered phase locking
of posterior alpha oscillations. Our new results are consistent
with pioneering work using invasive recordings in animals
[
1–3
], which has shown that phase alignment of one modality
by another, in early sensory cortex, is an important mechanism
for interrelating processing between different senses. Here
we establish this for phase alignment of visual alpha in the
human brain, and for its impact on conscious perception, for
the first time.
Our results also add to the emerging literature on
develop-ment of causal interventions for manipulating brain rhythms
in humans (e.g., via rhythmic bursts of TMS [
16, 29–34
]; via
transcranial direct or alternating current stimulation [
35–40
])
or in animals via invasive stimulation [
41
]. Our new results
imply that the very simple manipulation of merely presenting
a salient sound can causally impact upon visual oscillations
and related visual perception and can thereby serve for
exper-imental control of brain oscillations to probe their functional
roles.
Experimental Procedures Participants
Nine participants (mean age: 29.33 years, range: 22–42), six women, gave written informed consent in accord with local ethics to take part in both experiments, on separate days. For further details see Supplemental Information.
TMS
Illusory visual percepts (phosphenes) were induced by TMS over the occipital pole via a 70 mm figure-of-eight TMS coil, connected to a Magstim Rapid2 Transcranial Magnetic Stimulator (Magstim Company, Spring Gardens, UK). An appropriate TMS site and intensity for inducing phos-phenes in each individual were established in separate sessions prior to the main experiments (seeSupplemental Information). For experiment 1, TMS was applied at 85% of predetermined phosphene threshold (PT), which corresponded to 60.63% (62.65) of maximal stimulator output (MSO). The occipital TMS site was on average (6SEM) 2.8160.15 cm above the inion and 0.86.60.17 cm left of midline. For experiment 2, the site was identical but PT was reassessed to take into account the increased distance between coil and skull dictated by the EEG cap. The 85% PT yielded an intensity of 63.56% (63.79) MSO. Participants were blindfolded during all test blocks. For further details seeSupplemental Information.
Experiment 1
The critical salient auditory stimulus was a 14 ms duration 900 Hz pure tone (75 dB sound pressure level [SPL] at the ear; 44,100 kHz sampling rate) presented through two loudspeakers in front of the participants (as in [10]). TMS was applied at one of several delays after sound onset (between 30 and 300 ms in steps of 15 ms, thus for a total of 19 time delays, plus no-sound baseline on 5% of trials). Participants were instructed that in most trials a brief sound would be presented around TMS pulse delivery. Although it was stressed that the sound is irrelevant to the task (reporting phosphenes), the sound nevertheless served as a warning cue for the forthcoming TMS pulse whose delivery was expected to induce phos-phenes at an invariant location but at an unpredictable time point. Twenty trials were assessed per equiprobable, intermingled condition in each participant.
Experiment 2
The protocol was identical to experiment 1, except: (1) EEG was recorded from 64 channels; (2) possible delays between sound onset and TMS were now 30, 75, 105, 150, 195, 225, or 270 ms, whereas the remaining 1/8 of trials were sound only. Ninety-six trials were assessed per equiprob-able intermingled condition. For further details on both experiments, see Supplemental Information.
EEG Apparatus
EEG was recorded with a TMS-compatible BrainAmp 32 MR Plus unit (BrainProducts GmbH, Munich, Germany) and digitized at 5,000 Hz sampling rate (band-pass filtered at 0.01–1,000 Hz) from 64 scalp elec-trodes. Contact impedance was kept below 10 kOhm. TMS-compatible Ag/AgCl pellet pin electrodes (Easy cap GmbH, Germany) were mounted on the cap.
EEG Analysis in Experiment 2
For the no-TMS trials, instantaneous EEG phase time locked to onset of the auditory stimulus was computed with the Hilbert transform, after applying a band-pass filter (fourth-order butterworth filter, 8–14 Hz). Trials were
pooled across participants and the distribution of phase across trials was tested for deviation from uniform distribution with the Rayleigh test. Circular statistics (using CircStat, [42]) were used to estimate PH(100), the mean instantaneous phase at 100 ms postsound (the time of highest, sound-induced enhancement of phosphene rate in experiment 1; seeFigure 1, left panel). The number of trials showing a phase within610 degrees of PH(100) was counted at 19 equally spaced time points in the window 30 ms to 300 ms, and the resulting time series was correlated with the mean phosphene detection rate from experiments 1 and 2.
For TMS-trials, EEG epochs between +20 ms (hence well beyond the brief TMS artifact, see [29]) and +500 ms after TMS stimulation, or between 2500 and220 ms preceding sound presentation (latter used for baseline correction), at each time delay after sound onset were band-pass filtered in the alpha range (8–14 Hz), then rectified. Alpha power values were then averaged across trials for each individual in each condition for a 100 ms critical time window extending from +100 to +200 ms after the TMS pulse [23], then baseline corrected to the corresponding cross-trial average in a presound interval. This procedure calculates event-related alpha changes and reflects visual cortex reactivity when computed for occipitoparietal sensors in response to visual input [22], or in response to the occipital TMS (see also [23]). For further details on EEG analysis, seeSupplemental Information.
Supplemental Information
Supplemental Information includes two figures, Supplemental Results and Discussion, and Supplemental Experimental Procedures and can be found with this article online atdoi:10.1016/j.cub.2012.03.025.
Acknowledgments
This work was supported by the Biotechnology and Biological Sciences Research Council (BB/I006494/1) and the Wellcome Trust (084067, 091928). We would like to pay tribute to Jon Driver for his invaluable support and inspiration and for his help with a previous version of this manuscript. Received: January 11, 2012
Revised: March 1, 2012 Accepted: March 13, 2012 Published online: April 12, 2012 References
1. Lakatos, P., O’Connell, M.N., Barczak, A., Mills, A., Javitt, D.C., and Schroeder, C.E. (2009). The leading sense: supramodal control of neurophysiological context by attention. Neuron64, 419–430. 2. Lakatos, P., Chen, C.M., O’Connell, M.N., Mills, A., and Schroeder, C.E.
(2007). Neuronal oscillations and multisensory interaction in primary auditory cortex. Neuron53, 279–292.
3. Lakatos, P., Karmos, G., Mehta, A.D., Ulbert, I., and Schroeder, C.E. (2008). Entrainment of neuronal oscillations as a mechanism of atten-tional selection. Science320, 110–113.
4. Thorne, J.D., De Vos, M., Viola, F.C., and Debener, S. (2011). Cross-modal phase reset predicts auditory task performance in humans. J. Neurosci.31, 3853–3861.
5. Naue, N., Rach, S., Stru¨ber, D., Huster, R.J., Zaehle, T., Ko¨rner, U., and Herrmann, C.S. (2011). Auditory event-related response in visual cortex modulates subsequent visual responses in humans. J. Neurosci.31, 7729–7736.
6. Fiebelkorn, I.C., Foxe, J.J., Butler, J.S., Mercier, M.R., Snyder, A.C., and Molholm, S. (2011). Ready, set, reset: stimulus-locked periodicity in behavioral performance demonstrates the consequences of cross-sensory phase reset. J. Neurosci.31, 9971–9981.
7. Klimesch, W., Sauseng, P., and Hanslmayr, S. (2007). EEG alpha oscillations: the inhibition-timing hypothesis. Brain Res. Brain Res. Rev.53, 63–88.
8. Palva, S., and Palva, J.M. (2007). New vistas for alpha-frequency band oscillations. Trends Neurosci.30, 150–158.
9. Mathewson, K.E., Lleras, A., Beck, D.M., Fabiani, M., Ro, T., and Gratton, G. (2011). Pulsed out of awareness: EEG alpha oscillations represent a pulsed-inhibition of ongoing cortical processing. Front Psychol.2, 99.
10. Romei, V., Murray, M.M., Merabet, L.B., and Thut, G. (2007). Occipital transcranial magnetic stimulation has opposing effects on visual and
auditory stimulus detection: implications for multisensory interactions. J. Neurosci.27, 11465–11472.
11. Romei, V., Murray, M.M., Cappe, C., and Thut, G. (2009). Preperceptual and stimulus-selective enhancement of low-level human visual cortex excitability by sounds. Curr. Biol.19, 1799–1805.
12. Hanslmayr, S., Aslan, A., Staudigl, T., Klimesch, W., Herrmann, C.S., and Ba¨uml, K.H. (2007). Prestimulus oscillations predict visual perception performance between and within subjects. Neuroimage37, 1465–1473. 13. van Dijk, H., Schoffelen, J.M., Oostenveld, R., and Jensen, O. (2008). Prestimulus oscillatory activity in the alpha band predicts visual discrimination ability. J. Neurosci.28, 1816–1823.
14. Romei, V., Brodbeck, V., Michel, C., Amedi, A., Pascual-Leone, A., and Thut, G. (2008). Spontaneous fluctuations in posterior alpha-band EEG activity reflect variability in excitability of human visual areas. Cereb. Cortex18, 2010–2018.
15. Romei, V., Rihs, T., Brodbeck, V., and Thut, G. (2008). Resting electroen-cephalogram alpha-power over posterior sites indexes baseline visual cortex excitability. Neuroreport19, 203–208.
16. Romei, V., Gross, J., and Thut, G. (2010). On the role of prestimulus alpha rhythms over occipito-parietal areas in visual input regulation: correlation or causation? J. Neurosci.30, 8692–8697.
17. Mathewson, K.E., Gratton, G., Fabiani, M., Beck, D.M., and Ro, T. (2009). To see or not to see: prestimulus alpha phase predicts visual aware-ness. J. Neurosci.29, 2725–2732.
18. Busch, N.A., Dubois, J., and VanRullen, R. (2009). The phase of ongoing EEG oscillations predicts visual perception. J. Neurosci.29, 7869–7876. 19. Busch, N.A., and VanRullen, R. (2010). Spontaneous EEG oscillations reveal periodic sampling of visual attention. Proc. Natl. Acad. Sci. USA107, 16048–16053.
20. Hoogenboom, N., and Romei, V. (2010). Probing different time-scales of oscillatory fluctuations in visual awareness: from behavior to phase. Front Hum. Neurosci.4, 178.
21. Dugue´, L., Marque, P., and VanRullen, R. (2011). The phase of ongoing oscillations mediates the causal relation between brain excitation and visual perception. J. Neurosci.31, 11889–11893.
22. Pfurtscheller, G., and Lopes da Silva, F.H. (1999). Event-related EEG/MEG synchronization and desynchronization: basic principles. Clin. Neurophysiol.110, 1842–1857.
23. Taylor, P.C., Walsh, V., and Eimer, M. (2010). The neural signature of phosphene perception. Hum. Brain Mapp.31, 1408–1417.
24. Sauseng, P., Klimesch, W., Gruber, W.R., Hanslmayr, S., Freunberger, R., and Doppelmayr, M. (2007). Are event-related potential components generated by phase resetting of brain oscillations? A critical discussion. Neuroscience146, 1435–1444.
25. VanRullen, R., and Koch, C. (2003). Is perception discrete or contin-uous? Trends Cogn. Sci. (Regul. Ed.)7, 207–213.
26. VanRullen, R., Carlson, T., and Cavanagh, P. (2007). The blinking spotlight of attention. Proc. Natl. Acad. Sci. USA104, 19204–19209. 27. VanRullen, R., Reddy, L., and Koch, C. (2005). Attention-driven discrete
sampling of motion perception. Proc. Natl. Acad. Sci. USA102, 5291– 5296.
28. Bolognini, N., Senna, I., Maravita, A., Pascual-Leone, A., and Merabet, L.B. (2010). Auditory enhancement of visual phosphene perception: the effect of temporal and spatial factors and of stimulus intensity. Neurosci. Lett.477, 109–114.
29. Thut, G., Veniero, D., Romei, V., Miniussi, C., Schyns, P.G., and Gross, J. (2011). Rhythmic TMS causes local entrainment of natural oscillatory signatures. Curr. Biol.21, 1176–1185.
30. Klimesch, W., Sauseng, P., and Gerloff, C. (2003). Enhancing cognitive performance with repetitive transcranial magnetic stimulation at human individual alpha frequency. Eur. J. Neurosci.17, 1129–1133.
31. Sauseng, P., Klimesch, W., Heise, K.F., Gruber, W.R., Holz, E., Karim, A.A., Glennon, M., Gerloff, C., Birbaumer, N., and Hummel, F.C. (2009). Brain oscillatory substrates of visual short-term memory capacity. Curr. Biol.19, 1846–1852.
32. Romei, V., Driver, J., Schyns, P.G., and Thut, G. (2011). Rhythmic TMS over parietal cortex links distinct brain frequencies to global versus local visual processing. Curr. Biol.21, 334–337.
33. Romei, V., Thut, G., Mok, R., Schyns, P.G., and Driver, J. (2012). Causal implication by rhythmic TMS of alpha frequency in feature-based local versus global attention. Eur. J. Neurosci.35, 968–974.
34. Thut, G., and Miniussi, C. (2009). New insights into rhythmic brain activity from TMS-EEG studies. Trends Cogn. Sci. (Regul. Ed.)13, 182–189.
35. Pogosyan, A., Gaynor, L.D., Eusebio, A., and Brown, P. (2009). Boosting cortical activity at Beta-band frequencies slows movement in humans. Curr. Biol.19, 1637–1641.
36. Feurra, M., Bianco, G., Santarnecchi, E., Del Testa, M., Rossi, A., and Rossi, S. (2011). Frequency-dependent tuning of the human motor system induced by transcranial oscillatory potentials. J. Neurosci.31, 12165–12170.
37. Feurra, M., Paulus, W., Walsh, V., and Kanai, R. (2011). Frequency specific modulation of human somatosensory cortex. Front Psychol. 2, 13.
38. Marshall, L., Helgado´ttir, H., Mo¨lle, M., and Born, J. (2006). Boosting slow oscillations during sleep potentiates memory. Nature444, 610–613. 39. Kanai, R., Chaieb, L., Antal, A., Walsh, V., and Paulus, W. (2008).
Frequency-dependent electrical stimulation of the visual cortex. Curr. Biol.18, 1839–1843.
40. Zaehle, T., Rach, S., and Herrmann, C.S. (2010). Transcranial alternating current stimulation enhances individual alpha activity in human EEG. PLoS ONE5, e13766.
41. Ozen, S., Sirota, A., Belluscio, M.A., Anastassiou, C.A., Stark, E., Koch, C., and Buzsa´ki, G. (2010). Transcranial electric stimulation entrains cortical neuronal populations in rats. J. Neurosci.30, 11476–11485. 42. Berens, P. (2009). CircStat: A Matlab Toolbox for Circular Statistics. J.