Worcester Polytechnic Institute
Digital WPI
Interactive Qualifying Projects (All Years) Interactive Qualifying Projects
March 2014
The 15-40 Connection Tutorial through
ASSISTments: Use of Proactive Knowledge in
Control vs Experiment
Amaia L. Gritsko Worcester Polytechnic Institute Jessica Meredith Sacks Worcester Polytechnic Institute Rachel Helen Pineda Worcester Polytechnic Institute
Follow this and additional works at:https://digitalcommons.wpi.edu/iqp-all
This Unrestricted is brought to you for free and open access by the Interactive Qualifying Projects at Digital WPI. It has been accepted for inclusion in Interactive Qualifying Projects (All Years) by an authorized administrator of Digital WPI. For more information, please [email protected]. Repository Citation
Gritsko, A. L., Sacks, J. M., & Pineda, R. H. (2014).The 15-40 Connection Tutorial through ASSISTments: Use of Proactive Knowledge in Control vs Experiment. Retrieved fromhttps://digitalcommons.wpi.edu/iqp-all/58
The 15-40 Connection Tutorial through ASSISTments:
Use of Proactive Knowledge in Control VS Experiment
Interactive Qualifying Project Report Submitted to the Faculty of Worcester Polytechnic Institute In Fulfillment of the Degree of the Bachelor of Science
Submitted by:
Amaia Gritsko, Rachel Pineda, Jessica Sacks March 6, 2014
I. Abstract
A team of three students worked with 15-40 Connection to help the organization accomplish their mission of raising awareness about the advantages of early cancer detection. The purpose of this tutorial is to motivate individuals to take responsibility for their health because cancer rates have not shown improvements since 1975. Through the use of a Control vs. Experiment test a tutorial was created using the problem set software of ASSISTments to prove whether or not the introduction of being proactive towards one’s health changed the responses the students gave for the final questions of the tutorial. The study focused on the awareness that comes with knowing how a person’s body behaves and what health ailments could later develop into cancer, and what steps to take to help improve survival rates for teens and young adults. The results from the statistical analysis prove that the responses from the students in the experiment had higher averages of correct answers than those in the control group.
II. Acknowledgments
First and foremost, we would like to thank Neil Heffernan for advising this extraordinary project, allowing us to participate in a special and fulfilling IQP experience. We would also like to thank Cristina Heffernan and Korinn Ostrow for their assistance through ASISSTments process and meeting with us to make sure that the tutorial was completed and compatible with ASSISTments. We would also like to thank Sandy Foster, Tricia Laursen, and Brittany Geoffroy from 15-40
Connection for guiding us over the course of the project by providing us with a detailed clarification of the 15-40 Connection message and giving us guidance on the material they wanted included in this project.
III. Table of Contents Abstract 2 Acknowledgments 3 Table of Contents 4 Introduction 5 Cancer 5 15-40 Connection 7 ASSISTments 8
Last Year’s Data 10
Project Goals 14
Materials and Methods 16
Weekly Meetings 16
Software 18
ASSISTments 20
Tutorial Timing 25
Reaching Out 26
Creating an ASSISTments Account 28
Description of Study 31
Results/Analysis of Data 34
Open Response Data 37
Statistical Data Analysis of Pre and Post Test 40
Statistical Data Analysis of Open Responses 45
Discussion 48
References 50
Appendix I: ASSISTments Preliminary Tutorial Slides 51
Appendix II: ASISSTments Final Tutorial Slides 62
Appendix III: Control VS Experiment Tutorial Slides 91
IV. Introduction Cancer
Cancer is a broad term to describe many different types of diseases. Cancer is the rapid unregulated growth of cells in the body, which grow to form tumors and encompass or enter neighboring cells and tissues in the body. There are two major types of tumors, malignant and benign. The difference between the two is malignant tumors can spread into neighboring tissues and cells, while benign tumors do not spread throughout the body. The main issue with rapid cell growth is that when it is not monitored or noticed it can spread to both the lymphatic and circulatory systems as well as major organ groups and tissues. Many cancers are defined by their location and cell type in the body, for example leukemia is associated with the excess production of white blood cells, or leukocytes in the bone marrow. This is only one example of the hundreds of different types of cancers and uncontrolled cell growth found in people.
Figure 1: Survival Rates of Specific Forms of Cancer and how Detecting Early vs. Late Effects Survival Rates
source: 1.American Cancer Society. Cancer Treatment & Survivorship Facts & Figures, p.7 2012-2013. Atlanta: American Cancer Society; 2012.
Some of the more common types of cancer found in teens and young adults are, but not limited to lymphoma, melanoma, leukemia, testicular cancer, central nervous system tumors such as brain and spinal cord tumors, breast and cervical cancer in women, liver, pancreatic, and thyroid cancer. Although individuals who fall in the teen and young adult age range are 4.75 times more likely to be diagnosed with some form of cancer than pediatrics, children under the age of 12, the survival rates for teens and young adults have not been keeping pace with the younger and older age groups. The reasons behind the level of survival rates staying the same is the lack of early detection and
diagnostics. Delays in diagnosis is one major reason cancer survival rates for teens and young adults have barely improved since 1975. There are several reasons for the lack of improvement in survival rates; the inability to conduct testing in clinical trials with active participation, the lack of proper treatment for the later stages of cancer development, and having an inadequate way to inform teens and young adults about the science and symptoms behind cancer. All of these factors are a few of many that contribute to the lack of improvement in survival rates. The main focus of this project is to emphasize the importance of cancer prevention and early diagnosis by empowering young individuals with the confidence to be proactive about their own health. The inability to recognize what a cancer symptom may look or feel like also greatly contributes to the issue of delayed diagnosis. 15-40 Connection’s primary goal is to help improve the survival rate by
promoting awareness of cancer symptoms, detecting them early and taking action promptly. Cancer is a process and at earlier stages it can be intervened through early detection of these subtle
15-40 Connection
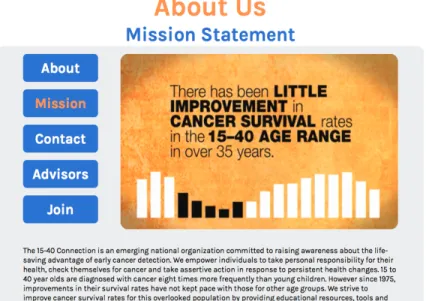
15-40 Connection is a non-profit organization raising awareness about the importance of early cancer detection for 15 to 40-year olds. Although those who fall in this age range are 4.75 times more likely to be diagnosed with cancer than pediatrics, there has been little improvement in survival rates since the 1970s. The main message that the national organization is raising awareness of is the importance of early detection. By providing educational resources and tools to the public and encouraging individuals to take responsibility and have some self advocacy for their health. 15-40 Connection is currently leading the movement of enhancing survival rates of cancer patients through education and awareness. Benchmarking normal health, recognizing cancer signs and/or symptoms, and taking immediate action when a persistent health change is noticed are some of the key topics the organization focuses on spreading. Overall, 15-40 Connection is looking to empower and raise awareness among teens and young adults, hoping to eventually lead to the improvement of survival rates as well as saving the lives of many through early cancer detection.
Figure 2: 15-40 Connection About Us Mission Statement source1. 15-40 Connection. About Us Mission Statement. 2013
ASSISTments
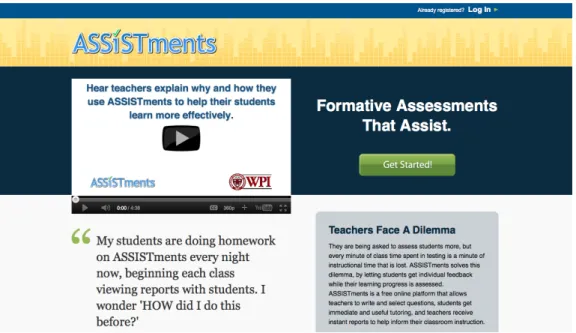
ASSISTments is an online platform, free of charge, that allows teachers to incorporate technology with education in a fun and easy way. ASSISTments gives educators the freedom to create custom problems through the use of existing problems and assign them to students in the form of a problem set. The problem sets are used to assess students, provide immediate feedback and useful tutoring, and supply instant results for teachers. There is a tutoring option that provides students who have selected an incorrect answer with a step by step process to direct them towards the correct answer, simultaneously including the student in understanding and correcting the error.
The primary users of ASSISTments are junior high and high school math teachers seeking a method of teaching allowing instantaneous tutoring and feedback on interactive homework
assignments, quizzes or exams. ASSISTments makes grading easier by recording all the data from users and creating personal reports for each individual student for teachers use.
Using ASSISTments, the group members created a problem set geared towards the 15-40 Connection message to help build cancer awareness among the tutorial users in hopes to spread the information among current high school students. 15-40 Connection’s fundamental message
includes the empowerment of students by providing relatable and actionable knowledge with the recognition of cancer symptoms, what actions to take if a subtle and persistent change is noticed, and the acknowledgement of how cancer can happen to anyone at any age.
Using the data collected through ASSISTments, the project group focused on organizing and analyzing the data. After a number of students completed the tutorial, the group downloaded the raw data from the ASSISTments website. The data was organized into two major sections, the control and the experiment. After the organization was finalized, the group began the analyzation process. The analyzation of the data consisted of the following tests: standard deviation testing, Ttesting, averages, and medians.
Figure 3: ASSISTments HomePage source1. ASSISTments.org
Last Year’s Data
At the onset of the project the analysis of the data collected from the previous year’s tutorial played a crucial role in familiarizing the group with 15-40 Connection’s ambition to have useful data and statistics to back their company’s greater goals. The tutorial created last year was sent out to different high schools in the surrounding Worcester County area. These high schools include Grafton High School, Saint Peter Marian, Worcester Academy, and Worcester Regional High School,which had both the control and experiment versions of the tutorial randomly distributed to them. From the time based data certain assumptions about whether a particular student answered or ignored specific sections and questions could be deduced. Also whether or not a student had
completed certain parts of the tutorial, or watched the videos could also be concluded from the times given in the downloaded data from ASSISTments.
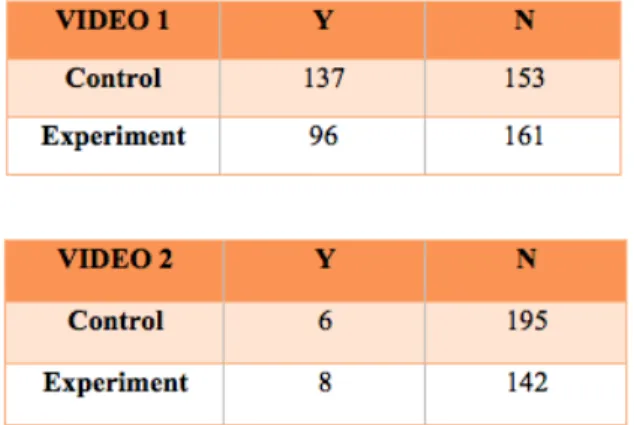
Table 1: Video 1 and Video 2: How many completed each video?
For the time based data of last year’s tutorial it could be concluded that less than half of the students for both the control and the experiment did not finish watching the first video. This table also shows how less than 10% for both the control and the experiment did not watch the second video either. Although the two videos were of different lengths the majority of students did not finish watching either of the two videos. Over 60% of the students from last year’s trial did not
watch one or both of the videos based off the times that were retrieved with the data.
The following table shows the relationship between the similar questions, question 4 from the pretest and question 64 from the Post test. Whether or not a student had a change in opinion between the two questions and whether or not they had a negative or positive outlook overall was calculated. The two questions dealt with the issue of “How likely would you be to go to the doctor if you noticed a change in your health?”
Table 2: Relationship of pre and post test responses of
“How likely would you be to go to the doctor if you noticed a change in your health?”
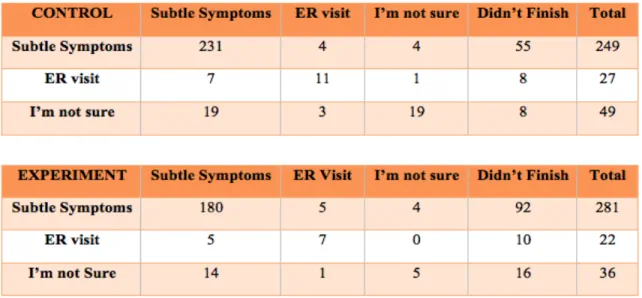
The following tables deal with the change in answer in another set of similar questions, question 7 from the pretest and question 62 from the Post test. The questions dealt with the topic “Do you think early warning signs of cancer are usually subtle, or something that will land you in the ER? “ The table is read by having the columns being responses from the pretest responses and the rows are from the Post test responses. These tables are also used to show the changes in
comparison with whether a student was in the control group or in the experiment group. The tables show that more people in the experiment group got the message of subtle symptoms, which is the correct answer, than those in the control group.
Table 3: Relationship of pre and post test responses of
“Do you think early warning signs of cancer are usually subtle, or something that will land you in the ER? “
The following tables show the change in answer in question 8 from the pretest and question 63 from the Post test, and it compare the answers from the control and the experiment. The question asked was “What would you do if your left knee swelled up and didn’t get better for 16 days?” Again the columns are the responses from the pretest and the rows are the responses from the Post test. In the tables it can be seen that the control group actually had a higher number of students who responded correctly with “Get it Checked Out” than those in the experiment group. But in both groups the majority of the students got it correct in the Post test than in the pretest. These results show the improvement of information retention of the students over the course of the tutorial.
Table 4: Relationship of pre and post test responses for control of
“What would you do if your left knee swelled up and didn’t get better for 16 days?”
In the tables it can be seen that for the control group the number of students who got the answer correct increased from 257 to 312. The table below shows that the number of students who got the question correct from the pre to Post test increased from 203 to 296. These numbers
conclude by the end of the tutorial the majority of students were able to answer questions about early detection and self advocacy.
Table 5: Relationship of pre and post test responses for experiment of “What would you do if your left knee swelled up and didn’t get better for 16 days?”
Project Goals
Below are the overall goals created by the group and the people from 15-40 Connection.
V. Materials and Methods Weekly Meetings
During the course of three terms, A through C, weekly meetings were held with the sponsor and ASSISTments Co-founder, Christina Heffernan; in addition to separate student group meetings. These meetings went over what was accomplished in the previous week and the goals for the
upcoming week.
Our sponsor representatives from 15-40 Connection, Sandy Foster, Brittany Geoffroy, and Tricia Laursen, met every week for an hour with the student project group to review last years data, discuss progress and new objectives. This ensured that the current work was focused around 15-40 Connection’s goal of raising awareness about the life-saving advantage of early cancer detection, being proactive with health, and being a supporter of self advocacy.
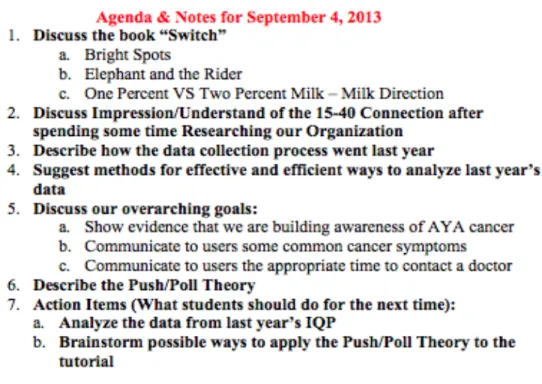
During the early portion of the project, meetings followed a specific agenda with topics and goals to be discussed in the allotted meeting time. Early on, 15-40 representatives started the agendas but eventually the task was passed on to the student project group to create the following weeks agenda. An example of a typical agenda is shown below.
Figure 6: Sample agenda and notes for IQP meetings with advisor and 15-40 Connection.
The agenda was designed using the 15-40 Connection shared Google Drive, in order to allow access to the representatives, Christina Heffernan, and the student group. The agenda usually consisted of discussion of readings, research, reviewing previous data, new ideas that were brought up in the individual student group meetings, and future goals. Group notes were added directly to the agenda during the meeting, as shown above, along with individual notes being logged in either Microsoft Word or written format in the Google Drive.
As the project developed, meetings focused more on analyzing last year’s data and defining the path of the present project, eventually being concentrated almost entirely on ASSISTments. Therefore agendas became less relevant to the whole group meetings and were no longer used to outline the goals. Meetings were completely driven by the group’s work, questions the sponsors had related to improvements, and future goals that needed to be achieved.
Excel, working with Google Drive PowerPoint to create Tutorial outlines, use of ASSISTments, and compiling the final report.
Software
The project group created two Google drives: 15-40 IQP 2013 and IQP Student Group. Google drive created a very simple and effective way for the student group, 15-40 Connection representatives, and Christina Heffernan to instantly organize, edit, and share information from any computer.
The 15-40 IQP 2013 Drive was shared between all three parties, whereas the IQP Student Group Drive was limited to just the student group. The 15-40 Drive’s purpose was used to share 15-40 presentations, corporate slides, the tutorial, as well as agendas and group notes. The separate student drive consisted of similar information but also included research and the final report.
Multiple different software were used throughout the project to complete different tasks. Besides google drive, Microsoft Office Excel was used frequently in the beginning of the project. Excel was used to organize last year’s data that was collected from numerous high schools in the region. The data was then easily sorted and could be viewed as a whole rather than separate schools.
Microsoft Office Powerpoint was also important in the completion of our project. The final tutorial was constructed in powerpoint in order to allow for complete control of the formatting and a consistent template for the questions. Microsoft application Snipping Tool was then used to snip each individual slide and paste it into ASSISTments.
ASSISTments
ASSISTments was used to create an online tutorial to help spread 15-40 Connection’s message about the benefits of early cancer detection. The student group created a tutorial containing demographic questions, informational slides, real life stories, and various questions about cancer. Some topics covered when asking questions about cancer included normal health, early detection, self advocacy and what a cancer symptom looks like. The student group shared an ASSISTments account in order to collaboratively create, edit, and assemble various problem sets. The ASSISTments account for the project had a Username: [email protected] and Password: 1540group used to make the final tutorial.
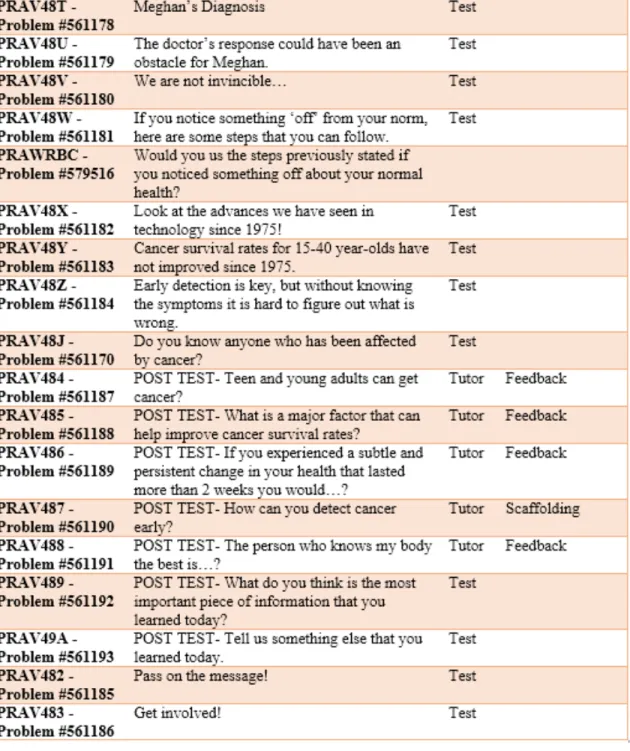
The problem set PSAJZQQ - HS Final Tutorial was finalized at the beginning of C term. The table below contains a list of the ASSISTments numbers, titles to the problem set, and the mode and/or tutoring used for each question.
The Pre and Post tests, not including demographic questions, consisted of similar questions in order to see if the student’s responses changed by the end of the tutorial for the better. Both the Pre and Post tests were mostly multiple choice questions, yes or no questions, and choose all that apply questions. However, the last two problems of the Post test were open response questions, asking the student to ‘tell us’ something they learned from the tutorial, and then to mention a second thing they learned from the tutorial in the second open response question. The group and sponsors, agreed the open response questions would be an accurate way of determining if the students had retained and processed any of the information presented throughout the tutorial. These open
responses were also a good way to judge if there was a difference in information retention between the Pre and Post tests. The difference between the control and experiment could be seen by the mention of being proactive with their health, since that was the information given to the experiment and not the control group.
Following the Pre test, students began completing the body portion of the tutorial. This portion of the tutorial contained general information in order to inform the students of 15-40
Connection’s message about cancer. This general information was then followed by real life stories to relate actual people’s experiences to those a student could sympathize with. These stories dealt with people who experienced small but persistent changes in their health but were proactive by getting these signs checked early instead of waiting until it was too late. This was mostly informational slides which simply allowed for the student to select “next” and continue with the tutorial after reading and thinking about the information presented.
Each student was also randomly assigned to either the experiment or control condition. This portion occurred once the student had completed roughly half of the tutorial. The purpose of this part of the tutorial is to conduct a scientific research on whether or not the introduction of proactive content effects on the overall results of the data. This was evident through the two final open
response questions that asked the students to describe two things they learned from the tutorial. The experiment focused on how one could be proactive with their health and in their daily lives. While the control was asked general questions to gain information about their opinion of the tutorial and their personal experience with cancer. The conditions were both composed of short yes or no multiple choice questions in addition to one open response question. Both conditions consisted of the same number of questions in order to ensure both groups spend a similar time on the tutorial.
Below in Table 6 is the list of problem sets and a brief description of the title of the slide. In some cases the title of the slide is the question asked to the student for the corresponding problem number. Problems are either in test or tutor mode and they may or may not have tutoring,
Table 6: ASSISTment problem set numbers, description, mode, and tutoring used for each individual question.
Tutorial Timing
The amount of time in which it took for the users to complete the tutorial played a large factor in creating and editing the finalized problem set. Based on last year’s data collection, both the 15-40 Connection representatives and the IQP members agreed that the length should be short enough that the users would not lose interest. Assessing last year’s data revealed that a total of 193 people did not complete the full tutorial, leaving a lot of sections of data incomplete. In an attempt to prevent this from happening, the group came up with an ideal completion time which was approximately 10 minutes. Upon finalizing the tutorial, the group members conducted a “Soft Launch.” The Soft Launch consisted of 8 volunteers who were asked to complete the tutorial for feedback and timing purposes prior to the actual release of the tutorial to schools. The people who participated in the Soft Launch also answered four questions to give feedback on the length of the tutorial, the content, and the manner in which the questions were presented.
Reaching Out
During the final term of our project, Cristina Heffernan and our sponsors from 15-40
Connection reached out to high schools from last year as well as new contacts, including some new middle schools. The 2014 contact list can be found in Appendix V.
On February 3, 2014, Sandy Foster reached out to all the testers from last years tutorial as well as additional teachers with the following email.
15-40 Connection reaching out e-mail to new teachers:
Dear ______ ,
Happy 2014 from 15-40 Connection! This academic year 15-40 Connection has been \working with WPI students on an online tutoring program called ASSISTments to build a tutorial designed to educate users on 15-40 Connection messaging. This tutorial promotes taking personal responsibility for one’s health, teaches what a cancer symptoms can look or feel like and emphasizes the importance of taking assertive action in response to persistent health changes. We are hoping that this tutorial will complement our mission to improve cancer survival rates for teens and young adults by empowering students with knowledge of earlier cancer detection.
Please assign this tutorial to your students today and build awareness of what a cancer symptom can look or feel like to provide your students with the life-saving advantage of early cancer detection. This tutorial is designed to be implemented as class work, or as homework and should take no longer than 15 minutes. To assign this tutorial, please ask your students to take 2 minutes to set up an assistments account by following the easy instructions attached. The tutorial ID is PSAJZQQ.
Thank you, once again, for your participation! Please assign the tutorial by February 14th. Gratefully,
Sandy Foster
Education and Outreach Director 15-40 Connection
781-820-6996
15-40 Connection reaching out e-mail to Last years teachers:
Dear ____,
Happy 2014 from 15-40 Connection! You may recall that last spring your students participated as early users of an innovative 15-40 Connection tutorial. This year, we have built an improved version that we’d like to invite you to share with your classes. The tutorial is built around the organization’s mission, to improve cancer survival rates for teens and young adults by empowering them with knowledge that can provide them with the life-saving advantage of earlier cancer
detection.
teaches what a cancer symptom can look or feel like and emphasizes the importance of taking assertive action in response to persistent health changes.
Please follow the easy instructions attached. The tutorial ID is PSAJZQQ. It is designed to be implemented as class work or as homework.
Thank you, once again, for your participation! Please assign the tutorial by February 14th.
Gratefully, Sandy Foster
Education and Outreach Director 15-40 Connection
781-820-6996
On February 6, 2014 Cristina Heffernan sent an e-mail to some of the contacts from Appendix V.
ASSISTments reaching out, e-mail :
Dear ______ ,
I am reaching out to high school teachers familiar with ASSISTments. I want to tell you about a new problem set tutorial we have built in conjunction with a non-profit organization called 15-40 Connection. The mission of 15-40 Connection is to improve cancer survival rates for teens and young adults by empowering them with knowledge that can provide them with the life-saving advantage of earlier cancer detection.
This year, with the help of students at WPI, 15-40 Connection has created a problem set/tutorial on the ASSISTments platform that promotes taking personal responsibility for one's health, teaches what a cancer symptom can look or feel like and emphasizes the importance of taking assertive action in response to persistent health changes.
The problem set ID is PSAJZQQ (click here to see a preview) . Please assign it to your students today and build awareness about early cancer detection. If it makes more sense to involve the health teacher at your school have him or her contact us and we will be in contact and work together to get the tutorial to the students.
Reply and tell me what you think. Please assign the tutorial by February 14th. Cristina
Creating an ASSISTments Account
The group created a set of instructions on how to make an ASSISTments account on a Google Drive. Instructions were attached to the reaching out e-mails to help make creating an account on ASSISTments as user friendly as possible. In nine easy steps and about 5 minutes, a student could create their own ASSISTments account. The instructions are shown below.
Cristina Heffernan also reached out on Twitter from @assistments to get the message across about the tutorial to a broader audience. A screenshot of the actual tweet is shown below.
Figure 8: Screenshot of tweet from @assistmnets source1: twitter.com
Due to the term winding down, and the deadline of February 14, 2014 that was designated for data to be collected, the group was unable to wait for all the responses from the contacts. Data was received from Boston Latin High School on February 12, 2014. Shortly after, more data was received from other students of Boston Latin on the 24th of February. However, no other data was collected due to the time constraint. But plans to analyze more incoming data has been made with the sponsors from 15-40 Connection, in order for them to have more useful data relevant to their messaging.
VI. Description of Study
Over the course of the three terms, the project group members worked in association with the 15-40 Connection to assemble a tutorial to help spread awareness of the importance of early cancer detection. The group members began the initial term by familiarizing themselves with ASSISTments and 15-40 Connection. While also beginning to organize and analyze the data collected from last year’s project. By reviewing last years data, the group was able gain a better understanding of how ASSISTments works and learned more about what was successful from last year’s tutorial. The analysis of last year’s data familiarized the group with how the data results from the control and the experiment will differ, and what those differences represent. Reviewing of last years data consisted of uploading into excel and color coding the data into multiple sections and then sorting that data to better represent the statistical analysis to be completed. The data was separated into control, experiment, next questions, and Pre and Post tests, also deleting any students from the data who had not completed the tutorial. Times for each question were next to the problem set answer, these times had to be converted from milliseconds to seconds. Once the data was
organized, more in depth numerical analysis was completed. The group examined the two videos, the relationship between question 4 and 65, and two different Pre test questions that had a similar Post test question. Through these analyses and finalization of last years data, see section Last Year’s Data for a more thorough review. The group, advisor, and sponsors felt there was a new path this year’s tutorial would take. Minimal questions were to be carried over to the new tutorial, with hopes of a fresh look to reflect the new objective of approaching the tutorial with proactive and self advocacy being the focal points of the control and experiment differences.
Moving on from last years data, the group started to brainstorm basic ideas to enhance the tutorial in hopes to improve the quality and quantity of the data collected. The project group began
profit. 15-40 Connection uploaded multiple powerpoints from corporate to high school
presentations to help develop ideas for possible tutorial questions. The group compiled questions and information about cancer into a google document and created a flowchart to visualize the connections between these preliminary questions. The project group drafted and presented several different tutorial schemes to the 15-40 Connection representatives over the course of a few months. During the progression of the tutorial, the meetings focused on reviewing the tutorial drafts and continuously editing them and adding new question and pertinent information. Pre test questions were generated with the combination of demographic questions and simple questions to get a basic understanding of the users base knowledge of cancer and cancer symptoms in general. However, the project team agreed cancer questions were not to be asked about scientific information but instead questions that could help express 15-40 Connections message of early detection, subtle but persistent changes in health, proactive approach concerning health, and self advocacy. A control and experiment were eventually added to the tutorial to compare two separate groups to see if the overall responses would differ at the end of the tutorial. The experimental group had questions concerning proactive approaches to health and life, while the control had questions concerning the real life stories mentioned after the Pre test. the added element of proactiveness was used as a scientific study to show if this added knowledge had an affect on overall performance of the tutorial responses. Lastly, a Post test was added to the end of the tutorial that was similar to the questions in the Pre test. Multiple different tutorials were created on PowerPoint before agreeing upon one format. Edits continued through the final tutorial process until the group, advisor, and 15-40 Connection felt there were no more to be made.
The group then took screenshots of each PowerPoint slide to paste into ASSISTments so that the same background and formatting could be used for the tutorial. This formatting gave the tutorial a better aesthetic look. The final problem set consists of both informational slides
expressing the message of the 15-40 Connection as well as feedback questions to emphasize and reiterate the new information. Using ASSISTments, the group finalized the problem set for high schools which could easily be accessed by students through the ASSISTments website. Instructions were also created to go along with the tutorial to ensure ease of creating an account. The
instructions included the class, teacher, and problem set number.
Upon finalizing the ASSISTments problem set the group organized a “Soft Launch” for assessment purposes. A total of eight volunteers were asked to complete the tutorial as well as answer a few questions about the tutorial to provide feedback to group. The volunteers were made up of high school and college students. The raw data gathered from the volunteers supplied the group with statistical information including the length of time each volunteer needed to complete every question as well as the total tutorial time. Using the feedback from the Soft Launch, the problem set was edited and sent out to schools.
With the inflow of information from high school students, the group compiled the raw data and completed a series of statistical analyzations. After the group downloaded the data, they then organized it into the two major sections: control and experiment. The data was then sorted based on whether the students completed the entire tutorial or not. This was done to take averages of the control and experiment in the Pre and Post tests and also with the final two open response questions. The analyzation process consisted of the following averaging, standard deviation testing, T-Testing with p values, and finding the medians of certain aspects of the data. The group analyzed the open response questions, comparing key topics with the main topics mentioned throughout the tutorial. These responses were then graded and then averaged to see how many pieces of important
information the average student retained from the tutorial. The results and explanations concluded from the analyzations are in the following section: Results/Analysis of Data.
VII. Results/Analysis of Data
After having the data tested by students at Boston Latin School, a more cohesive analysis of the responses to the tutorial were calculated. Over 70 students attempted the 15-40 Connection tutorial through ASSISTments and about 50 of those students completed the tutorial all the way through. Through the programming of ASSISTments each student was randomly selected to either be a part of the Control or the Experiment. The control group had a series of three questions in the middle of the tutorial that related back to the individual stories of cancer survivors who had detected their symptoms early on. Respectively in the experimental group the students were asked questions concerning being proactive in their everyday lives, and how those proactive actions led to changes in their lives. Below is a checklist that was completed on the data in order to make sure all the points of the statistical analysis is completed.
both the control and in the experiment. These responses are both profound and thought provoking, especially for high school aged students. The total number of students who completed the
experimental set of questions in the tutorial was 28. The number of students randomly selected to completed the control set of tutorial questions was 30.
Table 7: Control responses to open response question
Table 8: Experiment responses to open response question
Open Response Data
The following tables are given examples of open responses that some of the students from Boston Latin School provided in the tutorial. These responses were some of the best given, and all of these responses were then later scored and then included in the overall averages for both the control and experiment groups.
Table 9: Key words from the open responses which were provided from students from Boston Latin School
Statistical Data Analysis of Pre and Post Test
In the Pre Test and Post Test there were a total of six questions, consisting of Yes or No, True or False, Multiple Choice, and Choose All that Apply types of questions. The average of the Pre and Post tests were calculated based on the number of correct answers they had out of the total six questions. Both the questions for the Pre and Post tests contain the same material, they are simply phrased differently and in a different order. The ttest compares the results from the Pre and Post Tests is such a small decimal number 0.0000000954573 and from this it can be concluded that these two data sets are in fact the same, since the null hypothesis is proven to be false. By stating the null hypothesis to be false the two sets of data between the Pre and Post tests have a direct correlation.
Table 11: Pre and post test averages, standard deviations, and medians.
A standard deviation of 0.958915 for the average of 4.71831 shows the variation for each student is around 1 question, whether right or wrong, in regards to the average. The median shows a vast majority of the students got at least 5 out of the 6 question in the Pretest correct. The average was only taken for those students who completed both the Pre and Post tests in order to have a similar set of data with which to do a ttest on. The p value that is calculated from the ttest is significantly less than 0.05 which holds that the relationship between the Pre and Post tests is significantly different. This will be more evident when the ttest for the averages between control
and experiment are calculated later in this section on statistical analysis.
The average of the Post test is higher than the Pretest, with an average of 5.56604 and a standard deviation of 0.604771. The lower standard deviation shows fewer students deviated from the average in the Post test than in the Pretest. The median also increased from 5 to 6. The increase in median and average along with the decrease in standard deviation are the results of the students doing better at the end of the tutorial than in the beginning. It can be concluded that the students learned how to recognize a cancer symptom, keep an eye on changes in health for two weeks, and that they know their own body best. The statistical results of the students overall reflects the purpose of the tutorial and that the students are taking away valuable lessons from the information given to them.
Averages were then calculated for both the control and experiment for the Pre and Post tests to see if the proactive information affected the final results of the data.
Table 12: Pre test relationship between control and experiment
In the Pre test the students who were randomly assigned to the control did better with an average of 4.9 but a high standard deviation of 0.884736. This shows students in the control could have gotten more questions right than the average and vice versa. The students who were in the experimental group had a lower average at 4.643 and a lower standard deviation of 0.869835. With a slightly smaller standard deviation more students assigned to the experiment stayed closer to the
significantly higher than 0.05, which shows that there is no real difference between the control and experiment concerning Pre test results.
Table 13: Post test relationship between control and experiment
In the Post test, as expected, the experimental group had a higher average than the control group. Since the experimental group had information about being proactive with their health, and the control group had questions pertaining to 15-40 Connection itself. The averages for both the control and experiment in the Post test increased compared to the Pre test. This also proves both groups were able to retain some of the information presented to them and answer more of the questions correctly. The control also had a higher standard deviation in the Post test which shows that more students deviated from the average, but in the experiment the standard deviation is less than .5 which shows that the majority of the students in the experiment got at least 5 out of the 6 questions correct. The p value from this ttest is 0.126313 which is closer to 0.05 than the p value for the Pre test. This illustrates they are not significantly different, however, there is still a sense of the experimental group doing better than the control group, which is seen in the percent gain. The ttest shows the average results are in fact different because the standard deviations differ
significantly. Therefore the students who were in the experimental group did take away more information from the tutorial than the control group. Since the experiment has a higher average and a lower standard deviation, it shows that the majority of students who were in the experimental group retained more material from the tutorial than those in the control based off of the higher average of the number of correct answers they go in the control. The smaller standard deviation
shows the majority of the students had a total number of correct answers that was close to either 5 or 6 since the average is above 5 and the standard deviation is less than 0.5. These results reflect the assumption that the students who were randomly selected to be in the experiment had a better overall grasp of the information than those in the control group, because they were exposed to the information about being proactive in their health.
Table 14: Analysis of percent gain for pre and post test
Percent gain was calculated by taking the change in the number of correct answers between the Pre and Post tests and then dividing them by the number the student got correct in the Pre test to determine the percentage of improvement or gain that the students showed. This is a numerical representation of the change in results between the Pre and Post tests answers. Since the results were calculated based on the number of questions the student got correct out of the six, the percent gain shows how each student improved from the Pre to Post tests. The questions in the Pre and Post tests were the same and therefore the gain calculated was accurate to represent the improvement, or lack thereof of each student. Some of the students had a negative gain, showing that they got more questions wrong in the Post test than they did in the Pretest.
Table 15: Analysis of percent gain for pre and post test of the control and experiment
The difference in improvement rate for the Pre and Post tests in the control and experiment can be calculated through the percent gain of each set of data. The difference in the Pre and Post tests is divided by the number of correct answers the students had in the Pre test in order to show the overall improvement rate. The average percent gain for the experiment is higher than that for the control by over 10%, which shows that the students who were randomly assigned to the
experiment had a high improvement rate between the Pre and Post tests than the students who were in the control group. The higher gain in the experiment goes back to stating that the use of
knowledge about being proactive with their health helped in getting 15-40 Connection’s message across. The information about being proactive with their health helped the students to better retain the information throughout the tutorial, than those in the control who just had information about 15-40 Connection in general.
Statistical Data Analysis of Open Responses
Rubric: How Open Response Questions were Graded and Scored**
Table 16: Rubric for open response
**This table was made using made up responses and not actual responses from the data. But student responses were graded on content and the number of points of information that they touched upon in their responses.
After the Post test, there were two open response questions both asked the students to write about the things they learned from the tutorial. Each of the open response questions were graded on
and the relevance to the tutorial. This scale was chosen because of a few students giving exceptional responses with a maximum of three pieces of information given.
Table 17: Analysis of first open response for post test
The average of all the students was 1.2 which reflects that the majority of the students answered the question literally and only provided one piece of information. The standard deviation is around .7559 and can reflect some students did score higher than the average and the median, and these results can concluded every student got at least one valuable piece of information from the tutorial.
Table 18: Analysis of second open response for post test
Both of the Open Response Questions took the open ended responses of the students and scored them on a scale of 0 to 3 based on the number of points of information the student used in their answer. Examples of some key topic points covered were: 2 weeks is key, be proactive with your health, make a doctor’s appointment if health changes do not go away, etc. For the second
question the average and standard deviation were lower than the first open response. This reveals the majority of students put more effort into the first open response by giving the majority of the information they retained in their first response.
Table 19: Average open response scores for control and experiment
Based off the sum of both scores the average response from each student in the control and in the experiment was calculated. The average for the control is slightly higher than in the
experiment. This was surprising since it was thought the experiment would have retained more information since they were given questions on being proactive. One reason for this result could be that there were some students in the experiment who mentioned proactive in their open responses but did not go into great detail about this topic. Another reason could be the students in the control just gave in depth answers based on all the other material mentioned throughout the tutorial. The ttest shows that the two do not differ since the p value for the ttest is over 0.05.
VIII. Discussion
The overall objective of the 15-40 Connection Tutorial Through ASSISTments Interactive Qualifying Project was to create a user friendly tutorial which incorporates the cancer prevention and early detection messaging of 15-40 Connection with the ASSISTments problem set building software. The project group worked with representatives from both 15-40 Connection and ASSISTments over the course of three terms to construct and distribute the tutorial in order to collect and analyze data.
Before the final ASSISTments problem set was created, a number of preliminary drafts were created and eventually transformed into the final problem set. Originally, the group assembled a flowchart with approximately 20 possible questions that were organized by topic. Using the
flowchart and information obtained through research, a PowerPoint based tutorial was constructed. After meeting with 15-40 Connection representatives, a finalized version of tutorial was completed and inserted into an ASSISTments problem set. The finalized problem set was then distributed to local high schools and data was collected. The group then performed a series of testing with the data in order determine whether it mattered if the students received the control or the experiment tutorial. The difference between the control and experiment tutorials consists of a series of four slides in the experiment and three slides in the control. The experimental tutorial slides that differed from the control are composed of information about being proactive about one’s health. Based on the open response questions at the end, it was determined that these informational slides had little to no impact on the users that were randomly selected into the experimental group. However, the message about early detection, one of the emphasized points in 15-40 Connection’s messaging had the largest impact upon all users, being mentioned the most in the ending open response questions. The statistical analysis used by the group to go over the data that was collect from Boston Latin School reflected some of the thoughts the group had about how the messaging would come
across. The averages were taken for the Pre and Post tests but also with the differentiation of the control group versus the experiment group. These averages shows that the students who were in the experiment group had a better score for the number of questions correct in the Post test in
comparison to the control group. The ttest that were calculated show that there was no real
correlation to the control and experiment, and that the two differed enough to show the experiment group had overall better responses with only a few exceptions.
The possibility for the continuation of the 15-40 Connection Tutorial Through
ASSISTments IQP would be through the continuation of helping the sponsors at 15-40 Connection analyze any incoming data statistically and pulling out the most important information. This tutorial could then be used as a tool at school presentations to help supplement the material presented or as its own tool that can be continuously given out to high school and out in social media to keep collecting data. This tutorial could also be used in another control vs. experiment project by sending it out in the early fall and then analyze the recorded data.
IX. References
"Alternative Content." Quiz: Cancer Rumors. Baylor Health Care System, 2014. Web.
<http://www.baylorhealth.com/SpecialtiesServices/HealthSource/HealthExclusive/Archives/ Quizzes/Pages/QuizCancerRumors.aspx>.
Chopra, Paras. "Smashing Magazine." The Ultimate Guide To A/B Testing. Smashing Magazine, 24 June 2010. Web. <http://www.smashingmagazine.com/2010/06/24/
the-ultimate-guide-to-a-b-testing/>.
Chip and Dan Heath (2010). Switch: How to Change Things When Change is Hard. Crown Publishing Group, a division of Random House, Inc., New York
Efstathiou, C. E., Prof. "Student's T-test: Comparison of Two Means." Student's T-test: Comparison of Two Means. National and Kapodistrian University of Athens, n.d. Web.
<http://www.chem.uoa.gr/applets/AppletTtest/Appl_Ttest2.html>.
"Fight Cancer by Raising Awareness and Educate about Early Cancer Detection." FUCK CANCER F C Cancer Foundation RSS. F C CANCER FOUNDATION, 2013. Web. <http://www.fuckcancerfoundation.org/prevention/>.
Heffernan, Neil. "Assistments." Assistments. Worcester Polytechnic Institute, 2012. Web. <https://www.assistments.org/>.
"StupidCancer.org." Stupid Cancer: The Voice Of Young Adult Cancer. N.p., 2013. Web. <http://stupidcancer.org/>.
"Surveillance, Epidemiology, and End Results ProgramTurning Cancer Data Into Discovery."
Surveillance, Epidemiology, and End Results Program. Surveillance Research Program, NCI, n.d. Web. <http://seer.cancer.gov/>.
"What Is A/B Testing?" : What Is AB Testing? Optimizely, 2014. Web. <https://www.optimizely.com/ab-testing>.
"Would You Recognize a Cancer Symptom?" 15-40 Connection. 15-40 Connection, 2012. Web. 30 Aug. 2013. <http://15-40.org/>.
XII. Appendix III: Control VS Experiment Tutorial Slides