Improving the Quality of
Traffic Records for
Traffic Incident Management
Report Number: KTC-18-22/SPR18-567-1F DOI: https://doi.org/10.13023/ktc.rr.2018.22
The Kentucky Transportation Center is committed to a policy of providing equal opportunities for all persons in recruitment, appointment, promotion, payment, training, and other employment and education practices without regard for economic or social status and will not discriminate on the basis of race, color, ethnic origin, national origin, creed, religion, political belief, sex, sexual orientation, marital status, or age.
Kentucky Transportation Center
College of Engineering, University of Kentucky Lexington, Kentucky in cooperation with
Kentucky Transportation Cabinet Commonwealth of Kentucky
© 2018 University of Kentucky, Kentucky Transportation Center
Research Report KTC-18-22/SPR18-567-1F
Improving the Quality of Traffic Records for Traffic Incident Management
Reginald Souleyrette, PhD, PE Principal Investigator Mei Chen, PhD, PE Co-Principal Investigator Xu Zhang, PhD Research Engineer Eric Green, PhD, PE Associate Program Manager
and Shraddha Sagar Research Assistant Kentucky Transportation Center
College of Engineering University of Kentucky Lexington, Kentucky
in Cooperation with Kentucky Transportation Cabinet
Commonwealth of Kentucky and
Federal Highway Administration U. S. Department of Transportation
The contents of this report reflect the views of the authors, who are responsible for the facts and accuracy of the data presented herein. The contents do not necessarily reflect the official views or policies of the University of Kentucky, the Kentucky Transportation Center, the Kentucky Transportation Cabinet, the United States Department of Transportation, or the Federal Highway Administration. This report does not constitute a standard, specification, or regulation. The inclusion of manufacturer names or trade names is for identification purposes and should not be considered an endorsement.
1. Report No. KTC-18-22/SPR18-567-1F
2. Government Accession No. 3. Recipient’s Catalog No
4. Title and Subtitle
Improving the Quality of Traffic Records for Traffic Incident Management
5. Report Date
December 2018
6. Performing Organization Code 7. Author(s):
Reginald Souleyrette, Mei Chen, Xu Zang, Eric R. Green, Shraddha Sagar
8. Performing Organization Report No.
KTC-18-22/SPR18-567-1F
9. Performing Organization Name and Address
Kentucky Transportation Center College of Engineering
University of Kentucky
Lexington, Kentucky 40506-0281
10. Work Unit No. (TRAIS) 11. Contract or Grant No.
SPR 18-567
12. Sponsoring Agency Name and Address
Kentucky Transportation Cabinet 200 Mero Street
Frankfort, Kentucky 40622
13. Type of Report and Period Covered
14. Sponsoring Agency Code 15. Supplementary Notes
Prepared in cooperation with the Kentucky Transportation Cabinet and the Federal Highway Administration
16. Abstract
Traffic incidents in US roadways cause 25 percent of all delays experienced by users. The resulting congestion may lead to secondary crashes, increasing economic costs and further risking the lives of travelers. Traffic Incident Management is a process that detects, responds to, and clears traffic incidents as quickly as possible so that traffic flow is restored safely. This project analyzes the three TIM performance measures: Roadway Clearance Time, Incident Clearance Time and Secondary Crashes of Kentucky to identify a baseline for performance which may indicate potential for improvement. The study pinpoints different data sources, tools and technologies that can be used to collect and analyze TIM performance measures. Kentucky State Police (KSP) Crash Database and TRIMARC Incident Records are the two principal data sources used. In addition, Waze and HERE speed data are also examined for potential use. Lastly, the three national performance measures are summarized and analyzed. They comprise a baseline for future performance assessment.
17. Key Words
Traffic Incident Management, Roadway Clearance Time, Incident Clearance Time, Secondary Crashes, Traffic Data Sources 18. Distribution Statement 19. Security Classification (report) 20. Security Classification (this page) 21. No. of Pages 45 22. Price
Table of Contents Acknowledgements... iii 1. Introduction... 1
1.1 Goals and Objectives... 1
2. Data Sources ... 2
2.1 KSP Crash Data... 3
2.2 TRIMARC Incident Records ... 4
2.3 Waze Data ... 5
2.4 HERE Data... 5
3. Data Quality and Performance Measures ... 6
3.1 Roadway Clearance Time ... 6
3.1.1 Negative Roadway Clearance Time ... 6
3.1.2 Positive Roadway Clearance Time... 10
3.2 Incident Clearance Time ... 11
3.2.1 KYOPS Data... 11
3.2.2 TRIMARC Data ... 13
3.2.3 Comparison... 14
3.3 Secondary Crashes ... 15
3.3.1 False Positive (Type I Error) ... 16
3.3.2 False Negatives (Type II Error)... 22
4. Summary... 29
4.1 Data Sources... 29
4.2 Performance Measures ... 30
4.3 Implementation Potential and Recommendations ... 30
Appendix A –Other Potential Data Sources (Waze and HERE Speed Data) ... 32
Example 1 - Fatal Crash on I-71S MP 7.293 at 21:11 on 5/10/2016 ... 36
List of Figures
Figure 1 Incident Management Timeline (Source: NCHRP 07-20 Report) ... 2
Figure 2 Examples of Reports Where Time Opened is Earlier than Time Notified ... 7
Figure 3 Negative RCT... 8
Figure 4 Review of Random Sample with Negative RCT... 9
Figure 5 Positive RCT ... 10
Figure 6 Location of Agencies Symbolized by Number of Reports... 11
Figure 7 Location of Louisville Incident Reports by Agency (LMPD and ULPD) ... 12
Figure 8 Location of Lexington Agencies Symbolized by Number of Reports ... 13
Figure 9 Secondary Crash Percentage ... 16
Figure 10 Example Crash Narrative ... 17
Figure 11 2015 Secondary Collision Data ... 17
Figure 12 2016 Secondary Collision Data ... 18
Figure 13 2017 Secondary Collision Data ... 18
Figure 14 Bar Chart Showing Type 1 Crashes Over Time ... 20
Figure 15 Linear Trend Line Showing the Percent of Confirmed Secondary Crashes ... 21
Figure 16 Trend Line for Percent Correctly Identified as Secondary Crashes —Statewide ... 21
Figure 17 Example Narrative... 22
Figure 18 Space and Time Gaps from Identified Secondary Crashes on I-65... 23
Figure 19 Space and Time Gaps from Identified Secondary Crashes on US-31W ... 23
Figure 20 Spatial Visualization of False Negative Secondary Crashes (2015-2017)... 25
Figure 21 Trendline for False Negative Crashes ... 26
Figure 22 Top 10 Agencies with Highest False Negatives Identified (2015-2017)* ... 28
List of Tables Table 1 Key TIM Performance Measures from Incident Timeline ... 3
Table 2 Average Clearance Time and Number of Reports for 2012 through 2016... 6
Table 3 Random analysis of negative RCT ... 9
Table 4 Top 10 Agencies with highest number of reports ... 11
Table 5 Summary of Number of Incidents and Average Duration by Incident Type... 14
Table 6 Timeline Comparison Between TRIMARC and KSP ... 15
Table 7 Type 1 Crashes Over Time ... 19
Table 8 Summary of Statewide Type II Errors by year and cause ... 24
Table 9 Summary on False Negative Secondary Crashes ... 25
Table 10 Top 10 Police Departments with Highest False Negatives (2015-2017)... 27
Table 11 Ranking of KSP Post Based on False Negatives (2015-2017) ... 27
Table 12 Top 10 Agencies with Highest Percentage of False Negatives (2015-2017) ... 28
Acknowledgements
The following individuals contributed to the successful completion of this project through their participation on the Study Advisory Committee:
Dr. Noelle Hunter, Chair, KYTC Office of Highway Safety
Mr. Tony Young, Federal Highway Administration, Kentucky Division Mr. Jerame Brown, KYTC
Mr. Vince Robison, TRIMARC Mr. Chris Lambert, KYTC ITS
Capt. Chad Mills, Kentucky State Police Sergeant Chris Holliday, Lexington Police Ms. Julia Shaw, Lexington Police
1. Introduction
TrafficincidentsonU.S. roadwaysputtravelers’ and responders’ livesatriskand accountfor about
25 percent of all delays. The resulting congestion can lead to secondary crashes, further increasing safety risks and economic costs. Traffic incident management (TIM) is a proven method for reducing the occurrence and impact of traffic incidents.
An ideal traffic incident management (TIM) program must rely on efficient data collection, analysis, and reporting to measure performance and identify where and when traffic management can be improved. However, performance management through enhanced data collection remains elusive in many jurisdictions that either do not collect TIM data or collect data for a small percentage of traffic incidents.
The KentuckyTransportationCabinet’sTIMprogramispartoftheFHWA’sEDC 4 Initiative. The program promotes better TIM data collection to ultimately increase transparency, improve operations, and facilitate better outcomes in program performance, resource management and future planning. An Incident Management Task Force with representatives from FHWA, KYTC, KSP (Kentucky State Police), local agencies and KTC (Kentucky Transportation Center) has been formed, with a focus on identifying the resources, tools and technologies needed to compute three major performance measures: Roadway Clearance Time (RCT), Incident Clearance Time (ICT), and Secondary Crashes (SC). A Case Study evaluating the Kentucky TIM Performance Measurements was performed to create a baseline report of these metrics for future evaluation.
1.1 Goals and Objectives
The goals of this study are:
1. To Increase Transparency - Increasing the amount and quality of data collection allows agencies to demonstrate program effectiveness through quantified safety and economic benefits. TIM performance data would allow Kentucky to demonstrate the impacts of TIM policy changes.
2. To Improve Operations - Collecting key TIM data at incident sites provides agencies with the information and knowledge needed to address when and where improvements can be made.
3. To Provide Better Outcomes - Expanding TIM data collection boosts the measurements needed to improve program performance and resource management, as well as future planning.
2. Data Sources
The input from various stakeholders of the Kentucky Traffic Incident Management community provided a basic understanding of data availability and issues that would affect the TIM performance measures. This section summarizes the stakeholder input to provide a baseline assessment on data, collection, and reporting practices in Kentucky. Several data sources are used to extract the TIM measures for the state of Kentucky. However, the data sources used have different coverage. The team evaluated the completeness, accuracy and coverage of these data sources (spatial, functional and temporal). The three performance measures taken into consideration are Roadway Clearance Time (RCT), Incident Clearance Time (ICT), and Secondary Crashes (SC). Figure 1 and Table 1 shows the incident management timeline that illustrates how RCT, ICT, and other TIM measures are defined. A secondary crash is a crash that occurs as a result of the original crash either within the crash scene or within the queue in either direction. To successfully report the three measures, collected data should provide the following:
• Time of first recordable awareness of an incident (T1)
• Time of first confirmation that all lanes are open for traffic (T5) • Time at which the last responder left the scene (T6)
• The number of secondary crashes
Table 1 Key TIM Performance Measures from Incident Timeline (Source: NCHRP 07-20 Report)
Based on the input from various stakeholders of the Kentucky TIM community, data relevant to the TIM practice are collected from multiple sources, which are as follows:
• Crash data from KSP along with traffic collision reports • TRIMARC incident records from Louisville Metro • Waze incident and jam alerts from KYTC
• Archived HERE real time speed data from KYTC
2.1 KSP Crash Data
The Kentucky State Police Crash Database contains crash records collected from collision reports on all facility types across the state. This database provides the most elements required to calculate the three TIM measures; therefore, it was utilized as the primary source in this project.
One of available items in the KSP crash data is the time notified, which is essentially T1 in the timeline shown in Figure 1. While the data appear to only include the time when the state police are notified, there may be up to three notification times from EMS in the original collision report as well. This issue is brought up at the SAC meeting in November 2017, and the advisory committee decided the minimum time notified should be used in cases where more than one time exists. Time until roadway opened is another relevant item that can be obtained from the crash data. However, it is unclear whether it means all lanes or at least one lane is open to the traffic.
Therefore, an assumption is made that it would be a close approximation to T5 and it is used to calculate RCT.
Secondary crash has been a required input in the collision report for a few years, but its accuracy has been a concern. A Secondary Collision definition help button was added on 8/10/2007 and additional logic was added on 4/16/2013 to make sure users see the help message each time the
“Yes”indicator is selected for “Secondary Collision.”However, there are still confusions between secondary crashes and secondary events, resulting in secondary crashes being over reported. Aside from those items above, the time the last responder left the scene has not historically been collected. However, it is recently added as a new field to KYOPS database and is expected to become available for future works. Once this item becomes available, ICT measure can be calculated and reported. The KSP database has other important information that is not directly relevant to TIM performance measurement but are useful in subsequent analysis. These include milepoint, latitude and longitude, and route name (RT_Unique).
2.2 TRIMARC Incident Records
TRIMARC (Traffic Response and Incident Management Assisting the River Cities) is an ITS project of the Kentucky Transportation Cabinet (KYTC). TRIMARC operates a Traffic Operations Center (TOC) that monitors interstate traffic in the Louisville Metro area and the Northern Kentucky (approach to Cincinnati, OH) area. The TRIMARC TOC operates around the clock throughout the year. The TRIMARC operators work to identify the traffic incidents, work to send appropriate resources and act to warn motorist of highway incident that negatively affect interstate traffic. TRIMARC uses proprietary software to record and publish significant details regarding traffic incidents on the interstates under monitoring.
The incident data provided by TRIMARC includes both crash and non-crash incidents, including construction. It contains basic characteristics of incidents, e.g., incident type, roadway and direction, milepoint, incident beginning data/time and end data/time, incident duration, number of vehicles involved, number of lanes blocked, etc.
Of those items, the beginning date/time and end date/time are of particular interest in this project. According to TRIMARC, the beginning date/time is closely aligned with time notified. This date/time is recorded from responder’scall (generally through the CAD access in Louisville Metro, monitoring public safety radio, patrol by FSP (Freeway Service Patrol) drivers, etc.) or from an abnormal speed drop and then verified by TRIMARC operator –often through camera feed. The end date/time aligns with the time the responder leaves the scene. Generally, the police or tow services, depending on TIM needs) are usually the last to leave a scene1. However, if freeway patrol
is the only responder, the end time entry is rather accurate because of the constant communication with TRIMARC operations center.
2.3 Waze Data
Waze is a community driven, crowdsourcing navigation application program, which allows its users to obtain and share real time traffic information. Most relevant to the TIM project are incident alerts that contain crash-specific records. Those alerts are generated by users when they pass by an incident and report it via the application installed in their smartphones. Due to this reason, multiple reports could be generated for the same incident. Depending on the number of users, the first alert may provide a close approximation to the first recordable awareness of an incident. Waze jam alerts are generated automatically by the software when the traveling speed is below a certain threshold. The data contains the length of queue, congested speed, and delay information.
2.4 HERE Data
HERE speed data is collected from probe vehicles equipped with GPS-enabled devices or smartphones. There are currently two different types of HERE speed data in Kentucky. One is archived real time data for longer "Traffic Message Channel (TMC)" sections, while the other is historical speed data for shorter "links" from previous years, which has been used by KYTC for generating travel time reliability measures, identifying bottlenecks, and assisting project selection. The current study focuses on the archived real time data. The speeds can be useful from the perspective of revealing the impact of crashes. For example, the sudden speed drop is often caused by a crash and speed increase can be associated with roadway reopening. Additionally, there have been studies looking into using speed data for secondary crash identification.
3. Data Quality and Performance Measures 3.1 Roadway Clearance Time
Roadway Clearance Time (RCT) is the time between the first notification of the incident by a responsible agency and the first confirmation that all lanes are open for traffic flow. KYOPS data have information on the time incidents are reported and the time roadways are cleared. The RCT is calculated based on these (see Figure 1), however, the data have significant limitations at this time. First, the time is coded in military time whose numbers range from 0 to 2359, making it difficult to directly process the data. Some logical assumptions have to be made when querying the data and calculating the performance measures. Secondly, there are around 771,658 entries over a period of 5 years (2012-2016) in which 301,381 (about 39%) are missing data for opened time. Among the remaining 470,277 entries, 12,578 are negative values. Table 2 shows a summary of clearance time and the number of reports from 2012 through 2016.
Table 2 Average Clearance Time and Number of Reports for 2012 through 2016 Average Roadway Clearance Time* (in minutes) Number of Reports All crashes 8.5 771,658
All crashes with a non-negative clearance 19 759,080
All crashes with a clearance greater than zero 19.9 727,352
Records with a negative roadway clearance -10.5 12,578
Records with no roadway opened value 0 301,381
On removing records with a blank roadway opened
All crashes 13.9 470,277
All crashes with a non-negative clearance 31.6 457,699
All crashes with a clearance greater than zero 33.9 425,971 All crashes with a roadway clearance of 15 or more minutes 46.1 291,960 All crashes with a roadway clearance of 30 or more minutes 59.5 186,780 All crashes with a roadway clearance of 60 or more minutes 98 57,978 *If roadways opened are blank, it is assumed to be equal to the notification time resulting in a
roadway clearance of zero
3.1.1 Negative Roadway Clearance Time
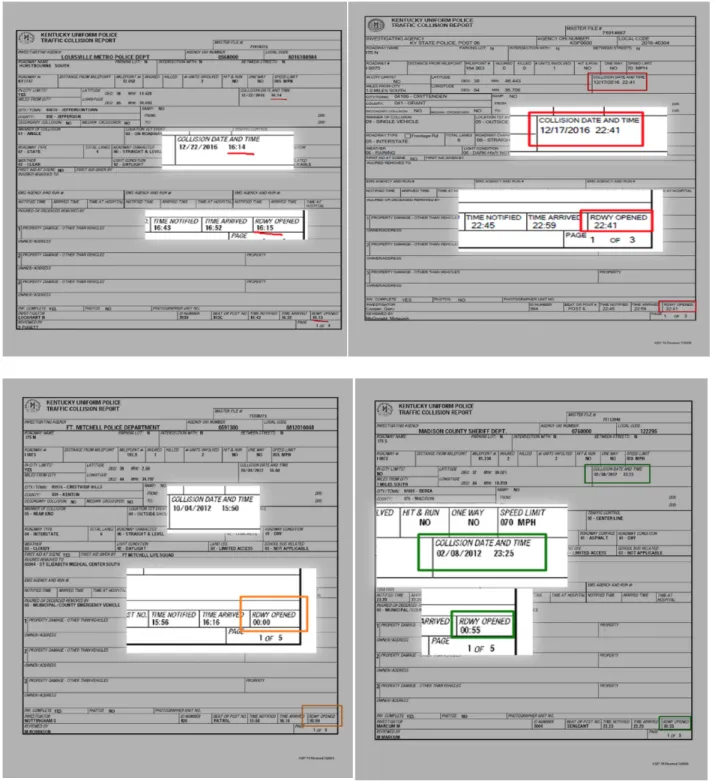
Among the non-blank entries on roadway clearance time, 3% are negative numbers which is 12,578 entries. This occurs when the Time Opened is coded earlier than Time Notified. Figure 2 shows a few examples of crash reports where Time Opened is earlier than Time Notified.
Figure 3 shows negative Roadway Clearance Times. The numbers vary from -1 to -24.
Count by Hour
6000 0 1000 2000 3000 4000 5000 -24 -23 -22 -21 -20 -19 -18 -17 -16 -15 -14 -13 -12 -11 -10 -9 -8 -7 -6 -5 -4 -3 -2 -1 Figure 3 Negative RCTThere are two possible explanations for these negative numbers — either the time was entered incorrectly, or the event spanned overnight. For example, for a crash notification occurring at 11:58pm and roadway opening at 1:00am the next day is likely to have a negative roadway clearance time, due to the way numbers are entered. To analyze these crashes with negative RCT, a random sample of 373 (with 95% confidence over a total population size of 12,578) was chosen and the narratives manually reviewed to determine which category they belong to (late evening crash that spans overnight or input error). Figure 4 shows a screenshot of how the method is executed. The red notes refer to the entries that are likely to be a typo while the green refer to late evening crashes. Hour Count -24 2258 -23 1950 -22 586 -21 263 -20 153 -19 108 -18 92 -17 59 -16 46 -15 39 -14 34 -13 29 -12 158 -11 96 -10 86 -9 57 -8 29 -7 25 -6 36 -5 54 -4 66 -3 106 -2 592 -1 5656
Figure 4 Review of Random Sample with Negative RCT
A summary of the random sample analysis and the assumptions made are shown in Table 3.
Table 3 Random Analysis of Negative RCT All times in minutes Number of Records Average ON (Time Opened minus Time Notified) Average OA (Time Opened minus Time Arrived) Average OC (Time Opened Minus Time of Collison) Number of Reports with OC=0 ON' (when OC=0, ON'=0, otherwise ON'=24+ON) Likely went to next day 176 -1,285 -1024.9 -1269.3 4 122 Likely didn't go to next day 197 -68 -63.6 -27.9 148 322.8 Total 373
It is noted that there are 176 records (about 47%) which are likely late evening crashes that spanned overnight. However, a larger number of entries (about 53%) are typos or input errors. Both cases
can be avoided by better training, which helps in improving accuracy of data. It is recommended that reporting software should include a pop-up window challenging non-realistic entries.
3.1.2 Positive Roadway Clearance Time
From the positive roadway clearance time calculated, a total of 457,699, 31,728 (about 7%) are exactly zero (See Figure 5). It is difficult to explain the validity of these numbers. This may be because the roadway never closed and the police arrived at the same time the crash notification was sent. Or, it could be because officers may not follow the definitions, “closed”or “partially closed.”
They may even ask operators and witnesses if the roadway was closed. If only minor damage and the roadway was not completely closed, it may default to the crash time as the RCT. It is recommended that the softwareinclude a popup such as “Was the roadway partiallyor completely blocked during the crash?”
0 50000 100000 150000 200000 250000 300000 350000 400000
Count by Hour
450000 1 2 3 4 5 6 7 8 9 10 11 12 13 14 15 16 17 18 19 20 21 22 23 24 Hour Count 0 399721 1 48422 2 6057 3 1765 4 739 5 375 6 182 7 110 8 58 9 51 10 78 11 24 12 39 13 25 14 7 15 4 16 4 17 2 18 7 19 5 20 4 21 3 22 6 23 11 Figure 5 Positive RCT
3.2 Incident Clearance Time 3.2.1 KYOPS Data
Time Left Scene is a new field added in KYOPS in late 2017. There are 68,271 reports with that field completed so far, however the KTC team has no access to this data yet, only the number of reports. Table 4 shows the top 10 agencies with the highest number of reports. Figure 6 shows the location of the agencies symbolized by the number of reports (a larger number of reports is indicated by a larger sized circle at the location of the agency).
Table 4 Top 10 Agencies with Highest Number of Reports
Rank Agency Reports
1 BOWLING GREEN POLICE 2573
2 BOONE COUNTY SHERIFF DEPT. 2385
3 OWENSBORO POLICE DEPARTMENT 2252
4 FLORENCE POLICE DEPARTMENT 1886
5 COVINGTON POLICE DEPARTMENT 1349
6 PADUCAH POLICE DEPARTMENT 1113
7 ST. MATTHEWS POLICE DEPARTMENT 974
8 NICHOLASVILLE POLICE DEPT. 957
9 RICHMOND POLICE DEPARTMENT 868
10 SOMERSET POLICE DEPARTMENT 855
Figure 6 Location of Agencies Symbolized by Number of Reports
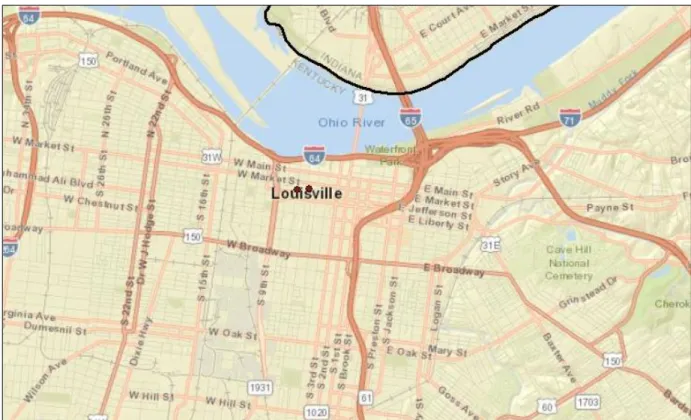
2017 database, there were 40 and 18 reports from Louisville Airport Police and Metro Police Department, respectively. Figure 7 shows low number of Louisville reports.
Figure 7 Location of Louisville Incident Reports by Agency (LMPD and ULPD)
While Louisville agencies rank 226 and 269 for reporting among the 347 agencies, Lexington Police Department ranks 341, with only one report recorded for Time Left Scene (See Figure 8). Police Departments at University of Kentucky and University of Lousiville reported 242 and 100 which ranks them at 89th and 165th in the State.
Figure 8 Location of Lexington Agencies Symbolized by Number of Reports
3.2.2 TRIMARC Data
More detailed incident clearance data is available from TRIMARC. These data contain basic characteristics of the incident such as incident type, roadway and direction, milepoint, incident beginning data/time and end data/time, incident duration, number of vehicles involved, and number of lanes blocked. Table 5 summarizes the TRIMARC incident record by incident type. The high construction/road work incident durations might be due to construction projects such as the Ohio River bridge projects, which are likely the reason for the large incident duration during 2014.
Table 5 Summary of Number of Incidents and Average Duration by Incident Type
Incident Type
Counts Average Duration (min.) 2013 2014 2017 2018 2013 2014 2017 (July to Dec) 2018 (Jan and Feb Abandoned Vehicle 864 1575 398 114 5 9 2 4 Accident 1653 1874 568 211 39 41 -
-Brush / Grass Fire 1 1 1 - 5 1 13
-Construction / Road Work 178 53 23 19 4400 20802 696 314 Disabled Vehicle 1129 51 31 - 3.4 12.4 27 -Disabled Vehicle-Occupied 4252 4412 751 258 1 19 20 22 Medical Emergency 9 7 5 1 19 25 16. 0.5 Other 32 41 9 - 6 18 8 -Police Activity 6 5 20 5 17 27 9 14 Road Hazard 11 7 5 1 30 2 70 2 Roadway Debris 432 325 20 5 5 16 13 8 Testing 1 2 - - 0 26 - -Vehicle Fire 19 22 11 6 48 31 28 54
Hit and Run - 1 3 - - 5 -
-Vehicle Overturned - 1 - - - 9 - -Amber Alert 2 - 2 - 252 - 65 -Congestion 1 - - 0 - - -Special Event 2 - 2 - 95 - 134 -Drill 2 - - - 14 - - -3.2.3 Comparison
To evaluate how crash timeline compares between TRIMARC and KSP records, three crashes were selected. The TIM timeline corresponding to TRIMARC time stamps are described in parentheses (See Table 6).
Table 6 Timeline Comparison Between TRIMARC and KSP
TRIMARC KSP
Start End Time
Crashes Time (Time Notified) (Last responder left the scene) Time
Occurred Notified Time Arrived Time Roadway Opened
1 I71 N at MP 11.0 9:04 12:05 8:51 8:51 9:03 10:45
2 I71 N at MP 8.6 10:25 15:53 10:23 10:35 10:38 16:30 3 I65 N at MP132.4 14:37 16:01 14:30 14:30 14:32 13:30 In the table, the information on time notified from the two data sources does not match. In the first and third example crashes the TRIMARC time notified is later than the KSP notified time of arrival. In contrast, TRIMARC is notified earlier than KSP on the occurrence of the second crash. The time when the last responder left the scene is not reported by KSP, but it should always be after the roadway is opened. However, for the second crash, the TRIMARC recorded time at which the last responder left the scene is 37 minutes earlier than the KSP recorded roadway open time. To further investigate this, speed data is expected to be helpful in estimating the roadway opening time, indicated by the traffic flow increases as a result of the roadway being opened. Note that for the third crash, the time roadway opened is earlier than the time occurred, which is clearly a typo. As a result, a data quality assurance process should be performed to detect similar errors and improve the accuracy of performance measures.
TRIMARC data is the only source that provides detailed records of all types of incidents. The limitation of TRIMARC data is its availability, which is limited to freeways in the Louisville metro area. However, after discussion with the advisory committee, it is determined that the scope of the project should focus on the crashes only.
3.3 Secondary Crashes
As discussed in the previous section, secondary crash data is obtained from the KSP database. It is one of the important performance measures in TIM practice.
One of the issues encountered while evaluating secondary crashes is the absence of timeline data. This makes it extremely difficult to detect errors. For example, according to the collision report (Master File Number 71521449), a crash occurred on I-65 in the Louisville area at 14:30, yet the roadway was opened at 13:30. It is very unlikely, although possible, for a crash to last that long on the interstate. If dates were available2, it would be easier to determine whether this was simply a
coding error or indicated that the crash spanned over midnight.
Times are stored in military time which is another issue that became apparent during the analysis. For example, 5:03 PM, 1:02 AM, and 12:01 AM are stored as 1703, 0102, and 0001, respectively. This makes it difficult to directly calculate the performance measures, as direct subtraction produces
some negative numbers. Some logical assumptions have to be made when querying the data and calculating the measures.
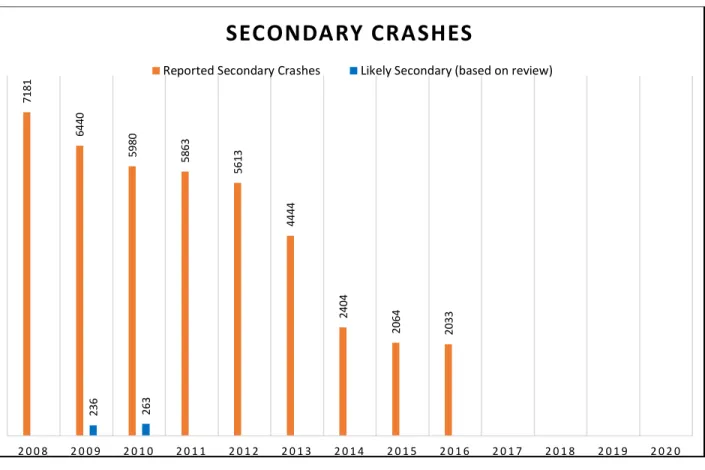
There are some secondary crashes that are not reported and some which are wrongly coded as secondary crashes. According to a previous study, only 3.6%-4.4% of crashes reported as being secondary are confirmed to be true secondary crashes in 2009 and 2010 (See Figure 9). Although ongoing training should improve the reporting accuracy, corrections will still be needed to more accurately estimate the secondary crash performance measure.
SECONDARY CRASHES
Reported Secondary Crashes Likely Secondary (based on review)
2 0 2 0 7181 6440 5980 5863 5613 4444 2404 2064 2033 236 263 2 0 0 8 2 0 0 9 2 0 1 0 2 0 1 1 2 0 1 2 2 0 1 3 2 0 1 4 2 0 1 5 2 0 1 6 2 0 1 7 2 0 1 8 2 0 1 9
Figure 9 Secondary Crash Percentage
To confirm or update (if required) these numbers from previous study, a careful review of random samples of crashes was done for years 2015-2017. The process is explained in the following section.
3.3.1 False Positive (Type I Error)
False Positive or Type I Errors are those crashes which are coded as secondary but are not actually secondary crashes. A statistically significant (95% Confidence Interval) random sample of secondary crashes from 2015 to 2017 were manually reviewed to identify the Type 1 Errors. In the process, a rating between 1 and 10 was used to symbolize certainty. Most of the identified false positives were rated 10, symbolizing high confidence. Figure 10 shows an example crash narrative which is identified as false positive.
Figure 10 Example Crash Narrative
The detailed statistics on the crashes reviewed are shown in Figures 11 through 13.
• Crash Report Dates:
2015 Secondary Collision Data
01/01/2015 –12/31/2015• Total Crashes Recorded: 2087
8%
92%
• Sample Size: 300 • Confirmed Positives: 25 • False Positives: 275
Confirmed Positives False Positives
•Crash Report Dates:
2016 Secondary Collision Data
01/01/2016 –12/31/2016•Total Crashes Recorded: 2064 •Sample Size: 324
•Confirmed Positives: 28 •False Positives: 295
Figure 12 2016 Secondary Collision Data
• Crash Report Dates:
2017 Secondary Collision Data
01/01/2017 –12/31/2017• Total Crashes Recorded: 180 •Sample Size: 300
•Confirmed Positives: 40 •False Positives: 260
Figure 13 2017 Secondary Collision Data
Table 7 shows how the likelihood of a reported secondary crash being accurate has changed during recent years. The number of secondary crashes has decreased, while the number of confirmed secondary crashes has increased, proving that the number of crashes wrongly coded as secondary crashes are decreasing. The table shows that the percent of confirmed secondary crashes (or the percent of crashes which are correctly identified as secondary) has improved during the recent years.
9%
91%
Confirmed Positives False Positives
13%
87%
Table 7 Type 1 Crashes Over Time
Year Total Crashes Reported Secondary Crashes Confirmed Secondary (based on review) Percentage of Confirmed Secondary Percentage of False Positives 2008 7181 2009 6440 236 3.7 2010 5980 263 4.4 2011 5863 2012 5613 2013 4444 2014 2404 2015 161393 2064 172 8.3 0.107 2016 165273 2033 182 9 0.11 2017 161681 2056 274 13.3 0.169
This decline of Type 1 errors (False Positive) over time shows improvement in accuracy which is likely due to improved training of first responders. Figure 14 displays a bar chart showing how the type 1 errors in coding secondary crashes have declined over time.
SECONDARY CRASHES
7181
Reported Secondary Crashes Likely Secondary (based on review)
6440 236 5980 263 5863 5613 4444 2404 2064 172 2033 182 2056 274 2 0 0 8 2 0 0 9 2 0 1 0 2 0 1 1 2 0 1 2 2 0 1 3 2 0 1 4 2 0 1 5 2 0 1 6 2 0 1 7
Figure 14 Bar Chart Showing Type 1 Crashes Over Time
Based on these numbers, it is possible to predict the future trend of type 1 errors. Figure 15 shows a linear trend line predicting the percent of confirmed secondary crashes for the future.
PE RC EN T CO RR EC T
Trendline for Type 1 seconday crashes
20.0 18.0 16.0 13.3 14.0 12.0 2008 2009 2010 2011 2012 2013 2014 2015 2016 2017 2018 2019 2020 2021 2022 2023 2024 4.4 8.3 9.0 10.0 8.0 6.0 3.7 4.0 2.0 0.0 YEAR
Reported Secondary Crashes Percent Likely Secondary Linear (Reported Secondary Crashes Percent Likely Secondary)
Figure 15 Linear Trend Line Showing the Percent of Confirmed Secondary Crashes Figure 16 is another interpretation of the same result. The graph shows the percent of crashes correctly identified as secondary among all crashes reported statewide. As described above, the number of crashes correctly identified as secondary has improved during the last few years and accuracy is expected to improve with better training.
Statewide trendline for Type 1 secondary crashes
0.350 0.300 Per ce nt C orrec t 0.250 0.200 0.150 0.100 0.050 0.000 0.107 0.110 0.169 2015 2016 2017 2018 2019 2020 2021 2022 Year
3.3.2 False Negatives (Type II Error)
False Negative or Type II Errors are those crashes which are not coded as secondary but are actually secondary crashes. Figure 17 shows the narrative of an example crash which is identified as a secondary crash but not reported in the crash report.
Figure 17 Example Narrative
As those false negatives are hidden among all the crashes, it is very challenging to review all the narratives in order to identify them. Even using a sampling approach, a large number of crash reports must be reviewed given the large number of crashes occurring in a year. For example, around 9000 crash reports (5.4% of total 165273 crashes) from 2016 would need manual review to have a higher confidence in the result. To deal with the issue, a spatiotemporal method was developed under the notion that a secondary crash must be close to the primary crash. The method used pre-defined space and time thresholds to identify candidate primary and secondary crash pairs, significantly reducing the number of crashes to be reviewed.
To figure out the optimal thresholds, I-65 and US-31W were selected as test sites to represent the access controlled and urban arterial cases. Fairly large values, i.e., 5 miles and 5 hours were initially used to obtain candidate crash pairs. There were 637 and 864 crash pairs identified for I-65 and US-31W, respectively. The associated crash reports were then reviewed to confirm whether the crash was actually secondary. Among previously identified crash pairs, 25 and 6 of them were confirmed to be secondary crashes for I-65 and US-31W. Finally, the space and time gaps between secondary and primary crashes were calculated, based on confirmed secondary crashes. The results are presented in Figure 18 for I-65 and Figure 19 for US-31W.
0 0.25 0.5 0.75 1 1.25 1.5 1.75 2 0 10 20 30 40 50 60 70 80 90 100 D ist an ce (m ile s)
Time Gap (minutes)
I-65
Figure 18 Space and Time Gaps from Identified Secondary Crashes on I-65
US31W
0.25 0.2 D is ta nce ( mi les ) 0.15 0.1 0.05 0Time Gap (minutes)
0 5 10 15 20 25 30 35 40
Figure 19 Space and Time Gaps from Identified Secondary Crashes on US-31W
Based on the results, 2 miles and 100 minutes are the suggested thresholds for access-controlled highways, and 0.5 mile and 40 minutes are suggested for implementation on remaining roadways, including urban arterials and rural roadways. During the May 1st SAC meeting, the panel concurred with the recommendations.
To account for the potential secondary crashes that do not occur on the same road as the primary crashes, a buffer radius of 1000 ft was used to determine candidate crash pairs. The radius value is consistent with a previous KTC project.3
The spatiotemporal approach was implemented for the entire state in years 2015, 2016, and 2017. There were 3671, 3847, and 3438 candidate crash pairs identified for 2015, 2016, and 2017, respectively. The associated crash reports were retrieved based on the unique master file number. As it is very time-consuming to read every report, a text mining tool — specifically, Optical Character Recognition (OCR), was used to covert the narratives that were unsearchable into searchable text. Since the narrative must contain some key words to confirm whether a crash is secondary or not, the narratives that lack those key words would be automatically omitted. The key
words are defined asany ofthe following: “crash”, “accident”, “incident”, “collision”, “wreck”, “10-49”, “10-48”, “10-47”, “10-46”, or anylocalcode. This stepcan eliminate about half ofthe
crash pairs, which significantly reduces the amount of manual review. The narratives of the remaining crashes would be manually reviewed to identify actual secondary crashes.
Table 8 shows the summary of crashes identified as False Negatives during the period 2015-2017. There are three categories in the table. Congestion means the secondary crash occurred due to the congestion from the previous crash. Rubbernecking indicates the secondary crash was due to drivers being distracted by other crashes. The third type, within crash scene, generally means the crash happened due to following two scenarios. First, vehicles follow too closely and as the front vehicle gets involved in a crash, the following vehicle cannot stop in time to avoid the crash. The second scenario is that the vehicles involved in a previous crash are already stationary on the road and due to lighting condition or roadway curvature, other vehicles couldn’t see the stationary vehicles, resulting in a secondary crash. Driver inattention may also result in many back of queue serious crashes. Figure 20 shows spatial visualization of all the false negative crashes tabulated in Table 8.
Table 8 Summary of Statewide Type II Errors by year and cause
Crash Cause 2015 2016 2017 Total
Congestion 155 160 114 429
Rubbernecking 35 39 29 103
Within Crash Scene 159 195 178 532
Total 349 394 321 1064
3 Pigman, J., E. Green and J. Walton, “Identification of Secondary Crashes and Recommended
Countermeasures,” Kentucky Transportation Center Research Report KTC-11-06/SPR402-10-1F, May, 2011
Figure 20 Spatial Visualization of False Negative Secondary Crashes (2015-2017)
On examining the trend of false negatives (type II) errors for the study period (2015-2017), the number of these errors have decreased in 2017 compared to previous years (See Table 9).
Table 9 Summary on False Negative Secondary Crashes
2015 2016 2017 Total Crashes 161393 165273 161681 No of Secondary Crashes 2064 2033 2056 No of False Negatives 349 394 321 Percentage of False Negatives 0.216 0.238 0.199
Using the data from Table 10, an exponential trendline was created which predicts how likely these numbers will vary in the future. Figure 21 shows the trendline of how the percent of false negative crashes are expected to decrease in the future.
Pe rc en t o f Fa ls e N ega ti ve Cr as he s (o r Pe rc en t M is se d to R epo rt as Se co nda ry Cr as he s) False Negatives 0.250 0.238 0.200 0.150 0.100 0.050 0.000 2019 2020 2021 2022 0.216 0.199 0.300 2015 2016 2017 2018 Year
Figure 21 Trendline for False Negative Crashes
Special training programs can be arranged for agencies with high number of false negatives reported, which can help lower these numbers in the future. Table 10 shows the top agencies with highest false negative reporting agencies and Table 11 shows the ranking of KSP posts based on the false negative secondary crashes, during the period 2015 - 2017. On combing the police departments and the KSP posts, the top 10 agencies that have the most identified false negatives from 2015-2017 are identified (See Figure 22). These agencies have the highest number of false negatives reported however, they are not likely the top 10 agencies with the highest percentage of False Negative Secondary Crashes reported. Table 12 shows the percentage of false negative crashes identified in these agencies during the period 2015 – 2017. The major agencies like Louisville metro police department or Lexington Police department have large number of crashes reported and therefore the percentage of false negatives secondary crashes identified seems negligibly small for these agencies
Table 10 Top 10 Police Departments with Highest False Negatives (2015-2017) Agency Total Crashes (2015-2017) False Negatives
LOUISVILLE METRO POLICE DEPT 90319 287
LEXINGTON POLICE DEPARTMENT 50778 109
FLORENCE POLICE DEPARTMENT 8162 18
BOWLING GREEN POLICE 11987 14
LAUREL COUNTY SHERIFF DEPT. 3177 13
ROCKCASTLE COUNTY SHERIFF DEPT 807 12
SCOTT COUNTY SHERIFF DEPT. 1967 12
BOONE COUNTY SHERIFF DEPT. 10284 12
FT. MITCHELL POLICE DEPARTMENT 1295 11
FRANKLIN COUNTY SHERIFF DEPT. 1712 11
ERLANGER POLICE DEPARTMENT 3730 11
NICHOLASVILLE POLICE DEPT. 3942 11
COVINGTON POLICE DEPARTMENT 6241 11
Table 11 Ranking of KSP Post Based on False Negatives (2015-2017) Kentucky State Police Posts Crashes Total Negatives False
KSP POST 03 3308 24 KSP POST 05 2674 16 KSP POST 04 2390 14 KSP POST 06 1886 11 KSP POST 02 2289 9 KSP POST 11 2201 8 KSP POST 07 2429 8 KSP POST 01 1764 7 KSP POST 09 4144 7 KSP POST 12 1413 5 KSP POST 16 1831 4 KSP POST 14 1133 3 KSP POST 08 1652 3 KSP POST 13 2596 3 KSP POST 15 792 2 KSP POST 10 1532 2
Figure 22 Top 10 Agencies with Highest False Negatives Identified (2015-2017)*
*Note, KSP totals by post, not agency. As an agency, KSP ranks second with 126 false negatives. For context, the top three agencies also have by far the most police reports.
Table 12 Top 10 Agencies with Highest Percentage of False Negatives (2015-2017)
Agency Crashes Total
(2015-2017) False Negatives Percent of False Negatives
West Point Police department 99 2 2.02
Morgan County Sheriff Department 58 1 1.724
Rockcastle County Sheriff Department 807 12 1.487
Lebanon Junction Police Department 72 1 1.389
Carroll County Sheriff Department 362 5 1.381
Gallatin County Sheriff Department 655 8 1.221
Auburn Police Department 82 1 1.22
Wilder Police Department 808 8 0.99
Kenton County Sheriff Department 108 1 0.926
4. Summary 4.1 Data Sources
There are a variety of data sources that are currently available in Kentucky that are relevant to the measurement and assessment of TIM practice. However, their availability and applicability vary. Table 11 summarize the spatial and temporal coverage of the data sources and the TIM data elements available under each of them.
Table 11 Data Source Comparison
Data
Source Data Type
Spatial Coverage Temporal Coverage (currently available to the project team)
TIM data elements
KSP Crashes Statewide, all
facilities 2012-2016
Time notified, time roadway opened, secondary crashes, time last responder left scene (coming
soon) TRIMARC Incidents including crashes Louisville metro area, Interstates 2011-present4
Time notified, time last responder left
the scene Waze Incidents including crashes Statewide, heavily
traveled roads 2015-2016 Time notified Jams
Statewide, heavily
traveled roads 2015-2016 NA
HERE Speeds Statewide, NHS 2016 NA
Based on the assessment of data sources and its quality, Kentucky State Police (KSP) Crash Data is the primary and best available data source for TIM performance measurements. The other data sources identified are good supplements to these measurements and they might be useful for future work. Several key takeaways from the data source analysis are mentioned below.
• There is a time lag between Waze reported accident time and the KSP collision time or notification time. This is understandable since Waze incident alerts are entirely depending on a roadway user’sactions.
• Waze speeds appear to be more reflective of the actual traffic condition immediately after a crash, when and where data are available. Based on observation, a Waze jam alert (which contains speed data) is usually generated when speed drops below certain level on a roadway.
• HERE speeds represent traffic conditions at the Traffic Message Channel (TMC) level while the slowdown caused by a crash happens upstream of the crash location. As a result, the speeds on long TMCs may not immediately show the impact of crashes after they occur. However, HERE data has a coverage advantage and, based on this investigation, is able to reveal the impact zone resulting from a major crash. This will be valuable in future analyses. Using shorter link level speed data could improve the sensitivity of speeds to the impact of crashes. However, the current subscription KYTC holds with HERE data is only at the TMC level.
• All the data sources can provide some information from different aspects, hence developing a scheme to use them collectively is likely to enhance the explanatory ability of those data and better fulfill TIM performance assessment purposes.
4.2 Performance Measures
The three major performance measures: Roadway Clearance Time (RCT), Incident Clearance Time (ICT), and Secondary Crashes (SC) were evaluated for the quality of data and to identify the scope of future improvements. Due to the limited data available on Incident Clearance, the evaluation of performance measures focused on Roadway Clearance Time and Secondary Crashes.
The incident time in the KYOPS data is coded in military time, which is difficult to process. Although some logical assumptions were used to process data in order calculate the RCT, they were assumptions, nonetheless. About 39% of the data had missing entries for “timeopened”and of the remaining records, about 3% (12,578) were coded with “timeopened”earlier than “time notified”.
After careful review, it is concluded that 53% of these anomalies are likely typos while the rest are due the integer nature of military time format with no recording of end date.
The errors on secondary crashes are decreasing over time and the accuracy is expected to improve in the future. This is likely due to improved training of first response personnel. Over the last three years (2015-2017), the number of crashes correctly identified as secondary crashes has improved (8.3% in 2015 and 13.3% in 2017). Similarly, the number of crashes wrongly coded as secondary crashes are declining over time. However, agencies with the highest number of errors reported were identified, with the recommendation of providing better training programs.
4.3 Implementation Potential and Recommendations
The metric developed and studies in this report can be implemented over the course of FY19 at the KYTC. This report can also be used to satisfy requirements for the FHWA Every Day Counts
“Accelerating Traffic Incident Management” program. Future year data can be analyzed and presented internally by KYTC offices or KTC, as desired.
Kentucky is among the only 7 states that have all three performance measures. “Responders struck by”was recently added by FHWA as an important measure in addition to ICT, RCT and secondary crashes. Investigation of this metric could be a logical next step. Other states (e.g., PA, FL, and Puerto Rico) have TIM dashboards for performance tracking. Development of a Kentucky dashboard could also be undertaken. Two other states have implementation processes that Kentucky may wish to investigate:
- Virginia is using real-time queue information to help make response decisions, e.g. clear up the accident on the scene or push involved vehicles to the side for later cleanup;
- Utah is looking to use CAD and traffic data to evaluate the relationship between the number of response vehicles and user costs.
KTC recommends that dates be added to all time fields in the crash database, if practicable. Some states collect more information on secondary crashes.
Arizona has 17 fields related to that specific type of crash. Kentucky may wish to investigate the utility of additional fields and make a determination on the practicality of adding one or more of them.
In order for KTC and/or KYTC to be able to make use of the newly added Incident Clearance Time field from the crash form, they need access to that data, not currently provided by KSP.
Finally, since the Kentucky crash form time data is stored in military time, post processing is required to analyze. Kentucky should consider storing the data as a time field to eliminate confusion between blank, zero, and midnight data.
Appendix A
–
Other Potential Data Sources (Waze and HERE Speed Data)
New sources of “big” data are becoming available that may be of use in monitoring trafficincident
management. These sources could be used to improve estimates of the three currently mandated TIM metrics (road clearance, incident clearance and secondary collisions.) They may also permit measurement of other impacts of incidents, namely the lingering effects of incidents on traffic congestion. For example, a crash related to traffic caused by an incident should be considered as a secondary collision, even if it occurs after the primary incident has been cleared.
Waze is a crowdsourcing navigation application program, which allows its users to obtain and share real time traffic data. For the TIM project, the incident alerts generated in the application that contain crash specific records are used. Waze data could be available statewide as long as users submit their reports. However, the availability is subject to the number of users and may be limited to heavily traveled roads. Figure 23 is an example showing the location of Waze accident reports at the state level in 2016.
Figure A1 Statewide Accidents Reported Through Waze in 2016
It should be noted that no consolidation is performed at this time and there may be multiple records for the same crash. Clusters of reports can be found in the metropolitan areas and other reports are mainly on the interstates.
Figure 24 through 27 shows the close-up maps of Louisville metro area and Somerset. KSP crashes are also displayed for respective areas so as to provide a visual comparison between two data sources and get a sense of the completeness of Waze accident reports.
Figure A2 Waze Accidents in Louisville
Figure A4 Waze Accidents in Somerset
Based on the maps, it can be seen that Waze is significantly underreporting crashes.
HERE is another speed data resource available only on the National Highway System (NHS). Figure 28 through 30 shows its spatial coverage for the whole state, Louisville metro area, and Somerset area, respectively.
Figure A6 HERE Coverage Statewide
Figure A8 HERE Coverage in Somerset Area Examples:
To provide a more detailed evaluation on the consistency of these data, two fatal crashes are selected based on the KSP database.
Example 1 - Fatal Crash on I-71S MP 7.293 at 21:11 on 5/10/2016
Figure 31 shows the location of the chosen crash. The blue marker on the map shows the exact location of the crash. There are nine Waze accident records that seemed to be related to this crash, locations of which are represented by red markers on the map. The first Waze alert is generated at 21:19 while the last one is reported at 22:54.
Figure A9 Location of I-71 Fatal Crash
The next step is to look at how timelines from KSP and Waze compare and whether speeds from HERE and Waze can reveal the impact of crashes. Figure 32 shows the crash timeline and speed pattern of the crash based on Waze and HERE data. The black and orange triangles indicate the information on the crash from KSP and Waze, respectively. The blue line represents the speed trend based on HERE data while green dots are the speeds from Waze jam data.
Figure A10 Crash Timeline and Speed Pattern
It can be seen that Waze can pick up the crash impact more quickly than HERE does. Also, the impact in terms of speed slowdown is more significant based on Waze than HERE. Waze speeds are indicative of instantaneous speeds at particular time and location and this is probably the reason for speed slowdown. In contrast, HERE speeds are aggregated into 2-minute intervals over the whole TMC, which in this case is about 4 miles long from the I-265 junction to the I-264 junction. As a result, there would be a time lag for the impact of the crash to be seen at the upstream TMCs. From the spatiotemporal perspective as represented by the following heat map (See Figure 33) the resulted queue also propagated to the upstream TMC. Note that the direction of travel is southbound, i.e., from higher milepoint to lower milepoint on the heat map. Due to the reason explained above, the impact of the crash appeared earlier on the upstream TMC.
Crash
Figure A11 I-71 Speed Heatmap
Example 2 - Fatal Crash on Dixie Highway (US31W) MP 12.146 at 16:20 on 5/16/2016
Figure 34 shows the location of second fatal example. Ten minutes after this fatal crash, a non-fatal crash occurred (at 4:30PM) about 1.2 miles upstream of the prior fatalcrash. It’sunclear ifthisis
a secondary crash; it needs further investigation to verify. The first Waze incident report came in at 16:30 and a few more are reported at 17:03 and 17:28 near the fatal crash site. The last Waze alert is at 18:42.
Figure A12 Location of US-31W Fatal Crash
Figure 35 shows the EMS (red triangles) and police timeline of the crash (black triangles), HERE speed trend, Waze incident alerts and jam reports (green dots). The 2nd crash occurred on the upstream TMC, based on the coordinates provided in the crash report.
Figure 36 shows heat maps from HERE data. The one on the left shows speeds on the day of the crashes (which is a Monday), and the one on the right shows a typical eventless Monday (5/2/2017). Since the location of the 2nd crash is right at the beginning of the upstream TMC, it is assumed as a secondary crash.
Crash