A risk-oriented approach to
capital management at a power generation
company in Russia
A. Domnikov, P. Khomenko & G. Chebotareva
Ural Federal University named after the first President of Russia B. N. Yeltsin, Russia
Abstract
One of the challenges facing the energy industry today is how to improve investment attractiveness and business competitiveness in energy generation. It is becoming particularly important to enhance the sectoral risk management systems in order to ensure long-term growth and sustainable development in the energy sector amidst numerous factors and uncertainties created by the globalization of the financial markets. This paper presents the authors’ approach to assessing sectoral risks in the energy industry based on capital management for the purpose of achieving a certain level of long-term financial stability. The practicalities of applying the proposed approach to sectoral risk assessment are considered using a power generation company as an example.
Keywords: power industry, energy company, competitiveness, risks, risks management, economical capital, market risks, credit rating, financial sustainable, investments.
1
Introduction
It is common knowledge that the energy industry is one of the key and most important sectors of the economy in any country. Producing a profound and complex impact on the activities of both industrial and non-industrial companies, the energy sector acts as a factor of growth in global competitiveness for companies and a driver of development for economies.
In the course of its evolutionary development, however, the energy sector as a whole and companies within it come to face considerable problems arising in the form of sectoral risks. These, in turn, have a negative impact on the
competitiveness of this sector. The authors therefore see it as an important task to carry out a complex analysis of modern-day risks in the energy sector and develop a methodological toolkit for assessing them allowing for contemporary developments in risk management.
The outcome of this study is the authors’ methodological approach to economic capital estimation that allows risks to be identified in a timely manner and the threat they present to the energy company to be assessed by evaluating the cost of this threat. The results have practical importance and are used for evaluating the investment attractiveness of energy companies.
2
Basics of risk assessment and management in the
modern energy sector
A review of risk management systems in the historical context has shown that risk-management related issues became crucial and widespread in the middle of the 20th century. That period of time saw the first publications devoted to comprehensive studying of risks and issues related to risk assessment and management. Among the authors who developed the basis of the contemporary risk management system are Alle [1], Markowitz [2], Miller [3], Sharpe [4], Kahneman [5], Smith [6], etc.
In today’s international practice, risk management is regulated by such basic international acts as the integrated risk management framework adopted by the Committee of Sponsoring Organizations of the Treadway Commission (the COSO-ERM model); the risk management standard of the Federation of European Risk-Management Associations (FERMA, the RMS model); and the standards adopted by the Bank for International Settlements (Basel II).
In the economic science, there are various definitions of risk. Limiting the plurality of theoretical approaches for the sake of this study, risk may be understood as an uncertainty in the economic performance of an energy company whereby the financial outcome is represented by a probabilitistic estimate. Unfortunately, the lack of risk assessment models that could be readily used by energy companies (taking into account their specific features) presents a barrier to consideration of this issue. Admittedly, the study carried out by KPMG Market Risk Management at Russian Power Companies [7] lists the most popular methods of quantitative risks assessment: scenario analysis (58% of responses), Value at Risk (29%), stress testing (13%), Gross Margin at Risk (13%), etc. Also, the Monte-Carlo method of project risk simulation proposed by Herz in 1964 is considered to be classical [8].
Due to the low level of development characterizing risk management systems in the electrical energy industries of the developing countries, the companies of this sector face considerable difficulties in risk analysis and management. A number of analytical studies [7] have made it possible to identify problems sought after in this study:
1. 83% of companies lack a documented policy of sectoral risk management; 2. Companies lack a dedicated division implementing a comprehensive risk
3. In their sectoral risk management, energy companies focus on their financial performance for the period rather than shareholder or balance sheet value; 4. Limited use of hedging as a risk management tool;
5. Limited use of professional market models in forecasting, etc.
This incomplete list of problems confirms the low level of development of risk management systems at power companies in developing countries. The authors therefore regard it to be the main goal and further focus of this study to be the development of their own methodological approach based on the assessment of industry-specific risks through the estimation of their costs.
3
Risks the power companies face at the present stage
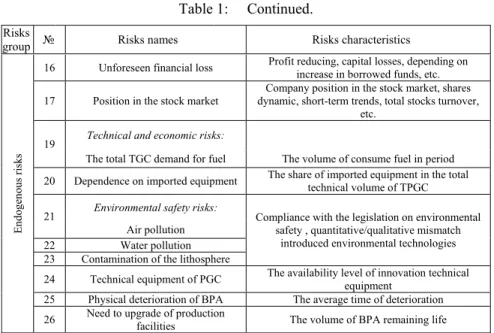
Long-term comprehensive studies of development factors for energy companies [9, 10] have allowed us to identify a number of specific risks that are most important and significant to this sector at the current stage of its development. These risks, arranged in groups and provided with short characteristics, are presented in Table 1 [9, 10].
Table 1: Industry risks of the power companies.
Risks
group № Risks names Risks characteristics
Exoge
nou
s r
is
ks
1 Gross regional product Region economic activity
2 The development of region industries Major industries of the region, the city-forming enterprise 3 Investments to the region capital Costs financial to the BPA making and reproduction 4 diversification Technological Composition and structure of the region resources 5 production capacities Concentration of The maximum possible capacity of the power objects 6 Bandwidth of inter-territorial energy
relations
Ratio bandwidth electrical connections between areas to the greatest power shortages
7 Energy self-sufficiency Using your own types of energy
8 Tariff policy Company dependence on changes in tariffs by type of energy produced 9 Tax policy Influence the actions of tax authorities on the activities of company 10 Currency exchange Company dependence of exchange rate changes 11 Interest rates on loans Company dependence on changes in the cost of resources involved 12 Fuel price Company dependence on changes in prices by fuel type 13 Efficiency of electric power resources use The ratio of volume, resources and profit derived structure of company 14 Consumption efficiency of electricity and heat Total volume of energy losses during delivering to consumer 15 Company position in a competitive market Company position in the ranking of making activity indicators, dynamic and trends of factors
Table 1: Continued. Endo ge no us ri sk s
16 Unforeseen financial loss Profit reducing, capital losses, depending on increase in borrowed funds, etc. 17 Position in the stock market dynamic, short-term trends, total stocks turnover, Company position in the stock market, shares
etc. 19 Technical and economic risks:
The total TGC demand for fuel The volume of consume fuel in period 20 Dependence on imported equipment The share of imported equipment in the total technical volume of TPGC 21 Environmental safety risks: Compliance with the legislation on environmental
safety , quantitative/qualitative mismatch introduced environmental technologies Air pollution
22 Water pollution 23 Contamination of the lithosphere
24 Technical equipment of PGC The availability level of innovation technical equipment 25 Physical deterioration of BPA The average time of deterioration 26 Need to upgrade of production facilities The volume of BPA remaining life
Figure 1 shows the map of risks, demonstrating which of the factors are less or more risky [9, 10].
The borderline that passes through the centre of the risk map divides it into two parts depending on the importance of a sectoral risk. Movements in relation to this boundary value point to a decreasing or increasing threat in relation to the initial level of threat presented by the risk factor.
The left part of the map shows less dangerous risks, including: tax policy, physical wear and tear of fixed assets, development of region’s specialty industries, etc.
The right part of the map shows risks that produce the greatest impact on the development of a power company and its projects: technological risks, fuel price risks, changes in prices on the electric power market, etc.
3 19
10 12
9 21 20
5 6 4
2 25
Figure 1: Energy company development risk map (with reference to Russia).
Th e in cr eas in g o f r is ks lev el
The increasing of dangerous risks level Risks
4
A methodological approach to assessing sectoral risks for a
power company
The methodological approach developed by the authors of this study to managing the sectoral risks of an energy company is based on the concept of economic capital, which is popular in risk management. Economic capital is the amount of capital that a company requires to cover the risks that it is running in order to secure maintenance of a certain standard of solvency or in case of default [11]. In other words, it is the amount of capital, which the company needs to have for the purpose of covering losses that may arise as a result of risk realization. Economic capital is estimated from aggregated distribution of risks for a given confidence level, which, in turn, is determined by the company’s target financial stability. Economic capital allows the company to protect itself against losses due to risk realization. The target financial stability is usually expressed in terms of credit rating: the higher the credit rating, the higher the probability of the company staying solvent and the less the probability of default, respectively.
In a context where it is essential to enhance the investment attractiveness of power generating assets it becomes important to be able to determine the strategic level of financial stability identified as a long-term target within the framework of sectoral risk management. Such target level of financial stability can be determined by the target long-term credit rating that the power generating company aims to achieve. An important factor in assessing and managing risks is thus the net worth of the company and its development strategy. Each credit rating may be assigned a certain level of default probability corresponding to it depending on the forecasting horizon. One of the variants of correspondence between credit rating and default probability is presented in Table 2.
The probability of default determines the confidence level required for calculating unforeseen losses and economic capital for a power generating company (1):
1 PD
γ = − (1)
where γ – confidence level, which determines the probability of non-bankruptcy,
PD – level of default probability, corresponding to the target credit rating. Identification of sectoral risks allows the group of the most serious risks to be identified for a power company. The extents of estimated sectoral risks may be different depending on the influence the operating specifics of a power generating company may have, on the territorial location features of the power assets, and on the sensitivity of the power company capital to individual risk factors. In our approach, we have identified three most important risks for a power company: the risk of price changes in the power and capacity markets, the risk of price changes in fuel markets, and the operating and technology risk. These risks have been chosen on the basis of the study carried out by KPMG, who surveyed managers of Russian power companies [7]. In this the study, these risks are mentioned as the principal threats to the energy business, risks associated with changes in electricity and fuel prices being the least manageable. That these risks need to be assessed and managed is also confirmed by our earlier studies [9].
Figure 2: Assessment of the economic capital for different financial stability criteria.
Table 2: Correspondence between the probability of default and credit rating.
Rating 1-Y PD 3-Y PD 5-Y PD
AAA 0.008% 0.03% 0.1% AA 0.04% 0.16% 0.28% A 0.16% 0.4% 0.58% BBB 0.3% 1.4% 3% BB 1.15% 8.6% 15% B 5.8% 15.4% 32.6% CCC or lower 26.57% 45.5% 60%
The extent of each type of risk was measured individually on the basis of the VaR methodology. For assessing market risks, we chose the parametric approach. This approach involves risk assessment based on the construction of a statistical model for the financial outcome in relation to the portfolio of assets. In parametrical models, the probability distribution function for risk factors features a certain shape, for example, a normal probability distribution with parameters estimated on the basis of historical data. This approach to risk management is implemented in the system developed by Morgan [12]. The parametric approach assumes normal distribution of risk factors. In risk assessment, the measure of risk is variance or mean-root-square deviation (or volatility). Thus, the main objective in estimating VaR by the delta-normal method is to find the variance of return for a single position at risk or for a set of several positions (2):
i i
ML VaR k= = γ⋅ ⋅ ⋅σ V T (2)
where MLi – maximum losses from the i-th type of risk, VaRi– VaR value for the
i-th power generating company risk kγ – confidence factor (determined by the confidence level), V – the current value of the position; Т – time horizon;
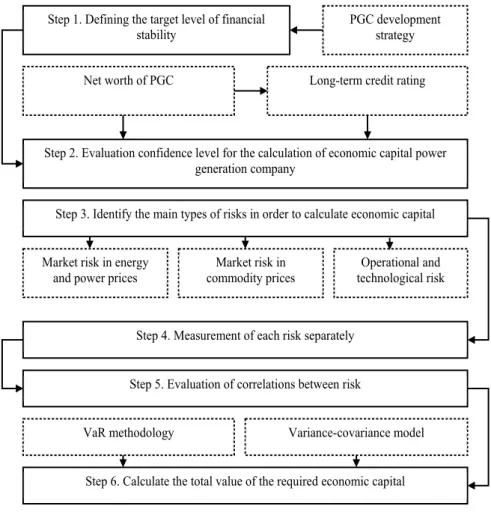
Figure 3: Methodology for energy company risk assessment.
Loss from the operating and technology risk depends on individual factors characterizing a power facility, such as unintentional failures in operation, incorrect choice of operating and process equipment, violation of operating and maintenance procedures, irregular inspection and maintenance of equipment, technical condition of the equipment, loss as a result of failures and breakdowns, repair and recovery costs, etc. Modeling this type of risk implies identification and aggregation of risks factors on the basis of mathematical and econometric constructions. Because the level of operating and technology risk is individual in each case, estimating loss due to operating and technological risk for the purpose of this study will be performed based on historical simulation. This method involves constructing an empirical distribution function using a certain number of
Step 1. Defining the target level of financial stability
Step 2. Evaluation confidence level for the calculation of economic capital power generation company
Step 3. Identify the main types of risks in order to calculate economic capital Market risk in energy
and power prices
Step 4. Measurement of each risk separately Step 5. Evaluation of correlations between risk
PGC development strategy Long-term credit rating Net worth of PGC
Market risk in
commodity prices technological risk Operational and
VaR methodology Variance-covariance model
losses due to the operation and technology risk from a historical series. Such construction enables one to easily find the α-quantile, which is just the value of
VaR.
Economic capital for the i-th type of risk is determined taking into account maximum and expected losses (3):
i i i
ECAP ML EL= − (3) where ECAPi – economic capital of i-type risk ELi – mathematical expectation of losses from the i-th type of risk.
Within the framework of the modern approaches, risks are assessed taking into account their correlations. In particular, VaR assessment can be performed for both non-diversified VaR, making a rough assumption that correlation coefficients are equal to 1, and for diversified VaR, enabling one to obtain more precise quantitative risks estimates. Correlation coefficients are determined from historical data for individual risk components. To begin with, we can use risk VaR time series for estimating historical correlations (for computation it is essential to take a period of at least a year). Correlation coefficients required for the analysis can be determined on the basis of Pearson correlation coefficient determined on the basis of the historical series.
An aggregated estimate of economic capital is obtained by means of the variance-covariance method. According to this method, individual risks are aggregated in an overall estimate of economic capital taking into account existing correlations. With regard to the risks included by us into the model, the amount of economic capital is given by (4):
2 2 2 ,
, ,
2
2 2
PGC EMR CMR TR EMR CMR EMR CMR
EMR TR EMR TR CMR TR CMR TR
ECAP ECAP ECAP ECAP ECAP ECAP
ECAP ECAP ECAP ECAP
ρ
ρ ρ
= + + + +
+ + (4)
where ECAPPGC – aggregate economic capital energy company, ECAPEMR –
economic capital market risk in energy prices and power, ECAPCMR – market risk
economic capital energy prices, ECAPTR – economic capital operational and
technological risk, ρi j, – the correlation between the two components i and j risk. The final estimate of economic capital shows the capital requirements of the energy needed to maintain the financial stability of the appearance of losses from unexpected losses with a given probability level.
5
Practical implications of risk assessment for a
power company
Consider application of this methodological approach to risk assessment with reference to a power company. The main performance indicators of the power company are presented in Table 3.
Table 3: Key economic indicators studied energy companies.
Indicator Value
Technical and economic indicators
Annual electricity production, thsd.megawatt-hour 20,000 The consumption of fuel (gas – 100%), mcm 15,000
Financial indicators
Sales for the year, mln.doll. 70
Net income for the year, mln.doll. 2
Assets, million dollars 53
Own capital, млн.долл. 25
Target credit rating: BBB
Confidence level 98.85
Based on the technical and economic indicators of the power company, we set baseline factors for the model. The power company chosen sells electricity at prices quoted at Moscow Energy Exchange. The daily average base load price index in the “Center” hub and the distribution of prices are shown in Figures 4 and 5. The fuel market risk factor (natural gas in this case) was simulated on the basis of spot prices for natural gas traded at NYMEX. In a real situation, the fuel price risk can be simulated taking into account the consumption of various types of fuel (gas, coal, fuel oil), as well as cumulative or country price statistics. The distribution of losses due to operating and technology risk was simulated using cumulative historical values. Correlations between risk factors were estimated by comparing the values in time intervals. The main risk-factor correlation indicators are presented in Table 5.
Based on the data from Table 4 and Table 5, and formula (4), the aggregated economic capital for the three types of risk amounts to 1,510,070 dollars. Thus, the required level of economic capital need for ensuring financial stability sufficient for achieving the BBB rating is 1,510,070 dollars. As follows Table 2, the current level of the company’s equity is enough to form economic capital to cover the market risk of power and capacity price changes, the market risk of fuel price changes and the operating and technology risk.
Table 4: Calculation of economic capital for energy company risk factors.
Indicator V 98.85 k σ T VaR EL ECAP EMR ECAP 50,000 2.27 2.91 90 3,133,358,63 1,562,269,12 1,571,089,51 CMR ECAP 12,000 2.27 0.57 90 147,300,2 58,630,1 88,670,06 TR ECAP - - - - 610,284,4 502,214,43 108,070
Table 5: Correlation matrix of major energy company risk factors.
EMR
ECAP ECAPCMR ECAPTR
EMR ECAP 1 CMR ECAP -0.54 1 TR ECAP 0.21 -0.18 1
6
Risk-based management of power company capital
Being a measure of unforeseen losses, economic capital determines the capital requirements of a power company. To set up reliable protection against risks and achieve a target level of financial stability, the capital of a power company needs to be managed with a view to increasing its sufficiency.
The capital of a power company can be formed at the expense of internal and external sources. The internal sources are represented mainly by profit; however, since many of the power companies are running at a loss due to the low production efficiency of the sector and to the volatility of the incoming fuel prices, high operation and maintenance costs impose constrains on long-term use of this source of capital. In particular, in 2013 acceptable ROE (within 14–15%) was achieved by few power companies, mainly those with majority nonresident shareholders. In most cases, rates of return fluctuate on average from 3% to 5% in the generation sector and from 1% to 3% in the distribution companies, and only the sales segment shows higher sectoral rates of return on equity. No doubt, such low profitability of the sector impairs its investment attractiveness, particularly for western companies with ROE at 15%–25%, which makes it difficult to attract capital from external sources. External sources of capital may include both sales of additionally issued shares and issuance of capital debt securities. Prospects for an IPO are in many respects determined by the investor sentiments and overall liquidity of the market, which suggests that this method may only be used whilst keeping an eye the business cycle stages and the securities markets. As for the placing of stocks and debt instruments on the OTC market, it boils down to finding an investor for these instruments. These securities would be of most interest for institutional investors, such as private equity funds, power company’s related firms, investment banks, or energy holdings managing assets in various areas of business operation [14, 15].
Figure 4: The main sources of capital in the energy sector.
Sources of capital
Energy Company Capital
Internal sources of capital
Institutional sources of capital Private equity
funds Associated companies Investment banks Energy holdings External sources of capital
7
Conclusion
In today’s complicated economic context, sectoral risk management is key to sustainable development and long-term growth of companies. Our study has shown that a power company is faced in its activities with various sectoral risks which can cause substantial losses and have an adverse effect on its production and financial performance.
The authors of this paper have proposed a methodological approach to assessing sectoral risks based on the concept of economic capital. This approach involves estimation of a specific indicator, i.e. economic capital characterizing the amount of capital that a power company needs to ensure a certain level of financial stability with a certain probability of staying solvent determined by the target credit rating. This model takes into account three important sectoral risks: the risk of price changes in the power and capacity markets, the risk of fuel price changes, and the operating and technology risk.
The practical importance of the proposed approach to sectoral risk assessment lies in the fact that it enables one to carry out a comprehensive review of a power company’s investment attractiveness. This approach allows sectoral risks to be identified, estimated and minimized in a timely manner. This, in turn, helps enhance the competitiveness of the power company and influences the financial decisions made by investors [16, 17].
In general, this approach may be further developed in the following directions. Firstly, given the plurality of sectoral risks, it is becoming important to expand the model to include other specified risks. Development of formalized loss estimation techniques for other risks will allow the accuracy and quality of the model to be enhanced. Secondly, an important area for improving this approach is adaptation of more advanced methods of economic capital estimation of individual sectoral risks and their aggregations, particularly in contexts where losses feature distributions other than normal. Thirdly, sectoral risk assessment and management implies the need to take into account a broader range of strategic areas for power facility development. In addition to financial stability, it is essential to estimate the production and investment factors of capital management at a power company.
References
[1] Alle, M., Le Comportement de l’Homme Rationnel devant le Risque. Critique des Postulats et Axiomes de l’Ecole Americaine. The Econometrica, 21, pp. 503-546, 1953.
[2] Markowitz, H., Portfolio Selection: Efficient Diversification of Investments, 1959.
[3] Miller, M., The Cost of Capital, Corporation Finance and the Theory of Investment, 1958.
[4] Sharpe, W., Portfolio Theory and Capital Markets, 1970.
[5] Kahneman, D., Prospect theory: An analysis of decision under risk. The Econometrica, 47, 1979.
[7] Market Risk Management in Russian electricity companies. Analytical study; KPMG, 2012.
https://www.kpmg.com/RU/ru/IssuesAndInsights/ArticlesPublications/Do cuments/Market-risk-management-at-Russian-power-companies-rus.pdf [8] Hertz, D., Risk Analysis in Capital Investments. Harvard Business Review,
pp. 95-106, 1964.
[9] Domnikov, A., Chebotareva, G. & Khodorovsky, M., Evaluation of investor attractiveness of power-generating companies: special reference to the development risks of the electric power industry. Proc. of the 1st Int. Conf. Energy Production and Management in the 21st Century. The Quest for Sustainable Energy, eds. C.A. Brebbia, E.R. Magaril & M.Y. Khodorovsky, WIT PRESS: Ashurst, pp. 199-210, 2014, ISSN 1743-3541.
[10] Domnikov, A., Chebotareva, G. & Khodorovsky, M., Evaluation of investor attractiveness of power-generating companies, given the specificity of the development risks of electric power industry. Vestnik UrFU, 3, pp. 15-25, 2013, ISSN 2071-5706.
[11] Domnikov, A., Khomenko, P., Khodorovskiy, M., Vlasov, V. Economic capital assessment method improvement based modification the exposure at default calculating method. Audit and financial analysis, 4, 2013. pp. 113-117.
[12] Morgan, J. P., Risk Metrics TM-Technical Document, Morgan Guaranty Trust Company, 4.
[13] Khodorovsky, M., Domnikov, A., Khomenko, P. Optimization of financing investments in a power-generation company. Energy Production and Management in the 21st Century. WIT Transactions on Ecology and the Environment, 2014.
[14] Zucker, A. & Hinchliffe, T., Optimum sizing of PV-attached electricity storage according to power market signals – A case study for Germany and Italy. Applied Energy, 127, pp. 141-155, 2014.
[15] Mary, C., The costs of generating electricity and the competitiveness of nuclear power. Progress in Nuclear Energy, 73, pp. 153-161, 2014. [16] Shahnazari, M., McHugh, A., Maybee, B. & Whale, J., Evaluation of power
investment decisions under uncertain carbon policy: A case study for converting coal fired steam turbine to combined cycle gas turbine plants in Australia. Applied Energy, 118, pp. 271-279, 2014.
[17] Sakaguchi, J., Miyauchi, H. & Misawa, T., Risk assessment of power plant investment by three level ordered probit model considering project suspension. Proc. of IREP Symposium: Bulk power System Dynamics and Control – IX Optimization, Security and Control of the Emerging Power Grid, 2013.