American University in Cairo American University in Cairo
AUC Knowledge Fountain
AUC Knowledge Fountain
Theses and Dissertations2-1-2016
Brain-computer interface for physically impaired people
Brain-computer interface for physically impaired people
Nourhan Shamel El SawiFollow this and additional works at: https://fount.aucegypt.edu/etds
Recommended Citation Recommended Citation
APA Citation
El Sawi, N. (2016).Brain-computer interface for physically impaired people [Master’s thesis, the American University in Cairo]. AUC Knowledge Fountain.
https://fount.aucegypt.edu/etds/318
MLA Citation
El Sawi, Nourhan Shamel. Brain-computer interface for physically impaired people. 2016. American University in Cairo, Master's thesis. AUC Knowledge Fountain.
https://fount.aucegypt.edu/etds/318
This Thesis is brought to you for free and open access by AUC Knowledge Fountain. It has been accepted for inclusion in Theses and Dissertations by an authorized administrator of AUC Knowledge Fountain. For more information, please contact [email protected].
The American University in Cairo
School of Sciences and Engineering
Brain-Computer Interface for Physically Impaired People
By
Nourhan Shamel El Sawi
A thesis submitted in partial fulfillment of the requirements for the degree of Master of Science in Robotics, Control and Smart Systems
Under supervision of: Dr. Maki Habib
Professor, Department of Mechanical Engineering
DECLARATION
I declare that this thesis is my work and that all used references have been cited and properly indicated.
DEDICATION
I dedicate my thesis dissertation work to my family. A special feeling of gratitude to my loving parents Shamel El Sawi and Hanan Baligh for their continuous support, mom and dad you have always pushed me forward and believed in me. Also I would like to thank my supportive husband Asser Fahmy for providing me with all the financial support I needed to complete my thesis work.
ii
ACKNOWLEDGMENTS
I would like to express my sincere gratitude to my advisor Dr. Maki Habib the director of Master program in Robotics, Control and Smart Systems (RCSS) in Mechanical Engineering Department, School of Sciences and Engineering at The American University in Cairo. Thanks for his continuous support of my Master’s study and research, for his patience, motivation, enthusiasm, and immense knowledge. His guidance helped me in all the time of research and writing of this thesis.
I also would like to thank all the students who voluntarily participated in my thesis tests for their time and enthusiasm to try new technology and for all their supportive words and impressions after trying the proposed system they really pushed me forward.
iii
ABSTRACT
Brain-Computer interface (BCI) is a promising field of research that can change life as we know it, staring from the healthcare, home devices and armed force to video gaming. BCI provides a new communication channel between human and computers using brain signals to perform certain control actions. BCI systems can help physically impaired patients to increase their degree of independency, and give hope to ‘Locked-In Syndrome’ (LIS) Patients and Amyotrophic Lateral Sclerosis ALS to communicate again. The aim of this thesis is to develop a Generic BCI system that uses Blink and Wink as control signals. This system avoids problems like long training periods, the risks of flashing lights and using many electrodes and sophistication of hybrid systems. Blinks and Winks are signals generated by the eye lid muscles and it is considered as an artifact in the brain signals. In this study we propose the use of this artifact signals to recognize human intention. The reason behind choosing blink and wink signals is because its features can be distinguishable from the normal brain activities which allow the system to easily detect it. The Blink and Wink based BCI system uses oddball paradigm
technique to facilitate the use for more interactive commands. The system is tested with P300 speller and smart home control panel. For P300 Speller test the system achieved 87.5% accuracy and for the smart home control panel test the system achieved 92.5% accuracy. The test shows that the developed system is generic and efficient as no offline training for calibration was done by any of the subjects while the system achieved better accuracy compared to other BCI systems.
iv
TABLE OF CONTENTS
DECLARATION ... iv DEDICATION ... v ACKNOWLEDGMENTS ... ii ABSTRACT ... iii TABLE OF CONTENTS ... ivLIST OF FIGURES ... vii
LIST OF TABLES ... ix
NOMENCLATURE ... x
Chapter 1 Introduction to Brain-Computer Interface ... 1
1.1 Introduction ... 1
1.2 Background ... 2
1.2.1 What is Brain-Computer Interface (BCI)? ... 2
1.2.2 History of BCI ... 2
1.3 Motivation ... 2
1.4 The Human Brain ... 3
1.4.1 Neuron structure ... 3
1.4.2 The structure of human brain ... 5
1.5 Techniques for Measuring Brain Activity ... 6
1.5.1 Functional Magnetic Resonance Imaging (fMRI) ... 7
1.5.2 Magnetoencephalography (MEG) ... 7
1.5.3 Electroencephalography (EEG) ... 7
1.6 Electroencephalography (EEG) ... 7
1.6.1 History of EEG ... 7
1.6.2 Introduction to EEG ... 8
1.6.3 The International 10-20 System ... 8
1.6.4 EEG Rhythms of the Brain ... 9
Chapter 2 Literature Review ... 14
2.1 BCI Systems... 14
2.2 Architecture of BCI system ... 14
2.2.1 EEG Signal Acquisition ... 14
2.2.2 Signal Processing ... 14
2.2.3 Classification ... 15
v
2.3 Challenges with BCI Systems ... 15
2.3.1 Information Transfer Rate (ITR) ... 15
2.3.2 Offline Training (Calibrating) Sessions ... 17
2.3.3 High Error Rate ... 17
2.3.4 Autonomy ... 17
2.3.5 Noise ... 17
2.3.6 Cognitive Load ... 18
2.4 Overview on BCl Exploit Control Signals and Techniques ... 18
2.4.1 Steady-State Visual Evoked Potentials (SSVEP) ... 18
2.4.2 Motor Imagery ... 21 2.4.3 P300 ... 22 2.4.4 Overview conclusion ... 24 2.5 Objectives ... 25 2.6 Related Work ... 25 2.7 Thesis outline ... 28
Chapter 3 Eye Blinking and Wink Signal ... 29
3.1 Classification of Eye blinks ... 29
3.1.1 Reflexive eye blink: ... 29
3.1.2 Spontaneous (involuntary) eye blinks: ... 29
3.1.3 The Intentional (voluntary) eye blinks: ... 29
3.1.4 Eye wink: ... 30
3.2 Studying features of Eye blink signal ... 30
3.3 Detection of eye blink using EEG ... 31
3.3.1 Left wink ... 32
3.3.2 Right Wink: ... 33
3.3.3 Double Blink:... 35
3.4 Eye blink study conclusion ... 35
Chapter 4 Conceptual Design ... 37
4.1 Problem statement ... 37
4.1.1 Challenges and limitations in designing generic systems ... 37
4.1.2 Challenges and limitation in the exploit BCI systems ... 38
4.2 Proposed Solutions ... 38
4.2.1 The generic approach ... 38
4.2.2 Steps taken to avoid facing the problems stated ... 39
4.3 Operational scenario ... 40
vi
4.4.1 System function ... 40
4.4.2 Functional modules ... 41
4.5 System design layout ... 43
4.5.1 Physical blocks ... 43
Chapter 5 System Architecture and Implementation ... 45
5.1 Hardware Components for EEG Acquisition ... 45
5.1.1 EEG acquisition devices ... 45
5.1.2 Emotiv Epoc EEG headset ... 46
5.2 Software Used for Designing the Proposed System ... 48
5.2.1 OpenViBE software ... 48
5.3 OpenViBE System Design ... 49
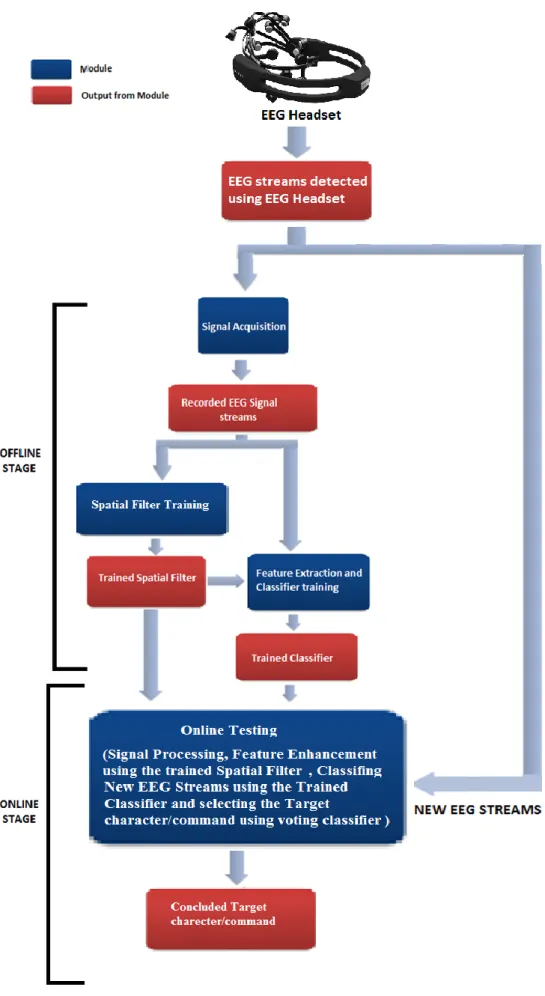
5.4 Offline training modules ... 50
5.4.1 Signal acquisition module ... 52
5.4.2 Spatial filter training module ... 59
5.5 Online Testing Stage ... 82
5.5.1 Online testing module ... 82
Chapter 6 Testing Blink and Wink Signals with P300 Speller ... 92
6.1 P300 speller GUI ... 92
6.2 System Setup for P300 Speller Stimulator for P300 speller ... 94
6.3 Online Test Experimental Procedures and Setting for P300 Speller ... 95
6.4 Results and discussion... 97
6.4.1 System accuracy and comparison ... 98
6.4.2 Discussion ... 101
Chapter 7 Testing Blink and Wink Signal with Control Panel ... 102
7.1 Control Panel ... 102
7.2 System Setup for P300 Speller Stimulator for the Smart Home Control Panel ... 103
7.3 Online Testing Experimental Procedure and Setting for Smart Home Control Panel ... 104
7.4 Results and Discussion ... 105
Chapter 8 Conclusions and Future Work ... 107
8.1 Conclusion ... 107
8.2 Future Work ... 108
vii
LIST OF FIGURES
Figure 1.1 Neuron structure [6] ... 4
Figure 1.2: Brain structure [10] ... 5
Figure 1.3: Cerebral cortex lobes [12] ... 5
Figure 1.4: 10-20 international system electrodes position [59] ... 9
Figure 1.5: Delta wave [6] ... 10
Figure 1.6: Theta wave [6] ... 10
Figure 1.7: Alpha wave vs. Beta wave [6]... 12
Figure 1.8: Normal brain rhythms ... 12
Figure 2.1: ITR in bits/trial and bits/min (for 12 selection /min) when the number of commands (selections) is 2,4,8,16,32 [60] ... 16
Figure 2.2: SSVEP Frequency spectrum of fundamental frequency at 7Hz and its harmonics [24] ... 19
Figure 2.3: Separation between each fundamental frequency of SSVEP system ... 19
Figure 2.4: ERD signal of left hand and right hand motor imagery starting at 3s [9] ... 21
Figure 2.5: P300 signal responses peak at P1, P2 and P3 [58] ... 23
Figure 2.6: Electrode placement in S. Rihana, P. Damien and T. Moujaess research [8] ... 26
Figure 3.1: Intentional Eye blink signal [23] ... 30
Figure 3.2: Illustrates how low and high kurtosis appear ... 31
Figure 3.3: Left wink reaches its highest amplitudes at F7 ... 32
Figure 3.4: Left Wink signal has inverse amplitude at AF3 and F7 ... 33
Figure 3.5: Right wink reaches its highest amplitudes at F8 ... 34
Figure 3.6: Right wink signal has inverse amplitude at AF4 and F8 ... 34
Figure 3.7: Double blink detected at ‘AF3, T7, P7, O1, O2, P8, T8 and AF4’ ... 35
Figure 4.1: The developed modular structure ... 44
Figure 5.1: Emotiv Epoc headset [61] ... 46
Figure 5.2: Emotiv Epoc headset electrode placement ... 46
Figure 5.3: Emotiv Epoc kit [61] ... 48
Figure 5.4: Offline training modules ... 51
Figure 5.5: Online testing module ... 52
Figure 5.6: Emotiv Epoc headset communicates wireless with laptop ... 53
Figure 5.7: Flow of EEG streams from Emotiv Epoc to Acquisition client block ... 53
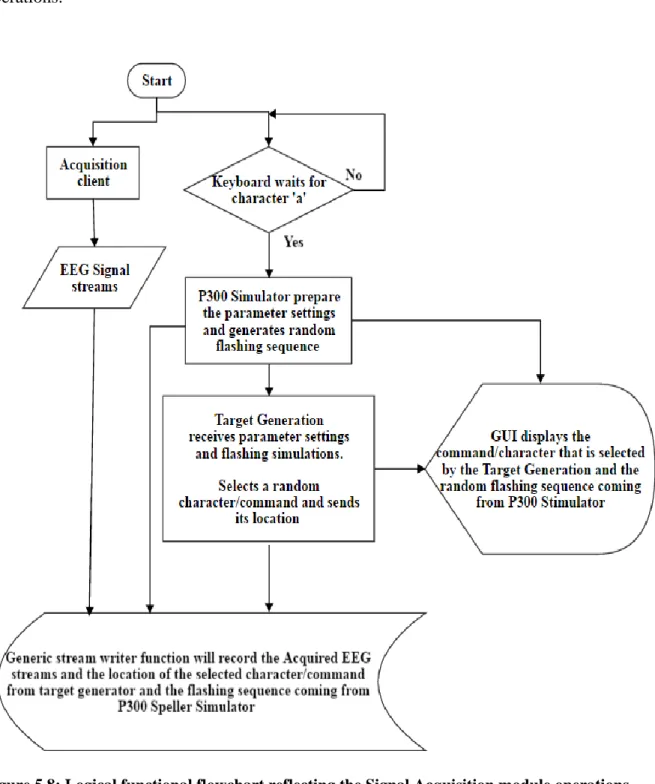
Figure 5.8: Logical functional flowchart reflecting the Signal Acquisition module operations ... 54
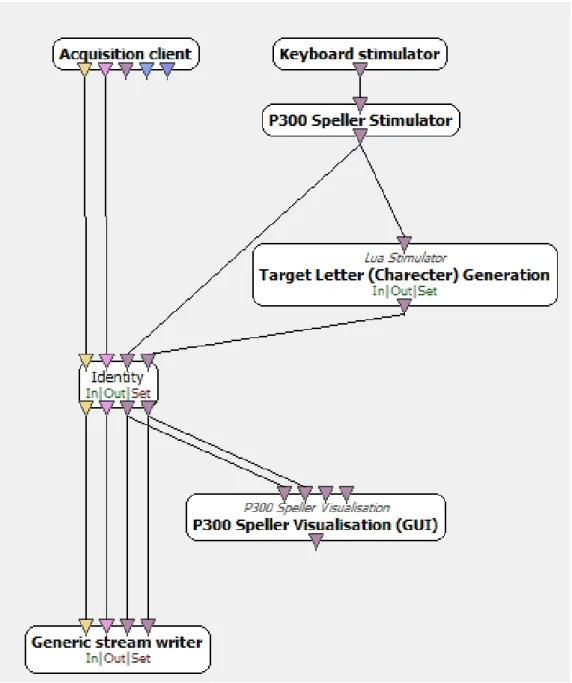
Figure 5.9: Overall structure of the software functions within the ‘Signal Acquisition’ module ... 55
Figure 5.10: Stimulations generated by P300 Speller Stimulator ... 56
Figure 5.11: (a) P300 speller showing flashing of a row and a column (b) Control panel ... 58
viii
Figure 5.13: The overall OpenViBE functional structure of the software functions within the spatial filter
training module ... 61
Figure 5.14: EEG stream after passing through Band Pass Filter ... 62
Figure 5.15: Butterworth filter ... 63
Figure 5.16: Time window every 0.25s with duration 0.25s ... 65
Figure 5.17: Time window every 0.15s with duration 0.5s ... 65
Figure 5.18: Stimulation based epoching function separates target and non target epochs ... 66
Figure 5.19: The effect of the xDAWN spatial filter to enhance the features of the control signal ... 68
Figure 5.20: Spatial filter training module data flow ... 70
Figure 5.21: The logical functional flowchart reflecting the feature extraction and classifier training module operations ... 72
Figure 5.22: The overall OpenViBE functional structure of the software functions within the feature extraction and classifier training module. ... 73
Figure 5.23: Average reaction time to visual stimuli and intentional blink duration ... 75
Figure 5.24: Epoching 600ms data after every stimuli generated and sampling it into 76 feature value the amplitude of the signal ... 76
Figure 5.25: Feature aggregator concatenate features into one feature vector ... 77
Figure 5.26: Feature extraction and Classifier training module data flow part1 ... 80
Figure 5.27: Feature extraction and Classifier training module data flow part2 ... 81
Figure 5.28: The logical functional flowchart reflecting the online testing module operations ... 84
Figure 5.29: The overall OpenViBE functional structure of the software functions within the online testing module ... 88
Figure 5.30 : Online testing module data flow ... 89
Figure 5.31 : The overall OpenViBE functional structure of the software functions within the online testing module ... 90
Figure 5.32: The overall OpenViBE functional structure of the software functions within the online testing module ... 91
Figure 6.1: P300 Speller GUI ... 92
Figure 6.2: Target selection by the speller ... 93
Figure 6.3: spelled character by the user ... 94
Figure 7.1: Control panel for smart home application ... 102
ix
LIST OF TABLES
Table 1-1: EEG rhythms of the brain ... 13
Table 6-1: P300 Speller Stimulator Parameters Settings used in the offline training of P300 speller ... 95
Table 6-2: P300 Speller Stimulator Parameters Settings used in the online testing of P300 speller ... 96
Table 6-3: Subjects performance in P300 speller test ... 97
Table 6-4: Comparing average Accuracy results with number of (subjects, channels, trained characters, tested characters and repetition ... 99
Table 7-1: P300 Speller stimulator parameters settings used for the offline training of the smart home control panel ... 103
Table 7-2: Speller stimulator parameters settings used in the online testing of the smart home control panel . 104 Table 7-3: Subjects Accuracy achieved in smart home control panel test ... 105
x
NOMENCLATURE
Measures
C Capacitor, F P Accuracy, % R Resistor, ΩT Trial duration, min t Time, sec
V volt
Subscripts
N Total number of selections (commands or characters) N1 First negative peak in P300 signal
N2 Second negative peak in P300 signal P1 First positive peak in P300 signal P2 Second positive peak in P300 signal P300 Third highest positive peak in P300 signal
μ First order central moment or expectance σ Standard deviation
n Filter order
xi Cn Column number
En potential value Rn Row number
wc Angular cut-off frequency, rad
Acronyms
ALS Amyotrophic Lateral Sclerosis BCI Brain-Computer Interface CAR Common Average Reference
CD Compact Disk
CRP Cornea-Retinal Potential CSP Common Spatial Pattern DWT Discrete Wavelet Transform EEG Electroencephalography
ERD Event Related Desynchronisation EOG Electrooculography
ERP Event Related Potential ERS Event-related synchronization
fMRI functional Magnetic Resonance Imaging GUI Graphical User Interface
HMI Human Machine Interface HCI Human Computer interface ICA Independent Component Analysis ITR Information Transfer Rate
LEDs Light Emitting Diodes LDA Linear Discriminate Analysis LIS Locked-In Syndrome
MEG Magneto-Encephalography MLP Multi Layer Perceptron MMI Man Machine Interface PC Personal Computer
xii
SCP Single-Character/Command Presentation SNR Signal to Noise Ratio
SSVEP Steady-State Evoked Potentials SVM Support Vector Machine USB Universal Serial Bus
1
Chapter 1
Introduction to Brain-Computer Interface
1.1 Introduction
According to the first “World Report on Disability” by the World Health Organization and World Bank “more than one billion people in the world live with some form of disability, of whom nearly 200 million experience considerable difficulties in functioning” [1]. This report highlights the idea that More than one billion people in the world live with some form of disability. This problem is getting even worse and the number of patients around the world increases due to the increase in chronic health conditions such as physical impairment, cardiovascular diseases, cancer, mental health disorders and diabetes as well as the high risk of disability in ageing population [1, 2].
People who are physically impaired suffer from lack of independency and inability to control or sometimes even to communicate with the environment around them. An example of such condition is the rapidly progressive Amyotrophic Lateral Sclerosis (ALS) that affects nerve cells in the brain and the spinal cord. Therefore, patients need to have methods and
techniques for communication and control that do not depend on motor ability [3- 5].
A new trend towards ‘Human Machine Interface’ (HMI) has been introduced as a solution for many people who lost their limbs or cannot control some of their muscles. HMI is the case when interaction between humans and machines occurs to effectively operate and control a machine, for example prosthetic limbs. Other terms used to identify this interaction is Human Computer interface (HCI) or Man Machine interface (MMI).
For patients who are completely paralyzed HMI may not be the answer. Another revolution in HMI has evolved by having direct interface between human brain and computers and so a new term was introduced for special type of HMI is ‘Brain-Computer Interface’ BCI [2, 5, 6].
2
1.2 Background
1.2.1 What is Brain-Computer Interface (BCI)?
BCI is a new approach to control machine based on brain signals which is detected using electroencephalography (EEG). This technology is risk free technology as it depends on using noninvasive dry electrodes, which only detects the brain signals from the surface of the scalp [2, 7, 8]. BCI is the most intuitive interface between the user and a computer,
performing as a direct extension of the human nervous system. BCI analyzes human brain signals and translates them into commands that can control a computer to perform any suitable task.
1.2.2 History of BCI
BCI was firstly introduced by the United States Department of Defense in the mid 1960's [65]; this program intended to help pilots interact with their aircraft to reduce the mental workload of the pilot by providing a direct channel of communication between the pilot and the plane's computer. The technology at that time was not advanced enough to be used for such task so the program didn’t achieve its target and was cancelled. However, other research groups started research programs depending on this project [10]. Since the 90’s, BCI research has evolved rapidly and started to attract researchers from different disciplines, with more laboratories worldwide getting involved in this field. International competitions took place to design the most efficient BCI system and introduce several prototypes and applications like communication, virtual reality, gamming and medical field [9].
1.3 Motivation
BCI is a very promising field of research as it can change life as we know it, starting from the healthcare, home devices and armed force to video gaming. The idea of controlling using brain signal has been fantasized long ago starting from science fiction of aliens driving their spaceships by thoughts to witches who have superpowers and can move things around and even open and close doors and windows just by thoughts.
EEG device are developed to be wireless providing a level of mobility, user friendly interfaces, cheap and provides acceptable sensitivity. Beside this, electrode sensor
3
technologies that provide a better connectivity and user friendly are introduced into market. Also many software developers are working on providing a user friendly programs that can help researchers in BCI field, most of these software are open source software for the sake to support the progress in such important research field. Among the popular software are OpenVIBE and BCI2000.
BCI is offering many contributions to the society; one of the greatest contributions is helping physically impaired patients to increase their degree of independency, and give hope to ‘Locked-In Syndrome’ (LIS) Patients and Amyotrophic Lateral Sclerosis (ALS) to communicate again.
1.4 The Human Brain
Before understanding BCI structure it is necessary to understand how human brain works. The brain is the most important organ in the nervous system which consists of billions of neurons. Human brain is a complex organ that allows us to think, move around, feel, see, hear, taste and smell. It controls our entire body, receives information, analyzes it, and stores information as memories.
Human brain contains 100 billion of neurons approximately [6]. Neurons communicate with one another through axons which carry trains of signal pulses called action potentials.
Therefore, the nervous system has electrical nature, which can be detected from the surface of the scalp, reflecting functional activities emerging from the underlying brain [6].
1.4.1 Neuron structure
The structure of a neuron includes four main parts as shown in figure 1.1. These are: cell body, axon, dendrites and synapses.
A Cell body (soma)
The cell body of a neuron represents the main part of neuron. It has the nucleus which contains DNA, the endoplasmic reticulum and ribosome for building proteins and mitochondria for making energy [11].
4
B Axon
The axon is more like a wire or cable that transmits electrochemical message or so called nerve impulse or action potential to another neuron cell. Sensory and motor neurons that are found in the peripheral nerves have a thin layer of myelin that covers the Axon and acts like an insulated electrical wire and helps to speed transmission of a nerve impulse down a long axon [6][11].
C Dendrites
The dendrites are branch like endings that act as input connections where all the information to the neuron arrives, an important property of the dendrites is their ability to break connections with some nerve cells and form new connections with others, this property is essential for the learning process [10].
D Synapses
Neurons are separated by very small physical gaps called synapses. These gaps represent junctions that allow the transmission of impulses from one to another [10] [11].
5
1.4.2 The structure of human brain
Human brain has three main parts: the brain stem, the cerebellum, and the cerebrum as shown in figure1.2. Brain stem is responsible for basic vital life functions such as breathing,
heartbeat, and blood pressure. The Cerebellum structure is associated with posture, regulation and coordination of movements and balance. The Cerebrum is the largest part of the human brain, it consists of two hemispheres (left and right) and has a highly folded cortex, and it is responsible for higher brain functions such as thought and action. The Cerebral Cortex is the outermost sheet of neural tissue that covers the Cerebrum; it is divided into sections, called "lobes“[12] [13] [14].
Figure 1.2: Brain structure [10]
The cerebral cortex consists of four lobes which are the Temporal lobe, Parietal lobe, Frontal lobe and Occipital lobe as shown in figure 1.3.
6
A The cerebral cortex lobes and their associated functions
I Temporal lobe
This lobe is associated with auditory, hearing, visual memories, components of emotions like fear and components of language and parts of speech, components of behavior, emotions and sense of identity [15].
II Parietal lobe
This lobe is associated with sense of touch (tactile sensation), response to internal stimuli, sensory combination and comprehension, components of language and reading functions, and part of visual functions [15].
III Frontal lobe
This lobe is associated with reasoning, planning, parts of speech, behavior, abstract thought processes, problem solving, attention, creative thought, components of emotion, reflection, judgment, inhibition, coordination of movements, some eye movements, sense of smell, muscle movements, physical reaction.[15]
IV Occipital lobe
This lobe is associated with vision and reading, and it is where the eye reactions towards stimulations can be detected.
In this research the main focus is on the Frontal and Occipital lobes of the brain as will be discussed later.
1.5 Techniques for Measuring Brain Activity
The brain activity consists of several types of signals such as magnetic and electrical signals. This activity can be detected by invasive and noninvasive techniques. The invasive methods require surgical operation for implanting electrodes in the brain, which is too risky and raises many surgical complications and side effects therefore, it is not feasible for practical
applications.
The noninvasive methods are risk free methods that don’t need any type of implantation, signals are detected using electrodes or bands on the surface of the scalp therefore, does not
7
involve any physical damage. These methods include functional Magnetic Resonance Imaging (fMRI), Magneto- encephalography (MEG) and Electroencephalography (EEG) which nowadays are mainly used for medical applications.
1.5.1 Functional Magnetic Resonance Imaging (fMRI)
The functional MRI (fMRI) is a functional neuroimaging technique used for visualizing neural activity using MRI that measures brain activity by detecting changes in blood flow. fMRI has been used extensively for investigating various brain functions, including vision, motor, language, and cognition [16].
1.5.2 Magnetoencephalography (MEG)
Magnetoencephalography technique aims to record magnetic fields produced by the brain electrical currents and mapping them to brain activity. MEG is used in basic research of perceptual and cognitive brain processes, determining the function of various parts of the brain and neuro-feedback [17].
1.5.3 Electroencephalography (EEG)
Electroencephalography technique measures the electrical activity generated by the sum of the synaptic potentials generated by thousands of neurons in the brain. EEG is detected using electrodes placed on the scalp. [10]
1.6 Electroencephalography (EEG)
1.6.1 History of EEG
In 1875 the English physician Richard Caton discovered the brain electrical potential. Since there were no electronic amplifiers available at that time, the probes were connected to simple galvanometers with optical magnification [10]. Fifty years later, the first recording of human brain activity was made by the German psychiatrist Hans Berger [10] [18]. In 1929 Berger announced that it is possible to record the electric activity of the brain without opening the skull and represent it on graphic paper and named it Electroencephalogram
8
(EEG), later Berger discovered that the EEG of someone varies according to his mental state and that was a revolution in the medical field and founded the field of clinical
neurophysiology science [10] [18].
1.6.2 Introduction to EEG
The Electroencephalography (EEG) is a non-invasive mapping of the surface potential variation produced due to the ionic current that flows within the neurons of the brain. EEG can be detected by fixing an array of electrodes to the scalp, and measuring the voltage between pairs of these electrodes. Brain rhythmic activity has very weak amplitude measured in micro-volts therefore, signals amplification is needed. Since the amplitude is very weak, it is essential to apply noise removal as noise affects the EEG signal dramatically and changes its features. Generally these signals are classified according to their frequencies, amplitude, and waveforms shape, as well as their location sites on the scalp where they are recorded [9].
1.6.3 The International 10-20 System
The electrical signals recorded by EEG can vary greatly depending on the position of the electrode on the scalp. Therefore, The International Federation of Societies for
Electroencephalography and Clinical Neurophysiology recommended a specific system of electrode placement called the international 10-20 system or the conventional electrode setting to make it possible to compare different research recordings and to be able to repeat previous experiments.The design of the 10-20 system was introduced by Herbert Jasper and it is called 10-20 electrode placement system because the distance between adjacent
electrodes is 10% or 20% of the total front–back or right–left distance of the skull as shown in figure 1.4
According to this system each site of this system has a letter to identify the lobe and a number or another letter to identify the hemisphere location. The letters (F) for Frontal, (T) Temporal, (P) Parietal and (O) Occipital lobes and (C) central, there is no "central lobe" in the brain but this terminology is used for location identification purposes, (Z) refers to an electrode placed on the midline between the Nose and Inion point at back of skull [10].
9
Figure 1.4: 10-20 international system electrodes position [59]
1.6.4 EEG Rhythms of the Brain
A Delta waves (0.5–4Hz)
Delta waves have variable amplitude as shown in figure 1.5. Its amplitude ranges from 20-400 µV [2]. They have been associated with deep sleep but they can appear in the waking
10
state too. Signals caused by neck muscles and jaw are sometimes confused with the delta signal as they are originated near the surface of the skin and produce large signals while the delta signal comes from deep inside the brain and is attenuated when passing through the skull but by signal processing it can be easily figured out [19][2].
Figure 1.5: Delta wave [6]
B Theta waves (4–7.5 Hz)
Theta waves are shown in figure 1.6; they have been associated with the feeling of emotional stress, frustration and disappointment. They are associated with the drowsiness feeling, access to unconscious material, creative inspiration and deep meditation. Theta waves amplitude is usually greater than 20 µV and dominant peak occurs around 7 Hz. It is often accompanied by other frequencies and seems to be related to the level of arousal and found mostly in the frontal and temporal lobes [6] [19] [2].
11
C Alpha waves (8–13 Hz)
Alpha waves appear in the posterior half of the head and are usually found over the occipital region of the brain. Alpha waves have been thought to indicate relaxed awareness without any attention or concentration but they appear strongly in periods when the eyes are closed over the occipital lobe. They are the most prominent rhythm in the brain activity, they also can be found sometimes in the range of beta wave but having the characteristics of the alpha wave as shown in figure 1.7. An alpha wave has high amplitude over the occipital areas 5-100 µV [2] [6].
D MU (μ) waves (8–13 Hz)
Mu wave have the same frequency range as alpha waves but these waves are related to the motor actions therefore, they are found over the sensorimotor cortex unlike the alpha waves which are found in the occipital lobe region and are related to closed eye or relaxed
awareness. Mu patterns arise from synchronous and coherent electrical activity of large groups of neurons in the motor cortex. When the human sensorimotor cortex is at rest it generates an electric wave of 8–13 Hz EEG rhythm referred to as the Rolandic mu rhythm. This activity appears to be associated with the motor cortex, decreases with movement or an intent to move, or visualizing a motor action, or when others are observed performing actions [19].
E Beta waves (13–30 Hz)
Beta waves are found over the frontal and central regions of the brain. They are the waking rhythm and usually have a low voltage between 5-30 µV. They have been associated with active thinking, active attention, focus on the outside world, or solving concrete problems, and are found in normal adults. In panic state a high level beta wave may occur. [19]
12
Figure 1.7: Alpha wave vs. Beta wave [6]
F Gamma waves (30 up to 45 Hz)
Gamma waves are sometimes called the fast beta waves. The amplitudes of these rhythms are very low and their occurrence is rare but; it is used for confirmation of certain brain diseases. The gamma wave band has also been proved to be a good indication of event-related
synchronization (ERS) of the brain and can be used to demonstrate the right and left index finger movement, and tongue movement [19].
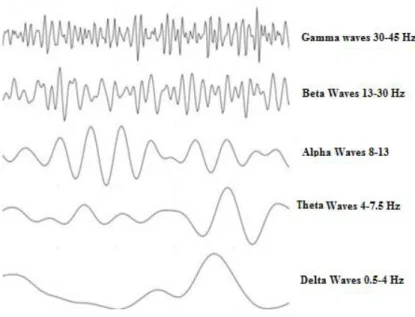
Figure 1.8 shows the normal brain rhythms with their usual amplitude levels
13
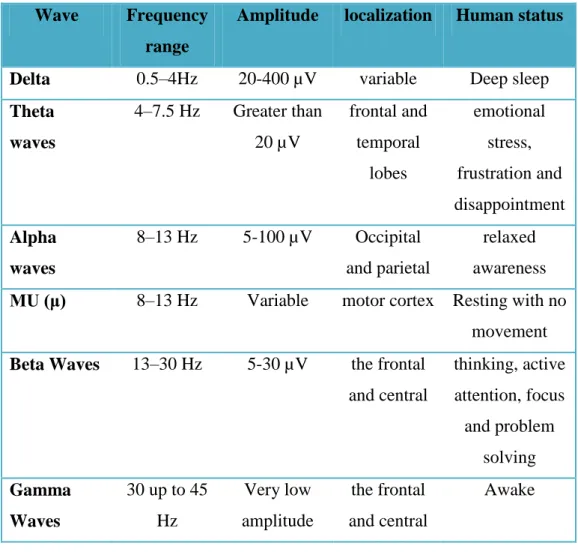
Table 1-1 shows a brief comparison between brain rhythms with their frequencies, amplitudes, location of detection and human status.
Table 1-1: EEG rhythms of the brain
Wave Frequency
range
Amplitude localization Human status
Delta 0.5–4Hz 20-400 µV variable Deep sleep
Theta waves 4–7.5 Hz Greater than 20 µV frontal and temporal lobes emotional stress, frustration and disappointment Alpha waves 8–13 Hz 5-100 µV Occipital and parietal relaxed awareness
MU (μ) 8–13 Hz Variable motor cortex Resting with no
movement
Beta Waves 13–30 Hz 5-30 µV the frontal
and central thinking, active attention, focus and problem solving Gamma Waves 30 up to 45 Hz Very low amplitude the frontal and central Awake
14
Chapter 2
Literature Review
2.1 BCI Systems
Designing a BCI system can be challenging as it represents interdisciplinary skills. Such skills may include signal processing, neuroscience, computer science, robotics, mechanical, engineering, control, etc. depending on the end user application. In BCI field there are different approaches to solve the same problem. However, the most efficient, accurate and real time solution would be the best approach. In general, BCI systems have four main modules: Signal Acquisition, Signal Processing, Classification and Interface modules [10] [9].
2.2 Architecture of BCI system
2.2.1 EEG Signal Acquisition
There are different ways in detecting and recording brain signals. The EEG signal recording module measures, amplifies and filters the EEG signal and then converts it from analog to digital to be ready and input to the signal processing module. EEG signals recording module utilizes non invasive electrodes mounting on the user scalpe in the 10-20 standard electrode placements, and the quality and sophistication of EEG devices and electrodes affect the quality of EEG signal obtained.
2.2.2 Signal Processing
In this module the digital signal is processed in a way to remove the noise from the signal and enhance the signal features. This processing may include further noise removal, filtering, amplification, calculating the signal power and processing in frequency domain. Enhancing the signal features is important for the classification stage as extracting certain features such as amplitude, frequency, skewness and kurtosis make it easier for the classifier to
15
2.2.3 Classification
In this module the features that were extracted by the processing module are used by a classifier to sort epochs taken from this signal into categories relevant to the commands (representing mental orders such as move forward, switch On/Off lights, etc.) associated with target application. The classifier usually is adaptive self learning as in artificial neural
networks. First, the classifier is trained by previously known signal obtained from a training session where the target data and non target data specified by the system for training and classified offline. After completing the training, the classifier can categorize any unknown input signal during running time.
2.2.4 Interface Commands
After the mental order is identified by the classifier, a command has to be formed with each mental order or state to control certain action within an application like driving forward or backward a wheelchair or spell a word, etc.
2.3 Challenges with BCI Systems
2.3.1 Information Transfer Rate (ITR)
ITR or sometimes called bit rate is a widely used performance measure in BCI systems. It indicates how many bits of information are transferred effectively through the interface. In other words how fast the system is to perform one correct command or character taking into account the total number of commands or characters available in the system and time (minutes) taken to transfer a character or command in one session.
If the probability that the target (desired) selection will actually be selected is always the same and if each of the other non target selections has the same probability of selection; Therefore, ITR can be presented in both ways as bits/trial (selection) or as bits/min As shown in Equation (2.1) or Equation (2.2).
Equation 2.1 shows ITR as bits/trial [60]
16 Equation (2.2) shows ITR as bits/min [20] [21].
(2.2)
Where N is the total number of selections (commands or characters) available in a system that can be selected, p denotes the accuracy of selection (classification) through testing session and T is the trial duration to select one target command (character or action command) in minutes.
ITR can be used to compare a system performance with different number of selections (N) or to compare the performance of similar systems taking into consideration their different number of selections (N) and the accuracy achieved by each system.
For example, as shown in figure 2.1 the ITR of a BCI system that has two possible commands (choices) and 90% accuracy is equal to a BCI system that has four possible
commands and 65% accuracy. Also the ITR of a BCI system that has two possible commands and 90% accuracy is twice that of a BCI system that also has two possible commands but 80% accuracy [60].
Figure 2.1: ITR in bits/trial and bits/min (for 12 selection /min) when the number of commands (selections) is 2,4,8,16,32 [60]
17
2.3.2 Offline Training (Calibrating) Sessions
As in all BCI systems because every subject has his unique EEG signals, the subject should record an offline session before performing an online test. The recorded EEG of the subject is used to train the system modules such as classifier to calibrate the system on the subject brain waves. The offline training session is time consuming activity and sometimes the user needs to do the offline training process every time s/he wears the EEG device and this is because the location of electrodes or connectivity in some acquisition devices can slightly change and this leads to changes in the EEG readings and so a new training will be needed for
adjustment. This means that the BCI systems are not generic and needs to be calibrated on each user every time. Solving this problem will be part of our thesis work.
2.3.3 High Error Rate
Brain signals are highly variable, and such variability is higher with disabled users due to fatigue, medications, and medical conditions like seizures or spasms that produce high probability of errors. Self-reporting errors is also extremely difficult, particularly if the subject has little or no communication channel outside the BCI system itself. Therefore, the challenge here is to find methods for quickly resolving, reducing or preventing errors [22].
2.3.4 Autonomy
Unfortunately, BCI systems require extensive assistance from caretakers who need to setup electrodes or signal-receiving devices. BCI user may be able to perform a selection to turn the BCI system OFF, but turning it back ON again is an issue. To solve this issue, researchers are exploring the possibility of having a hybrid system, that constitutes combinations of different BCI techniques or detecting the control state of the user to resolve this issue [21] [22].
2.3.5 Noise
EEG signal has poor signal to-noise-ratio. Therefore, any type of noise can affect the signal such as the surrounding noise, blinks and movement of jaws, hand, feet or even neck [23]. These types of noise have high amplitudes than the brain rhythms therefore, can dramatically affect systems depending on weak signals like event related potential signals (P300) [23] [9]. Many researchers have proposed complex and sophisticated techniques to completely block any noise artifacts and so these systems are more complex sophisticated.
18
2.3.6 Cognitive Load
One of the interface challenges is the atmosphere around the subject in the real world. The subject will be affected by cognitive load due to other tasks performed by the user, such as emotional responses, interactions with other people, and possibly even safety considerations. Therefore, studies on the effect of cognitive load on the efficacy of BCI control must be taken into consideration to suite the technology for real life applications [22].
2.4 Overview on BCl Exploit Control Signals and Techniques
2.4.1 Steady-State Visual Evoked Potentials (SSVEP)
SSVEP is a type of steady-state evoked potentials. An evoked response is an electrical potential recorded from the brain after a stimulus, and it is different from spontaneous potentials produced by the nervous system.
SSVEP is a resonance phenomenon that appears mainly in the visual cortex within the Occipital lobe when the subject concentrates on a periodic stimulus such as a flickering picture or light above 4 Hz [24]. This system uses an array of flickering lights (LEDs) or flickering symbols on screen with different flickering frequencies where each flickering light is associated with a certain control command [25].
The strongest SSVEP response is obtained from stimulation frequencies (fundamental frequency) in the range 6–20 Hz. The SSVEP response in the frequency domain can be seen as peak at fundamental frequency. Fundamental frequency is lowest frequency produced by each flickering light that is dedicated with a command also called first harmonic. The higher multiples of the fundamental frequency are called harmonics (second and third harmonics etc.) also appear in the frequency domain [24] [5]. All harmonics are periodic at the
fundamental frequency. Figure 2.2 shows the fundamental frequency has the highest spectral density at 7 Hz and the attenuating spectral densities of its harmonics appear at 14 Hz, 21 Hz, etc.
SSVEP BCI system task is to decide which flickering light the user is looking at based on detecting the fundamental frequency that appears in the user’s spectral analysis and accordingly specify and associate the type of command or action aimed by the user.
A SSVEP based system is suitable for applications with limited number of commands unless the system uses multi-layer selection technique [66]. This is because in designing such
19
system, the fundamental frequencies that denote certain commands have to be separated from each other by at least 0.5 Hz to avoid distortion (frequency overlapping). Also, any selected fundamental frequency of a command should not match any of the harmonic frequencies of other commands. For example as shown in figure 2.3 if the fundamental frequency is chosen at 7 Hz for a certain command (e.g. move left) its harmonics will appear at 14 Hz and 21 Hz and the multiples of 7 Hz. When selecting another fundamental frequency for another
command (e.g. move right) the fundamental frequency should be separated by at least 0.5 Hz from the previous fundamental frequency. So it can be at 7.5 Hz and its harmonics will appear at 15 Hz, 22.5 Hz and so on. Accordingly, the harmonic frequencies of this example: 14, 15, 21 and 22.5 can't be used as fundamental frequency for other command.
Figure 2.2: SSVEP Frequency spectrum of fundamental frequency at 7Hz and its harmonics [24]
20
Another disadvantage of such systems show that users do not feel comfortable while concentrating on a flickering light as this can be quite annoying and can provoke
epileptic seizures [25]. However, it is known with its high information transfer rate than other BCI systems.
B. Wittevrongel et al [66], designed hierarchical SSVEP spelling application that relies on joint frequency-phase coded targets and propose a new decoding scheme based on
spatiotemporal beam forming combined with time-domain EEG analysis. Their experiments confirm that the new decoding scheme achieve accurate spelling in online tests [66].
Researchers are also studied the effect of colors on ITR such as the recent study by M. K. Hasan, R. Z. Rusho and M. Ahmad [5] as they studied the effect of an angular position of the screen and the use of red and green colors for stimulation. In their research, they
demonstrated that there is no big difference in using red color over green but also advised of using small angular distance between the user and screen to lie in the visual field [5]. Not only communication have attracted researchers using SSVEP signals, some studies are trying to use it in driving motor vehicles as introduced by L. Bi, X. a. Fan, K. Jie, T. Teng, H. Ding and Y. Liu [26] . In their research, a simulation of driving a vehicle is used. The users are asked to do some driving skills like moving the vehicle forward, stop, steering left and right and avoid obstacles while they are concentrating on an SSVEP checkerboards associated with turning left and right, and closing eyes when intending to stop and then do nothing when moving forward. The users achieved a 76.87% mean accuracy which is not perfect but it is a step forward for such application [26]. While the SSVEP is known to be detected from the occipital lobe, H. T. Hsu, I. H. Lee et al [27] focus their study on detecting
amplitude-frequency characteristic of SSVEP from the frontal lobe. They found that it is better to detect the SSVEP from the occipital lobe than the frontal lobe as the signal to noise ratio in occipital lobe is higher[27]. Controlling a wheelchair is one of the most used applications of BCI and researchers are competing in finding out the best and most efficient way to control it.
Researchers are even trying to minimize the number of electrodes needed for this application as shown recently by S. Andronicus, N. C. Harjanto, Suprijanto and A. Widyotriatmo [28], who used only one electrode located at Oz to control a robotic wheelchair and obtained an average correct classification of 84.94% with ITR of 68.9440 bits/min. [28]
21
2.4.2 Motor Imagery
In Motor-imagery based BCI systems, the EEG signals of a user resulting from visualizing a limb movement or performing a limb movement have very specific features. These features like amplitude and skewness are relatively easy to be recognized in EEG. When visualizing limb movement it results in a decrease of power in the mu (µ) and beta (β) rhythms in the associated part of the moving limb and this is known as Event Related Desynchronisation (ERD). For example the left brain motor cortex is associated with the right hand movement and vise versa so if the user visualized moving his right hand this will result in a decrease in the EEG signal power detected from the left motor cortex. Figure 2.4 shows ERD signal of left hand and right hand motor imagery action detected from electrode C3 and C4. The effect of the left/right hand motor imagery movement can be detected on both sides of the brain motor cortex. However, the left hand motor imagery movement results in a dramatic decrease in the EEG power signal on the right side of the brain as the right side is associated with the left hand movement and vice versa.
Figure 2.4: ERD signal of left hand and right hand motor imagery starting at 3s [9]
Motor imagery based BCI systems are used to control the movement of a mouse curser or a wheelchair based on decoding imagination of the user moving his own limbs (hand, feet) for e.g. imagining right/left hand movement for right/left directions or even imagining tongue movement [29] [9]. The main challenge in this type of EEG signals is low signal to noise ratio and the non-stationary nature of the EEG signal and inter-subject variability. Motor
22
imagery BCI systems require having long training sessions for the users [30] [31]. To overcome the noise and non stationary nature of EEG signal, researchers suggested using different processing and classification techniques. A. Ferrante, et al [30], developed a data-efficient classifier for left and right hand motor imagery. They combined in their pattern recognition both the oscillation frequency range and the scalp location using a combination of Morlet wavelet and Common Spatial Pattern to deal with the noise and non–stationary
features of the EEG signal and obtained good results with average accuracy of 88% [30]. Another research done by T. Yu, et al. [31] suggested the use of a hybrid feedback by combining motor imagery and steady-state evoked potentials SSVEPs to provide effective continuous feedback for motor imagery training. In this research, subjects must focus on flickering buttons as they perform motor imagery tasks in the beginning of the training session. Then by time the subjects can gradually decrease their visual attention to the flickering buttons until feedback is taken only from motor imagery signals. This method enables subjects to generate distinguishable brain patterns of motor imagery after five training rounds [31]. In addition S. Brandl, et al [4] investigated the performance of motor imagery BCI in a pseudo realistic environment. The aim of this study is to find out if robust BCI procedures that work well in the lab will do the same in the realistic life in the presence of noise distractions. They found out that standard BCI procedures cannot handle the
additional noise sources in real life and the types of noise distraction may greatly affect the extracted features [4].
2.4.3 P300
P300 is a type of Event Related Potential (ERP), this signal is denoted by P3 or P300 referring to the third highest positive peak that takes place around 300ms after the user is exposed to a visual stimuli. P1 and P2 refer to the first and second positive peaks that took place around 100ms and 200ms after a stimulus is presented. While and N1 and N2 refers to the negative 2 peaks of this signal but P300 signal is named after P300 because it is the highest peak among all peaks as shown in figure 2.5.
23
Figure 2.5: P300 signal responses peak at P1, P2 and P3 [58]
P300 signal occurs when the user is in cognitive state (awake) concentrating on a screen waiting to recognize rare stimulus (target command). This rare stimulus is the flashing of the target command that the user needs to select within many random flashing of non target commands. This technique is called Oddball paradigm technique [9] [32]. The user focuses on a single command that may represent an action or a picture or a character and waits for it to appear in series of many different commands. When the rare stimulus takes place after random times of stimulations, the P300 response is detected after 300ms of the appearance of the rare stimulus. This is mostly detected in the parietal and occipital lobes [9] [32] [33].
Generally, a P300-based BCI system detects the presence of P300 in the EEG signals in order to select a target command or action chosen by the user. The P300 is mostly used in a kind of “virtual keyboard” application known as the P300 speller. This speller depends on flash in rows and columns of the keyboard in a random way while the user focuses on the letter he wants to spell as the letter will flash in each trial twice. First time is when the keyboard row flashes and the second time is when its column flashes. A P300 is detected when this row and column flash and therefore, the combination on the row number and the column number identifies the target character or action [9] [34].
Research studies worked on increasing the ITR and the accuracy obtained. In the recent study by B. Koo, et al [35], suggested a hybrid P300 Speller using P300 signal and
Electrooculography (EOG) based gaze tracking system. They split the menu items into two monitors, the EOG signals that identify which monitor the subject is focusing on and the P300 system that identifies the item that subject is focusing on and wants to select it. This
24
system yield classification accuracy of 80% which is about the same as the conventional P300 system [35]. Another research group A. Kabbara, et al [3] used algorithms based on the independent component analysis (ICA) and adaptive channel selection procedure to improve the performance of P300 speller and remove artifacts. This method yields an averaged classification accuracy of 95% using Support Vector Machine (SVM) classifier [3]. A study done by K. Kohei, et al [21] for solving the Issue of autonomy and security of BCI system, the user physically can’t switch ON/OFF their BCI system and they need their caretakers to switch it for them. This study suggested using the user’s intention of input which is recording the users EEG signal in both the ‘control state’ and ‘non control state’ and continuously comparing the users EEG signals to these recordings. If the user is in the control state the system will switch ON the P300 speller. This system achieved 89.3% average accuracy taken from four subjects [21]. Other than P300 spellers researchers suggested the use of P300 for controlling a Humanoid Robot and yields classification accuracy above 90% but in the offline test [36]. Another attempt to control virtual robot manipulator using P300 speller was adopted by A. Malki, et al [32]. They used data collected from Emotiv EPOC neuro-headset with OpenViBE software to control seven degree of freedom manipulator by choosing characters from the speller, six characters are associated with 6 movements in the Cartesian space and this study yields an accuracy of 63% in online test [32].
2.4.4 Overview conclusion
Form the presented overview we can conclude that the best technique which provides good accuracy with high ITR is SSVEP. However it has drawbacks related to limited number of commands unless the SSVEP system uses multi-layer selection technique, the demand for long training sessions, flickering light problems.
On the other hand motor imagery techniques are used more for motion control, such as
controlling wheelchair or moving robot arm because no flashing screens are needed therefore, provides better mobility to the user. This method needs long training sessions and has limited number of commands as it mainly depends on visualizing of upper and lower limb motor movements.
As for P300 based systems they have low accuracy in the online test unless it is hybrid with one of the other two techniques (SSVEP, Motor Imagery). This will improve the accuracy but the system will be complicated and require more electrodes attached to the user scalp.
25
Therefore, the aim of this thesis is to avoid going through the addressed problems in other BCI systems as mentioned above and propose a generic blink and wink based BCI system.
2.5 Objectives
a) Study the eye Blink and Wink features and their different types b) Define the system design goals:
o Define the challenges for the system setup to achieve a generic BCI system.
o Design a generic system that solves the problem of long training sessions and adjusting the system on every single user as in SSVEP, Motor Imagery and P300 signals.
o Avoid the flicking light of SSVEP systems and the limited number of commands in Motor imagery and SSVEP unless the SSVEP system uses multi-layer selection technique.
o Achieve higher system average classification accuracy than P300 based BCI system with less number of channels and no system calibration.
c) Layout the functional requirements and the design details of the system. d) Using open source software to implement the system design.
e) Experimental test, evaluate and compare with other work.
2.6 Related Work
Relative to researches done using SSVEP, motor Imagery and P300 signals, very few
researches suggested the use of Eye Blinks as a control signal and proposed systems based on such signal. Eye blinks are usually considered as an artifact in the EEG signal and have to be removed for the sake of detecting more hidden signals such as P300 which have relatively very low amplitude compared to eye blinks. Although the late stages of ALS patients can’t even control their eye lid muscles to blink but still the majority of patients with severe motor disabilities including patients in the early stages of ALS have the ability to blink their eyes.
S. Rihana, et al [8], studied Eye blink signal in 2013 using Probabilistic Neural Network as a binary classifier. In this study BioRadio portable device is used for recording EEG signal and
26
(Fp1-A1, Fp2-A2, O1-A1 and O2-A2) electrodes were chosen to detect the Eye Blink signal as shown in figure 2.6, average accuracy of blink detection was around 75.375 % [8]. Another research by D. Bansal, et al. [7] in 2014 to study the eye blink signal using
independent component analysis (ICA) algorithm to identify deliberate eye blink. They used EMOTIV headset for EEG acquisition and EEGLAB in MATLAB for signal processing. They studied different spectral analysis techniques such as, power spectrum, time-frequency
Figure 2.6: Electrode placement in S. Rihana, P. Damien and T. Moujaess research [8]
plot and phase coherence plot to accurately recognize the dominant frequency component corresponding to different eye blinking patterns and accordingly develop an algorithm used to control applications for rehabilitation [7].
B. Chambayil, et al [23] are the first to initiate the use of eye blink based BCI system for user communication. They designed a virtual keyboard (character panel) in 2010 that is divided into three sets of characters blocks. Each set of characters consists of three rows and columns. The user selects one of the blocks by blinking once, twice or three times according to the sequence of the character blocks. Then, the user has to select the column where the desired character lies by blinking once, twice or three times for selecting the corresponding number of column. The user has to repeat this process for selecting one of the three characters in that column. They used FP1-F3 or FP2-F4 electrode pairs for detecting EEG signal and this system character transfer rate was 1 character per min [23].
J. S. Lin, et al [37] in 2010, used NeuroSky's headset that uses unipolar electrode to detect eye blinks to control an electric wheelchair. First they normalized brain waves like beta,
27
alpha and gamma to construct two signals indicating meditation and attention state. The user will be aided with rotating compass panel to choose the direction of the compass by eye blink to steer the wheelchair and double blink to stop the motion while high level of attention to move forward. Finally, the presented experimental results showed that the developed system can provide a convenient manner to control an electric wheelchair but no classification accuracy records were provided [37].
K. S. Ahmed [2] in 2011 used Emotiv Epoc Headset with 14 electrodes mounted on the scalp and used wavelet analysis and Neural Network system for processing and classification. This system produced four movement commands of a wheelchair which are turn right, turn left, move forward and stops using right wink, left wink, single and double blinks. This system achieved 80% sensitivity and 75% specificity [2].
H. Wang, et al. [38] in 2014 used a hybrid system combining motor imagery, P300 potentials and eye blinking. NeuroScan EEG device is used with 15 electrodes located over the frontal, Parietal and occipital lobes. A graphical user interface (GUI) is used to show the motor imagery score and help users to control the chair. Seven steering behaviors were used forward, backward, turning right, turning left, acceleration, deceleration and stop. The experiment was tested by four healthy subjects and it shows efficiency and robustness [38].
K. Goel, et al [39] in 2014 introduced a hybrid BCI Based system to control various home appliances using SSVEP and Eye Blinks. They provided a hardware implementation to control a table lamp and a table fan. The user concentrates on a flickering light to choose his action and then confirms his selection by blinking three times. This system achieved SSVEP average accuracy of 94.17 and average eye blink accuracy 100% [39].
Another BCI hybrid system was introduced in 2015 by L. R. Stephygraph, et al [40] they introduced BCI system based on eye blinking strength to control a wireless mobile robot and producing different classes of movement depending on the blink strength. They used
NeuroSky Mind wave sensor for acquiring EEG signal and used Discrete Wavelet Transform (DWT) to analyze the eye blink. Different classes of movement were produced using right blink, left blink for moving the robot right and left and long blink or eyes close to move forward and quick blink to move backwards and finally stress blink to stop [40].
28
S. Soman and B. Murthy [41] in 2014 have designed a BCI system using eye blinks for synthesized speech communication. The user selects phrases from a configured list to help them communicate with other people. The authors used Emotiv Epoc headset for acquiring EEG signals and used electrodes placed in the frontal regions AF3, AF4, F7 and F8 to detect Eye blink signal and applied Common Spatial Pattern (CSP) techniques and Linear
Discriminate Analysis (LDA) using OpenViBE software for signal processing and classification. The system gave an accuracy of 95% in Offline test [41].
Another attempt to design a synthesized speech BCI system was presented by A. K. Singh, et al. [42] in 2015. In this study they used eye blink intensity to differentiate between two types of eye blink soft and hard presented in terms of ‘0’s and ‘1’s. The user will have to perform four blinks and translate these blinks into four bits that include combination of ‘0’s and ‘1’s that represent a code to reflect a text. The user will generate the code using soft or hard blink to select the text. NeuroSky headset is used for EEG Acquisition using one electrode FP1. This design was tested by four healthy subjects and they achieved average accuracy of 84.4% [42].
2.7 Thesis outline
This thesis is divided into eight chapters. Chapter 1 general thesis introduction. Chapter 2 presents the literature review, chapter 3 focuses into understanding eye blinking and wink signals. Chapter 4 introduces conceptual design of the proposed system and chapter 5 discusses the designed system architecture. While chapter 6 presents testing the proposed system with P300 Speller results and discussion and chapter 7 illustrates the testing of the proposed system with smart home application results and discussion. Finally chapter 8 includes conclusions and research points for future research work.
29
Chapter 3
Eye Blinking and Wink Signal
Eye blinks are considered as control signal in Electrooculography (EOG). EOG is a non-invasive and inexpensive technique of recording eye movements. The source for EOG signal is cornea-retinal potential (CRP) which is generated due to the movements of eye balls [43].The eye blink signal acquired by EOG electrodes is different from the signal acquired by EEG due to the different positioning of the electrodes as the EOG detects signal recorded above and under the eyes with a reference electrode placed behind the ear [44].
3.1 Classification of Eye blinks
Since an Eye Blinking signal can be precisely characterized, detected and processed it is considered a suitable control signal [19] [23]. Eye blinking signal is generated due to the contraction of set of muscles in the eye lid which produces an electrical signal that can be detected by EEG from the brain or directly from the muscles around the eye using EOG [43]. Eye blinks can be classified into four types: Reflexive, Spontaneous (involuntary), Intentional (voluntary) and Winks.
3.1.1 Reflexive eye blink:
Reflex eye blink is a simple reflex action of the eye due to external stimuli like being exposed to sudden bright light. This action for example has low amplitude and does not require the involvement of cortical structures [23].
3.1.2 Spontaneous (involuntary) eye blinks:
Occurs naturally to clean, lubricate and oxygenate the cornea and they are associated with the psycho-physiological state of the person and does not require external stimuli [44] [23].
3.1.3 The Intentional (voluntary) eye blinks:
Has high amplitude peaks as shown in figure 3.1 , these peaks are high compared to the rhythmic brain activity and can be detected from multiple areas of the cerebral cortex especially the frontal and occipital lobe as we will discuss it later [23][45].
30
Figure 3.1: Intentional Eye blink signal [23]
3.1.4 Eye wink:
Is a form of intended eye blinking using one eye and it has also high amplitude compared to normal brain rhythms. Eye winks appear mostly in the frontal lobe and can be detected using AF3, P7 for left wink and AF4, P8 for the right wink as we will discuss later.
3.2 Studying features of Eye blink signal
The EEG signal is stochastic, and each set of samples that represent the EEG signal is called sample functions x(t) or realization. The mean of the realizations is called the first order central moment or expectance (μ). The variance of the realizations is called the second order central moment. The spread or dispersion around the mean of the realizations is called the standard deviation (σ) and it is the square root of the variance. The third order central moment is called Skewness and it represents the degree of asymmetry of the signal
distribution around its mean. The fourth order central moment is called the Kurtosis, meaning curved or arching which is the measure of flatness or peakness of the signal distribution [44] [23].
Some researchers like S. Rihana, et al. used kurtosis coefficient which defines the sharpness of the peak of a frequency-distribution curve as shown in figure 3.2
31
Figure 3.2: Illustrates how low and high kurtosis appear
Researchers used kurtosis coefficient to classify eye blinking signals for BCI systems as Eye blink produces high kurtosis coefficient when an eye opens or closes. Other actions (like reflex blink) or movements (like neck or head) generated by the user produces small value for kurtosis coefficient. Therefore, eye blinking events can be detected by kurtosis coefficient [23]. Kurtosis is defined in equation (3.1), which refers to a non-Gaussian distribution, where x(t) is the signal function in time domain, μ is the first order moment about the mean and σ is the standard deviation.
(3.1)
Another main feature of blink signal is its high positive and negative amplitude peaks that are relatively higher than the brain activity rhythms (higher than 100µV when measured from the scalp). This feature makes the signal to noise ratio very high and therefore, increases the sensitivity of the system to the control signal. Also detecting high amplitude signal does not need sophisticated system and computation algorithms yet gives good classification accuracy. Therefore, we will concentrate on this feature in this study.
3.3 Detection of eye blink using EEG
This section illustrates the blink and wink signal after removing the noise to be able to see its real effect in EEG. Noise is any unwanted signal that affects the target signal which the system wants to detect. Noise can be originated from different sources like the system noise introduced by electronic circuit components and act as a power supply of 50-60HZ, noise
32
coming from the environment surrounding the subject and it ranges around 50Hz or
biological noise like neck movement, eye movements. The average duration of an intentional eye Blink or Wink is approximately 400ms [62] [63]. This duration varies from one person to another and these variations can be due to gender, age, and health condition or internal brain structure [64].
3.3.1 Left wink
Left Wink signal can be detected in all the electrodes but it reaches its highest amplitude at electrode named ‘F7’ and ‘AF3’ as shown in figure 3.3 due to the location of these electrodes on the left side of the brain and near to the left eye which is the origin of this signal. Both ‘F7’ and ‘AF3’ lie in the frontal lobe. The wink signal duration can take less than 0.5 sec according to the speed of closing and opening the eye.
![Figure 2.2: SSVEP Frequency spectrum of fundamental frequency at 7Hz and its harmonics [24]](https://thumb-us.123doks.com/thumbv2/123dok_us/10988928.2986618/35.893.184.723.466.657/figure-ssvep-frequency-spectrum-fundamental-frequency-hz-harmonics.webp)
![Figure 2.4: ERD signal of left hand and right hand motor imagery starting at 3s [9]](https://thumb-us.123doks.com/thumbv2/123dok_us/10988928.2986618/37.893.169.719.572.906/figure-erd-signal-left-right-motor-imagery-starting.webp)
![Figure 3.1: Intentional Eye blink signal [23]](https://thumb-us.123doks.com/thumbv2/123dok_us/10988928.2986618/46.893.283.614.106.414/figure-intentional-eye-blink-signal.webp)