econ
stor
www.econstor.eu
Der Open-Access-Publikationsserver der ZBW – Leibniz-Informationszentrum Wirtschaft
The Open Access Publication Server of the ZBW – Leibniz Information Centre for Economics
Nutzungsbedingungen:
Die ZBW räumt Ihnen als Nutzerin/Nutzer das unentgeltliche, räumlich unbeschränkte und zeitlich auf die Dauer des Schutzrechts beschränkte einfache Recht ein, das ausgewählte Werk im Rahmen der unter
→ http://www.econstor.eu/dspace/Nutzungsbedingungen nachzulesenden vollständigen Nutzungsbedingungen zu vervielfältigen, mit denen die Nutzerin/der Nutzer sich durch die erste Nutzung einverstanden erklärt.
Terms of use:
The ZBW grants you, the user, the non-exclusive right to use the selected work free of charge, territorially unrestricted and within the time limit of the term of the property rights according to the terms specified at
→ http://www.econstor.eu/dspace/Nutzungsbedingungen By the first use of the selected work the user agrees and declares to comply with these terms of use.
zbw
Leibniz-Informationszentrum Wirtschaft Leibniz Information Centre for EconomicsMüller, Sven
Working Paper
A spatial choice model based on
random utility
Diskussionsbeiträge aus dem Institut für Wirtschaft und Verkehr, No. 2/2009
Provided in cooperation with:
Technische Universität Dresden
Suggested citation: Müller, Sven (2009) : A spatial choice model based on random utility, Diskussionsbeiträge aus dem Institut für Wirtschaft und Verkehr, No. 2/2009, http:// hdl.handle.net/10419/39241
akultät Verkehrswissenschaften „Friedrich List“
ISKUSSIONSBEITRÄGE AUS DEM
NSTITUT FÜR WIRTSCHAFT UND VERKEHR
R.2 /2009
SPATIAL CHOICE MODEL
ASED ON RANDOM UTILITY
HERAUSGEBER: DIE PROFESSOREN DES
INSTITUTS FÜR WIRTSCHAFT UND VERKEHR
ISSN 1433-626X
FD
I
N
SVEN MÜLLER
A
B
In den Diskussionsbeiträgen aus dem Institut für Wirtschaft und Verkehr der TU Dresden
er-scheinen in zeitlich loser Folge verkehrswirtschaftliche Arbeiten von allgemeinem Interesse.
Die Diskussionsbeiträge enthalten Vorträge, Auszüge aus Diplomarbeiten, interessante
Semi-nararbeiten, verkehrswirtschaftliche Thesenpapiere, Übersichtsarbeiten, ebenso wie Beiträge,
die zur Veröffentlichung in referierten Zeitschriften vorgesehen sind. Allen Beiträgen
gemein-sam ist wissenschaftliche Fundierung und wissenschaftlicher Anspruch, jedoch je nach Zweck
des jeweiligen Beitrages in unterschiedlichem Maße.
Als Herausgeber fungieren die Professoren des Instituts für Wirtschaft und Verkehr der TU
Dresden.
A Spatial Choice Model Based on Random Utility
Sven M¨uller?Working Paper
December 18, 2009
? Dr. rer. pol. Sven M¨uller
Institute of Transport and Economics, Technische Universit¨at Dresden, 01062 Dresden, Tel.
A Spatial Choice Model Based on Random Utility
Summary
Decreasing number of students in Germany lead to the closures of schools due to lack of uti-lization. Hence, competition between schools will increase. We use a mixed multinomial logit model in order to identify influencing factors of school choice and to regard realistic substitu-tion patterns within the context of forecasting school choice probabilities with changing choice sets over time. Results yield commuting distance as the most important factor, but school characteristics like profiles (math or languages, e.g.) and spatial attributes like centrality have remarkable impact, too. Moreover, the analysis shows heterogeneity in population. For our sample we identify authority responsible (private/public school) as the most important variable to specify substitution patterns. Using the results, we simulate the effects of school closings and openings in realistic scenarios.
Keywords: School choice, secondary schools, mixed multinomial logit, school closure, school openings, urban areas
1
Introduction
More and more regions in Europe are confronted with declining school enrollment due to low fertility rates or negative net migration or even both. Consequently, authorities are forced to reduce the number of school locations. Future generations of students have to choose a certain school location from a reduced set of remaining schools and may face a longer commute to school. Within the framework of long term school network planning it is important to know how students disperse under a changing choice set of schools over time (M¨uller, 2008). We expect that commuting distance and the school specific characteristics (profiles, centrality, school size and authority responsible) are important and sufficient factors determining the choice of a certain
school location in Saxony, Germany (Speiser, 1993; Mahr-George, 1999; Schneider, 2004; M¨uller,
2006; M¨uller et al., 2008). We differentiate between schools with a common profile and schools
with a unique profile. A school with a common profile provides a service (mathematics/science for example) which is comparable to a lot of other schools. Usually, schools offer a combination of two common profiles. In contrast, a unique profile is offered by one school only. For example: If a school offers remarkable more languages than most of the other schools we name this profile
core languages. Moreover, we name a school offering a unique profile magnet school since it is the only one in a particular region offering such an educational service. So students are attracted by this school over a broad geography.
In Germany tuition fees only occur at some private schools. They are at a low level usually. So, we do not explicitly pay respect to tuition fees in this study. Also, the confessional affiliation are neglected here as an explanatory variable. Particularly in Dresden, there are no confessional constraints concerning enrollment and again just a few private schools have a strict confessional affiliation. Note that the number of private schools is increasing recently. In future, tuition fees and confessional affiliation will have a much greater impact on school choice (Barthels, 2007b). It is valuable to know which combination of profiles increases the choice probability of a certain school and whether there is heterogeneity in the sensitivity of individuals to the influencing
between different alternatives (Haynes et al., 1988), notably if the choice set differs over time (M¨uller et al., 2009). With declining enrollment the competition between schools will increase. Easy accessible schools with an attractive combination of profiles will gain more students than others. This in turn leads to a reduced risk of being closed by school authorities.
In this contribution we utilize a mixed multinomial logit model (MMNL) to describe the process of school choice and analyse the consequences of opening and closing schools in the City of
Dresden, Saxony. For this, the remainder of this article is as follows: Section 2 covers an
overview of the literature and the theoretical model determining the school choice probabilities. In section 3 we describe the data used followed by the estimation of a series of models (section 4). In section 5 we simulate the choice probabilities for different scenarios, which cover school openings and closures. Some final remarks can be found in the 6th section.
2
School choice modelling
This section deals with the student’s individual choice probability for each school, dependent on commuting distance and school specific characteristics. There are no school districts in Saxony so students are free to choose a certain school location. Deterministic approaches which yield spatially consistent school districts are not appropriate here. We assume that each student chooses the school with the highest utility. A probalistic approach with respect to individual utility should be used. The multinomial logit model (MNL) has been well established within the context of destination or location choice modelling (McFadden, 1973; Ben-Akiva and Ler-man, 1985; Hansen, 1987; Gabriel and Rosenthal, 1989; Hunt and Teply, 1993; Bhat, 1997; Drezner et al., 1998; Greene, 2003; Becker et al., 2005). Recent studies on school choice - partly applying MNL - were focused on the discrimination between the choice of private and public schools (Figlio and Stone, 1997; Alderman et al., 2000) or the question whether students will take part in higher education. For example: whether they enroll on a college (Brinkmann and Leslie, 1987; Kane and Spizman, 1994; Schneider, 2004)? Lankford and Wyckoff (2000) study the relationship between racial composition of schools and school choice. Their results show that the racial composition of schools and neighborhoods are very important within the context of choosing between private and public schools. The choice between voucher and non-voucher schools in Chile has been studied by Contreras (2002). He finds that school choice is gender based. Females more often choose voucher schools, while males more often choose private, non-voucher schools. The results of Nguyen and Taylor (2003) seem to evidence that a full choice set is superior to combinations of sub-sets for the modelling of college choice. Montgomery (2002) used the logit-approach to model the choice process of universities using cost variables mostly. Hoxby (2003) mainly discusses the economic benefits of free school choice such as increase in productivity and welfare but less which variables determine the process of school choice. The most influencing factors for parental choice of school location seem to be proximity and academic quality (Glazerman, 1997; Goldring and Bauch, 1995; Kleitz et al., 1998; Peterson and Hassel, 1998).
In eastern german cities the share of ethnic minorities is very low (except Berlin) and so we as-sume that the racial composition does not have a strong influence on school choice here. There exist no voucher schools in Germany and there are just a few private schools. Nevertheless, the latter are emerging recently (see section 1). So most of the studies mentioned before focus on attributes which seem to be of less interest concerning school choice in Germany, particularly
Saxony. We assume that school choice is related to profile, authority and proximity (M¨uller,
2006; M¨uller and Haase, 2009).
of school closures and openings. Therefore we consider substitution patterns between schools. Also, we like to consider individual heterogeneity to explore taste variation within the popu-lation. Here the MNL is not appropriate because its restrictive assumptions concerning the stochastic utility component (Train, 2003, p.46-56), for example it exhibits independence from
irrelevant alternatives (IIA) and yields unrealistic substitution patterns. Concerning school
choice modelling, Borgers et al. (1999) point out that a standard/conventional logit model is not appropriate to include substitution effects. In this case it appears to be that the more general mixed multinomial logit model (MMNL) is superior to MNL due to its flexibility con-cerning substitution patterns and individual heterogeneity (Brownstone and Train, 1999; Dow and Endersby, 2004; Gottlieb and Joseph, 2006). Besides empirical experience with this kind of discrete choice model from other fields of research (Rouwendal and Meijer, 2001; Hensher and Greene, 2003; Bhat and Gossen, 2004; Smith, 2005) particularly Hastings et al. (2005) use a MMNL to identify parental preferences and school competition. They analyze how demand disperses in a situation of free school choice for elementary and middle schools. Using data from a stated preference survey they discover proximity, ethnicity and academic quality as the most influencing factors. These variables show significant variation in individual heterogeneity. We therefore revert to the MMNL as well.
MMNL structure
The mixed logit probabilities are the integrals of the well-known logit probabilities over a density
1 of parameters (Bhat, 2000). Generally, the model takes the structure:
Pis(θ) = Z Lis(β)f(β|θ)d(β) (1) with Lis(β) = exp(β0xis) P ˜ sexp(β0xis˜) (2)
wherePis is the probability that studentichooses schools. Here,xis is a vector of
alternative-related observed variables, while β represents parameters that are random realizations from a
density function f(·) characterized by a vector of underlying moment parameters θ, which are
normally distributed in our case. Here, the overall random term associated with the utility of each alternative is divided into two components. In order to capture individual heterogeneity and correlation across alternatives, the utility function for studentiand schoolsis specified as:
Uis=γ0yis+ξis =γ0yis+µ0izis+εis (3)
where yis and zis are vectors of observed variables related to school s and student i, γ is a
vector of coefficients of the systematic component of utility, µi is a random vector with zero
mean and εis is independent and identically extreme value distributed (IID). The terms in zis
are error components that, along with εis, define the stochastic component of utilityξis, which
can be correlated over alternatives depending on the specification ofzis. Here,zis is a subvector
1
This density is also called the mixing distribution. The name mixed multinomial logit model is dispositional on this.
of yis primarily containing variables of the school attributes (like the schools’ authority). The
stochastic part of utility yields tastes not observed by the researcher are used by the student to evaluate schools (random taste variation), and since we do not observe these tastes completely, this portion of utility is correlated over schools (unobserved attributes). The covariance of two schoolssandlis denoted by Cov(ξis, ξil) =E(µ0izis+εis)(µ0izil+εil). We expectE(µi) =E(εis)
=E(εil) = 0. Let us denote the covariance ofµi asW. So E(µiµ0i) =W. For a given i:
W = σ11 σ12 σ13 · · · σ21 σ22 σ23 · · · σ31 σ32 σ33 · · · · · · ·
withσ11=E(µ1µ1) and σ12=E(µ1µ2) and so on. If we consider the covariance of two different schools Cov(ξis, ξil), then
E(µ0izis+εis)(µ0izil+εil)
= E(µ0izisµ0izil+µ0izisεil+µ0izilεis+εisεil)
= E(µ0izisµ0izil)
Since zis and zil are known rather than expected it follows
= zis0 E(µiµ0i)zil
= zis0 W zil.
If we consider zis as a dummy variable which indicates whether the school s is private (=1)
or not (=0) then this last term determines whether the two schools s and l are correlated
(zis=zil = 1) or not. The degree of correlation is defined byW. Hence, the MMNL can handle
the IIA problem automatically if the error components are spcified in a sufficient way. Note, that the probabilities of (1) are approximated through simulation for any given value ofθ(Train, 2003). A short description of the estimation method is given in the appendix.
3
Data
The spatial data set includes geographies (blocks2, wards and districts), the school locations and
the street network of Dresden. Using a shortest path algorithm we determine the street network distances between all blocks (round 6,400) and school locations (23). In this study we focus on colleges (german: ”Gymnasium”). Figure 1 displays the spatial distribution of all colleges and college students in Dresden for the years 2004, 2008 and 2012 (see section 5). We do not consider the colleges Sportgymnasium and Abendgymnasium, because they are supra-regional colleges or rather special boarding schools. They are not representative and would distort the modelling. The school sizeVs, is the number of classes per class-level (synonyms: year, grade)
3. Furthermore, we obtain information on the profiles offered by each college as well as the
authority responsible. We assume that unobserved attributes of colleges are associated with authority responsible. For example, it is likely to assume that private schools have a better academic quality than public schools because of a better teacher-student ratio. Private schools 2
A block is the smallest geographical unit for administrative issues in Germany. A ward contains at least one block, while a district consists of one ward, leastwise.
3
often have a confessional affiliation (Barthels, 2007a). As mentioned in section 2 tastes of the students to these unobserved attributes are correlated over schools.
Figure 1: Colleges and college studen ts in the Cit y of Dresden
In 2004 we have carried out a survey covering nearly 4,700 of 12,000 college students at 13 of 20 colleges. One outcome of this survey is the revealed preferences of students to school choice. Unfortunately, we just have information which school a given student attends. We do not know which school the student prefers basically. We assume that a student who is not allowed to attend the school with the highest utility - due to capacity reasons for example - the student is willing to attend the school with second highest utility and so on. So, for every student our sample provides information about the chosen school, which is the school with highest utility and the student is ”allowed” to enroll on.4
Forthcoming information of each student are the block where the student is located (home) and
the attended school among other information (M¨uller et al., 2008). College students are aged
between 10 and 18 years. Colleges in Saxony, Germany, cover 5th - 12th class-level. For each school our data set includes information onVs, profile, authority responsible (=1 private school,
=0 public schools) and the distance dis travelled to schoolsby student i(see table 1). We use
distance instead of travel-time because we consider future scenarios of a school network (see section 5). But some of the school locations of future school network scenarios are not existing at the moment. Therefore, it is not possible to compute exact public transport travel-times for
those school locations.5 However, we assume a student evaluates distance with the travel-time
of an appropriate transport mode. So, in the choice situation distance serves as a proxy for travel-time implicitly.
Since we expect a nonlinear influence by distance on students school choice, we consider a log-distance measure besides the simple log-distance measure. It is reckoned that the location of a school in the meaning of centrality has influence on school choice as well. The centrality of a schoolCs is measured in distance (km) from school sto the city center6. Schools located close
to the city center are more easy to access by public transport and car than those located at the outskirts. We assume that it is more attractive for a student located at a outskirts-district
to attend a school located close to the city center (low value of Cs) than to attend a school
located at a different outskirts-district (high values of Cs). More central schools are supposed
to obtain a higher utility than others. We consider a dummy variable which indicates whether the closest school is a magnet school (=1) or not (=0). Regarding the average distance in table 1 it is conjecturable that there will be a relatively high proportion of students choosing a magnet school even when located far away. Since the utility function is linear-in-parameters, enumeration maybe leads to unrealistic high probabilities for students located close to magnet schools - all other variables constant. Thus, the expected sign of this ”compensation” coefficient will be negative.
We have eliminated the colleges Großzschachwitz, Joseph-Haydn and Fritz-L¨offler from the data
set in order to avoid distortion. These colleges are already closed for enrollment in 2004 (year of the survey). For example, in 2004 there are students - especially at lower class-levels - attending
Julius-Ambrosius-H¨ulße College which is next to Großzschachwitz just because they are not
allowed to enroll on the closest college Großzschachwitz (M¨uller et al., 2008).
4 Note that it is supposable that the decision which school to choose is mainly influenced by parents. 5
One has to consider new lines and schedules e.g. 6
College priv ate p1 p2 p3 p4 p5 Num b er of w eigh ting distance [m] Cs Vs sc ho ol chosen alt. factor (WESML) a v er. std.dev. min. max. km classes P estalozzi* 0 1 0 0 0 0 3.518824 3 Großzsc hac h witz 0 1 0 0 0 0 2695.59 2579.33 615.64 13923.15 8.193287 4 Marie-Curie 0 1 0 0 0 0 201 2.005 4672.77 3180.37 100.00 16124.22 0.396577 4 B ¨urgerwiese** 0 1 0 0 0 0 1.140956 3 Seidnitz** 0 1 0 0 0 0 4.945167 3 Cotta 0 1 0 0 0 1 629 0.867 2970.62 1687.09 100.00 9495.55 4.218586 5 Joseph-Ha ydn 0 1 0 0 0 1 50 31.26 3117.52 232.00 12293.00 2.401082 4 Dreik¨ onigssc h ule 0 1 0 0 0 1 152 0.948 4141.44 3554.82 69.80 12097.99 1.979044 3 Vitzth um 0 1 0 0 0 1 266 0.869 2412.88 1708.30 70.00 12462.66 2.746265 4 B ¨uhlau** 0 1 0 0 0 1 7.881512 3 Bertold-Brec h t* 0 1 0 1 0 0 1.899466 4 F ritz-L¨ offler 0 1 0 1 0 0 24 15.43 2262.12 123.81 10440.70 1.991180 3 J.-A.-H ¨ulße 0 1 0 1 0 0 620 0.853 2503.82 1966.8 130.00 17800.59 5.238133 4 Klotzsc he 0 1 0 1 0 0 343 1.116 2240.11 1960.47 36.79 13039.69 7.581799 3 Plauen 0 1 0 1 0 0 441 1.099 2255.03 1875.7 8 123.78 16924.68 3.761541 5 Hans-Erlw ein* 0 1 0 1 0 0 3.630464 5 Carl-Maria-v on-W eb er * 0 0 0 0 0 1 3.553827 1 St. Benno 1 1 0 1 0 1 418 0.977 5554.11 2676.83 150.00 14688.66 0.832203 3 Ev angelisc hes Kreuzgymnasium* 1 1 0 1 0 1 3.827819 3 Martin-Andersen-Nex¨ o 0 1 1 0 0 0 261 0.961 3827.84 2578.77 273.76 14305.00 4.18 1314 3 Romain-Rolland 0 0 0 1 1 0 373 0.867 4649.81 3094.52 90.00 14851.61 1.427663 3 W aldorfsc h ule* 1 0 0 0 0 0 2.725931 2 Gymnasium der HOGA* 1 0 0 0 0 0 2.271985 1 a v erage 370,4 3382.76 2646.63 36.79 17800.59 3.3188495 3.35 p1: mathematics/scie nce (common) * colleges not within geo co ded sample p2: mathematics/scie nce (core) ** colleges op ened in 2012 p3: languages (common) Colleges written b old are ma gnet sc ho ols (u niq u e profile) p4: languages (core) p5: m usic/arts (common) T able 1: Data
4
Results
In this section we present and discuss the results of several model specifications. Although a Hausmann-McFadden test proved our suggestion, that the IIA assumption holds not true for our sample, we estimate a MNL in order to show the advantages of the MMNL for this specific study. The choice of variables to enter utility were determined through exploration. It turns out that the dummy variable for profile mathematics/science is not significant because nearly every
college offers this profile. The log of dis yields a remarkable lower pseudo-R2 and we remove
this variable. Experiments with different model specifications concerning the stochastic utility component show that profile 5 has to be removed from the set of variables as well. This variable distorts modelling (high final gradient norm, non-convergence) using MMNL. On the basis of
these pre-examinations, the variables distance, closest school is a magnet school (dummy),Cs,
Vs, private school (dummy), profile 2, profile 3 and profile 4 (all dummies) seem to be most
promising and have to be considered for estimation and choice probabilities simulation. All three MMNL models have to be interpreted within an error components structure motivation, which is formally equivalent to random components structure and differs only concerning the interpretation of the utility function (Train, 2003, p.144). The three different model specifica-tions (MMNL 1-3) are due to testing for heterogeneity in population and possible substitution patterns. In other words: Which variables enter the stochastic utility part significantly. Sur-prisingly, the students tastes concerning the profiles do not vary. Pre-examination show mostly insignificant standard deviation for the profiles. This suggests a distinct discrimination of tastes concerning school profiles by the dummy specification. The results of the most promising model specifications can be found in table 2.
MNL MMNL1 MMNL2 MMNL3 V ariable E stimate S E t-test Estimate SE t-test Estimate SE t-test Estimate SE t-test dis mean -.700 .014 -48.28 -.726 .014 -51.44 -.899 .034 -26.35 -.798 .019 -40.05 Std. Dev. .274 .045 6.09 Cen tralit y Cs mean -.043* .031 -1.34 -.194 .021 -9.35 -.190 .028 -6.48 -.158 .026 -5.81 Std. Dev. .422 .040 10.40 .382 .039 9.65 Closest sc ho ol is a magnet mean -1.150 .1 55 -7.42 -1.090 .157 -6.93 -1.676 .236 -7.11 -1.384 .190 -7.32 sc ho ol (u niq u e profile) Std. Dev. Profile 2 mean .496 .163 3.04 .415 .108 3.84 .459 .134 3.41 .435 .122 3.53 (math/science core) Std. Dev. Profile 3 mean .095* .143 0.67 .222 .066 3.35 .2 00 .073 2.69 .180 .068 2.65 (languages) Std. Dev. Profile 4 mean 1.190 .127 9.35 .504 .107 4.72 .6 56 .119 5.48 .634 .115 5.49 (languages core) Std. Dev. Profile 5 mean .144* .115 1.26 (m usic/arts) Std. Dev. Sc ho ol siz e Vs mean .554 .049 11.31 .536 .047 11.24 .527 .056 9.42 .522 .055 9.57 Std. Dev. Authorit y resp onsible mean 1.010 .221 4.59 -.736 .319 -2.31 -.762 .380 -2.00 -.660* .367 -1.79 (=1, if priv ate sc ho ol) Std. Dev. 2.280 .320 7.14 2. 538 .402 6.2 9 2.358 .390 6.04 Log lik eliho o d -4641.13 -4846.02 -4800.74 -4813.57 Lik eliho o d ratio statistic 7775.29 7365.50 7456.06 7430.41 pseudo-R 2 .455 0.431 .436 .434 Correct p redicted observ ations in % 58.25 58.64 58.69 58.64 All v ariables are sign ifican t on .95 lev el, excep t * (non-signific an t) The n um b er of observ ations is 3704 for all mo dels. Lik eliho o d ratio test ( χ 2 ) MNL -409.78 319.22 344.88 MMNL1 -90.56 64.91 MMNL2 -25.66 T able 2: Estimation results
If we look at the four models we see that the coefficients of the spatial variables (dis, Cs and
closest school is a magnet school) are larger for the MMNL models than for the standard logit model. The evaluation of the profiles differs between the MNL and the mixed logit models while there is no remarkable difference between the three mixed logit models. The parameter for the school size is very similar over all four models. Authority responsible shows the most striking difference between MNL (positive sign) and MMNL (negative sign) specification.
The negative sign of distance indicates a decrease in utility with increasing commuting distance. MMNL2 discovers taste variation of students evaluating commuting distance. The negative sign for centralityCsmeans that, ceteris paribus, colleges closer to the city center have a higher utility
than those ones at the outskirts: it is most likely to assume that most individuals obtain high-est utility from the closhigh-est school. Nevertheless, for some individuals the school characteristics (profiles, authority for instance) of the closest school might not be desirable and they probably choose an alternative school. Mostly, this alternative school is not within walking or biking distance. The schools located near the city center are rather good accessible by public transport or car. Moreover, the high spatial density of school locations near the city center implicates a lot of alternatives within a given distance interval. So, usually students prefer colleges close to the city center. However, the specifications for which centrality enters the stochastic part show heterogeneity. Dependent on model specification, round 31-34 per cent of the population evaluate Cs positive. If so, schools located at the outskirts yield higher utility (high values of
Cs, see table 1 and figure 1). This is because students who prefer the closest school and who are
located at the outskirts gain highest utility from the closest outskirts school. As expected, all profiles increase utility, particularly the unique profiles (2 and 4) offered by magnet schools. The preferences for the profiles are ordered: The most preferred profile is ”languages core” (profile 4) followed by ”math/science core” (profile 2) and third ”languages” (profile 3). This order is independent from model specification. The variable, which indicates whether the closest school is a magnet school, shows the expected negative sign and enters significant for all specifications. As assumed the variable compensates unrealistic high utility due to linear distance measure for those students located very close to magnet schools.
The parameter of school size Vs is consistent over all model specifications. It was foreseeable
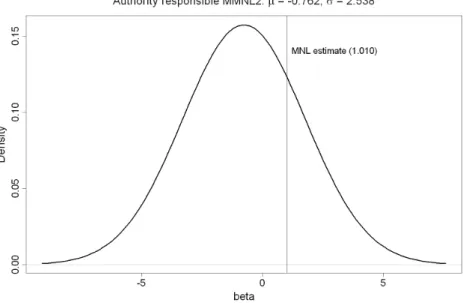
that the sign would be positive, since larger schools obtain scale effects (they offer more ex-tracurricular courses, for example) and the probability that a students application of enrollment will be rejected is lower than for smaller schools. The sign for authority responsible is positive for MNL specification. In contrast, for the MMNL specifications the sign is always negative. The standard deviation is quite huge (2.538 for example). It means that this parameter can take many values (the 95 per cent interval is [-4.94,3.41], and the 90 per cent is [-4.01,2.49]). This makes interpretation difficult to some extent. However, some information is given by this parameter. The mean is negative while 37-39 per cent of all students would evaluate private schools positive. This latent surplus could be conditional on the properties of most of the private schools, like confessional affiliation, elitist student community because of admission test and to some extent specific teaching conditions, which are different from public colleges (ecological sub-jects for instance). The majority of students regard these properties as repellent. According to this, the choice probability of a private school will be mostly lower than for a public school, es-pecially for those ones far away from students home. But table 1 indicates for the private school (St. Benno) an average commuting distance which is remarkable above the overall average. So, students are willing to seek private schools over a relatively broad geography. In contrast the MNL suggests all students evaluate private schools very positive (1.01) and therefore it neglects that some students dislike private schools. So MNL does not consider taste variation which is observable using MMNL (see figure 2).
Figure 2: Estimated normal distribution for the variable ”Authority responsible” of MMNL2
The substitution patterns that are implied by the models can be shown by an easy example. Suppose a private school ”C” offering profile 2 (math/science core) is introduced to a base situation consisting of
• a private school ”A” offering profile 3 (languages),
• a public school ”B” offering profile 3.
The MNL, because of the IIA property, implies that the new school C will draw proportionately from all both schools A and B offering profile 3. In contrast, the mixed logits predict that school C will draw more proportionately from school A than from school B. Using the estimates of MNL the ratio of choice probabilities of A and B is 2.746 for the base situation and the situation with three schools. Using MMNL1 with 10 draws we get a ratio of 1.378 for the base situation and 1.030 for the situation with three schools. If we compute the relative deviation between the two situations for both models this yields .523 for A and B using MNL and .458 for A and .275 for B using the MMNL. Since we want to map substitution patterns in future school network scenarios the MNL is not appropriate here. Although the MNL has a better goodness-of-fit. All three MMNL differ significantly (see table 2). MMNL2 will be used for simulation of scenarios in the next section, because it has best explanatory quality.
Our analysis reveals that the size of a school and its service in terms of offered profiles as well as spatial patterns (here: centrality) influence school choice, besides the known attributes as stated i the literature like racial composition, academic quality, sex, proximity and authority responsible (see section 2). Moreover, our results suggest that MMNL is appropriate to regard substitution patterns between schools.
5
Simulation of choice probabilities
The local school authority of Dresden decided in 2000 to close three colleges in 2008 due to low student numbers. In 2006 the decision has been made to establish three new school locations
in 2012 because of new college student number forecasts, which show a slight increase. In this section we utilize MMNL2 to simulate choice probabilities for three different scenarios: In 2004 -the year when -the survey was accomplished - -there are 20 colleges open (first scenario). In 2008, the second scenario, the colleges Joseph-Haydn, Fritz-L¨offler and Großzschachwitz will be closed. This yields a reduced choice set (17 colleges) for simulation. In the third scenario (2012) the new colleges B¨uhlau, Seidnitz and B¨urgerwiese will be opened (see fig. 1). So the choice set consists of 20 available schools in 2012. Although small scale data (block level) on student numbers and commuting distances are available, the choice probabilities for each scenario are simulated on district level for visualization purposes. No data is available for the surrounding districts of Dresden. Admittedly, there are no colleges located in the surrounding districts close to the city limit. So the simulated choice probabilities are expected to be realistic, since no colleges outside Dresden would attract students from within the city limits. We employ BIOSIM for simulation (Bierlaire, 2005). The number of draws is set to 1000 to derogate variance.
Figure 3: Scena rio 1 -2004
Figure 3 displays the simulated choice probabilities for 2004. Expectedly, districts located at the outskirts show high choice probabilities for just one particular college, which is the clos-est school location due to the generally long commuting distances to other college locations for these districts. This is Klotzsche College in the north and Cotta College in the west for instance. Districts located closer to the city center show a diversified choice probability pattern, because of significantly more schools within a given distance interval. It is noteworthy, that the districts in the south-east (north of the river Elbe) have a diversified choice pattern, too, although they are located at the outskirts. This is conditional on the lack of river crossings within this area and no college is located here. Due to missing ferries or bridges, the river has a spatially strong separating impact in this area. Comparing the choice probabilities of the two most south-eastern districts both sides the river, this impact becomes apparent. The closest bridge is located round 10 kilometers away from the south-eastern edge following the river toward the city center. At
this point exists access to a spatial cluster of colleges (for example: Martin-Andersen-Nex¨o,
Carl-Maria-von-Weber, Ev. Kreuzgymnasium, see fig. 1). This spatial characteristic leads to the observed diversified choice probabilities.
Besides these spatial distinctions of choice probabilities there are patterns observable, which are more alternative specific. For many districts there is a relatively high choice probability of Romain-Rolland College, which is a magnet school. This college is very attractive for many students throughout the city due to the combination of profile 3 and 4. The location close to the city center implies good accessibility, especially by public transport. Particularly, for the northern outskirts there is a remarkable choice probability of this college. The dummy variable which identifies the closest school as a magnet school yields the desired effect: the districts close to Romain-Rolland College do not show unrealistic high probabilities.
The most noticeable difference between scenario 1 and 2 (see figure 4) is the increase in choice
probability of Julius-Ambrosius-H¨ulße College for the districts in the south-east conditional
on the closure of Großzschachwitz College. A comparable phenomenon can be seen in the
south-east/central districts. Here, the closure of Fritz-L¨offler College leads to increased choice probabilities of Plauen and Vitzthum College. The shift in choice probability due to the closing of Joseph-Haydn College are not really discernible compared to the ones mentioned before. The location of Joseph-Haydn within a spatial cluster of several other colleges offering the same profile (Carl-Maria-von-Weber, Bertold-Brecht, for example) leads to only marginal changes in probabilities. The opening of B¨uhlau College in 2012 (see figure 5) results in a dramatic shift of probabilities in the eastern districts north of the river Elbe. In 2012 these districts show the same pattern like districts in the north and south-west outskirts. The probability of B¨urgerwiese College in the (south-) central districts and the probability of Seidnitz College (south of river Elbe) are less flashy but still well noticeable. All together, the most significant changes in choice probabilities occur in the south-east of Dresden, particular due to the closure of Großzschachwitz
Figure 4: Scena rio 2 -2008
Figure 5: Scena rio 3 -2012
Figure 6 displays the share of students for each college in the years 2004, 2008 and 2012. ”Shares” have to be interpreted as potential of students, since capacity is not considered. Therefore,
students will not be rejected attending a certain college.7 Unfortunately, there is no data
available about the actual shares. The local school authority provides the number of students attending a given school. But there is no distinction between students located in Dresden and students not located in Dresden. Moreover, the forecast of student numbers does not tell us about the proportion of college students. We approximate this proportion from our survey. For these two reasons we do not compare actual shares with those computed here.
Schools located in the city center exhibit a relatively high share of students due toCs and school
size (Marie-Curie) or combination of profiles (St. Benno, Romain-Rolland) as well as the relative large number of students located near the city center. For some colleges (Klotzsche, Pestalozzi, for example) the changing choice sets do not have a great impact, because they are located far away from areas affected by school closures/openings. It is striking, that the shares of the colleges
Julius-Ambrosius-H¨ulße, Hans-Erlwein, Vitzthum and Plauen are very fluctuant. The net gain
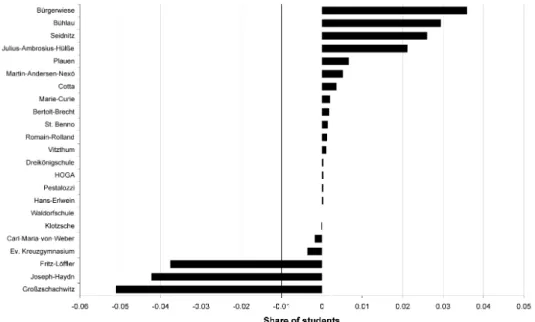
or loss of each college for the whole time span is given by figure 7. The colleges
Julius-Ambrosius-H¨ulße, Plauen, Cotta and Vitzthum gain student shares, because of the school closures in their
proximate surroundings. The increase of student shares for Marie-Curie and St. Benno is
conditional on the attractive location, while the gain of shares for Romain-Rolland College
is due to its combination of profiles. Colleges Cotta and Martin-Andersen-Nex¨o have gained
shares although colleges B¨urgerwiese and B¨uhlau have been opened within their surrounding.
This is due to size (Cotta) and profiles (Martin-Andersen-Nex¨o). In contrast to this, colleges
Ev. Kreuzgymnasium and Carl-Maria-von-Weber loose more students to the new colleges than they have gained from the closed ones. These two schools are located in the center close to the three new schools. They do not maintain large capacity nor do they offer unique profiles.
7
Figure 6: Sha re of attending students fo r scena rios 2004, 2008 and 2012
6
Conclusion
With declining student numbers school authorities are forced to close school locations accom-panied by changing choice sets for students. So it is worthwhile to know about the impacts on school choice behavior. As already stated in the literature we found that distance has the strongest influence on school choice. But our analysis yields significant influence of profiles, authority responsible, centrality and capacity on school choice as well. Unique profiles and school size cause a remarkable surplus in utility. Hence, a specialization on a certain subject (like languages) will increase choice probability. While competition rises with declining student numbers, the consequence of these results is to focus on specific profiles. However, from the point of view of educational policy it is questionable whether such development is desirable. By reason of changing choice sets over time it is important to model realistic substitution pat-terns. Therefore, we have used the flexible MMNL, which enables to analyse heterogeneity within population. Our analysis revealed significant taste variation for private schools, distance and centrality. The unobserved students preferences on the specific properties of private and public schools act as a nesting structure. Concerning distance and centrality there is taste vari-ation for some students due to the spatial patterns of the school locvari-ations.
It was foreseeable that the surrounding districts of closed or opened school locations show plainest changes in choice probabilities. Nevertheless, the scenario simulation detected changes in probability for more distant districts. The net gain and loss of student share for each college is associated with these results. Even colleges located far away from closed or opened colleges show a significant variation of student share over time. Thus, an approach which assumes each student chooses the closest school location is not appropriate for dynamic school network plan-ning.
In summary, school choice is strong influenced by spatial factors. Educational contents are more subordinate while still important. Future research determining school choice behavior should incorporate individual-specific data, particularly spatial dependencies of individuals, and school characteristics (alternative specific).
Figure 7: Net gain and loss in student share 2004 - 2012
7
Appendix
The simulated probabilities are computed as follows:
(1) Draw a value ofβ fromf(β|θ) and label itβr with superscript r = 1 referring to the first draw.
(2) Calculate Lis(βr) with this draw.
(3) Repeat steps 1 and 2R times and average the results as ˇPis = 1/R∗PRr Lis(βr).
ˇ
Pis is the unconditional probability used to calculate the simulated likelihood function. ˇPis is
strictly positive and an unbiased estimator of Pis by construction. Its variance decreases as
R increases. As Bierlaire (2003) recommended we set R = 1000. We use BIOGEME 1.4 for
estimation with implemented Unix’s pseudo random number generator. Other possible methods are Halton sequences and Modified Latin Hypercube Sampling. A deeper discussion is not
covered within this paper. Pˇis is smooth in θ and all variables and it sums to one over all
alternatives. So the simulated probabilities are inserted into the log-likelihood function to give a simulated log likelihood:
SLL= I X i=1 S X s=1 yislnPˇis (4)
whereyis= 1 if studentichooses schoolsand zero otherwise. The maximum simulated likelihood
estimator (MSLE) are the values ofβ andθ that maximize SLL by iteration. The properties of
this estimator are discussed in (Train, 2003, p.253-260). A trust-region algorithm (Conn et al., 2000) named BIO is used for optimization (Bierlaire, 2005). The number of students attending a given school within our choice-based sample do not represent the actual numbers. So we have to use the weighted exogenous sampling maximum likelihood (WESML) estimator to obtain consistent estimators for the MMNL. Since we do not consider alternative specific constants we use ESML for the MNL.
References
Alderman, H., Orazem, P., Paterno, E., 2000. School quality, school cost and the public/private school choice of low income households in Pakistan . The Journal of Human Resources 36 (2). Barthels, K., 2007a. Sind Privatschulen besser? Die Zeit 43, http://www.zeit.de/2007/43/C–
Privatschul–Info?page=all.
Barthels, K., 2007b. Wir leben Toleranz vor. Die Zeit 43, http://www.zeit.de/2007/43/C– Interview–Ev–Schule?page=all.
Becker, A., Ekholm, K., J¨acle, R., Muendler, M., 2005. Location choice and employment
de-cisions: A comparison of german and swedish multinationals. Review of World Economics 141 (4), 693–731.
Ben-Akiva, M., Lerman, S., 1985. Discrete choice analysis, theory and applications to travel demand. MIT Press, Cambridge, MA.
Bhat, C. R., 1997. A nested logit model with covariance heterogeneity. Transportation Research B 31, 11–21.
Bhat, C. R., 2000. Flexible Model Structures for Discrete Choice Analysis. Vol. 1 of Handbooks in Transport. Pergamon, Ch. 5, pp. 71–90.
Bhat, C. R., Gossen, R., 2004. A mixed multinomial logit model analysis of weekend recreational episode type choice. Transportation Research B 38 (9), 767–787.
Bierlaire, M., 2003. BIOGEME: a free package for the estimation of discrete choice models. In: 3rd Swiss Transport Research Conference.
Bierlaire, M., 2005. An introduction to BIOGEME (Version 1.4).
Borgers, A., Oppewal, H., Ponj´e, M., Timmermans, H., 1999. Assessing the impact of school
marketing: conjoint choice experiments incorporating availablility and substitution effects. Environment and Panning A 31, 1949–1964.
Brinkmann, P., Leslie, L., 1987. Student price response in higher education. Journal of Higher Education 58 (2), 181–204.
Brownstone, D., Train, K. E., 1999. Forecasting new product penetration with flexible substi-tution patterns. Journal of Econometrics 89, 109–129.
Conn, A., Gould, N., Toint, P., 2000. Trust region methods. In: MPS-SIAM Series on Optimiza-tion. SIAM.
Contreras, D., 2002. Vouchers, school choice and the access to higher education. In: Economic Growth Center Discussion Papers. Yale University.
Dow, J. K., Endersby, J. W., 2004. Multinomial probit and multinomial logit, a comparison of choice models for voting research. Electoral Studies 23, 107–122.
Drezner, Z., Wesolowsky, G., Drezner, T., 2 1998. On the logit approach to competitive facility location. Journal of Regional Science 38, 313–327.
Figlio, D., Stone, J., 1997. School choice and student performance, are private schools really better? Vol. 1141-97 of Discussion paper. Institute for Research on Poverty.
Gabriel, S., Rosenthal, S., 1989. Household location and race: Estimates of a multinomial logit model. The Review of Economics and Statistics 71 (2), 240–249.
Glazerman, S., 1997. Determinants and consequences of parental school choice, unpublished working paper, Harris School of Public Policy, University of Chicago.
Goldring, E., Bauch, P., 1995. Parental involvement and school responsiveness: Facilitating the home-school connection in schools of choice. Educational Evaluation and Policy Analysis 17, 1–22.
Gottlieb, P. D., Joseph, G., 2006. College-to-work migration of technology graduates and holders of doctorates within the United States. Journal of Regional Science 46 (4), 627–659.
Greene, W., 2003. Econometric Analysis, 5th Edition. Pearson Education, New Jersey.
Hansen, E., 1987. Industrial location choice in Sao Paulo, Brazil. A nested logit model. Regional Science and Urban Economics 17, 89–108.
Hastings, J., Kane, T., Staiger, D., 2005. Parental preferences and school competition, evidence from a public school choice program. Tech. rep., National Bureau of Economic Reserach. Haynes, K., Good, D., Dignan, T., 1988. Discrete spatial choice and the axiom of independence
from irrelevant alternatives. Socio-Economic Planning Science 22 (6), 241–251.
Hensher, D. A., Greene, W. H., 2003. The mixed logit model: The state of practice. Transporta-tion 30 (2), 133–176.
Hoxby, C. (Ed.), 2003. The economics of school choice. University of Chicago Press.
Hunt, J., Teply, S., 1993. A nested logit model of parking location choice. Transportation Re-search - B 27 (4), 253–265.
Kane, J., Spizman, L., 1994. Race, financial aid awards and college attendance, parents and geography matter. American Journal of Economics and Sociology 53 (1), 85–95.
Kleitz, B., Weiher, G., Tedin, K., Matland, R., 1998. Choices, charter schools and household preferences. Social Science Quarterly 81 (3), 846–854.
Lankford, H., Wyckoff, J., 2000. The effect of school choice and residential location on the racial segregation of students, working Paper.
Mahr-George, H., 1999. Determinanten der Schulwahl beim ¨Ubergang in die Sekundarstufe 1.
McFadden, D., 1973. Conditional logit analysis of quantitative choice behaviour. In: Zaremmbka, P. (Ed.), Frontier of econometrics. Academic Press, New York.
Montgomery, M., 2002. A nested logit model of the choice of a graduate business school. Eco-nomics of Education Review 21 (5), 471–480.
M¨uller, S., 2006. Anaylse des Verkehrsmittel- und Schulwahlverhaltens Dresdner Gymnasiasten.
In: Aurada, K., R¨odel, R. (Eds.), Kooperation und Integration. Vol. 36. pp. 145–155.
M¨uller, S., 2008. Dynamic School Netowrk Planning in Urban Areas. Vol. 5 of Urban and Spatial
Planning. LIT, Berlin.
M¨uller, S., Haase, K., 2009. Exposing unobserved spatial similarity: Evidence from german
school choice data. Geographical Analysis (in review).
M¨uller, S., Haase, K., Kless, S., 2009. A multiperiod school location planning approach with
free school choice. Environment and Planning A 41 (12), 2929–2945.
M¨uller, S., Tscharaktschiew, S., Haase, K., 2008. Travel-to-school mode choice modelling and
patterns of school choice in urban areas. Journal of Transport Geography 16 (5), 342–357, working Paper.
Nguyen, A., Taylor, J., 2003. Post-high school choices: New evidence from a multinomial logit model. Population Economics 16 (2), 278–306.
Peterson, P., Hassel, B. (Eds.), 1998. Learning from school choice. Brookings Institution, Wash-ington, D.C.
Rouwendal, J., Meijer, E., 2001. Preferences for housing, jobs, and commuting: A mixed logit analysis. Journal of Regional Science 41 (3), 475–486.
Schneider, T., 2004. Der Einfluss des Einkommens der Eltern auf die Schulwahl. Vol. 446 of Discussion Papers. DIW, Berlin.
Smith, M. D., 2005. State dependence and heterogeneity in fishing location choice. Journal of Environmental Economics and Management 50, 319–340.
Speiser, I., 1993. Determinanten der Schulwahl, Privatschulen - ¨offentliche Schulen. Vol. 11 of
Europ¨aische Hochschulschriften 513, P¨adagogik. Lang, Frankfurt a.M.
SEIT 1998 SIND FOLGENDE DISKUSSIONSBEITRÄGE ERSCHIENEN:
1/1998 Röhl, Klaus-Heiner: Gewerbeflächenmanagement in Agglomerationsräu-men - Institutionelle Lösungsansätze und die Einflußmöglichkeiten der Re-gionalplanung
2/1998 Bröcker, Johannes und Frank Richter: Entwicklungsmuster ostdeutscher Stadtregionen nach 1945
3/1998 Bröcker, Johannes: Welfare Effects of a Transport Subsidy in a Spatial Price Equilibrium
4/1998 Bröcker, Johannes: Spatial Effects of Transeuropean Networks: preliminary results from a spatial computable general equilibrium analysis
5/1998 Bröcker, Johannes: Spatial Effects of Transport Infrastructure: The Role of Market Structure
1/1999 Bröcker, Johannes und Martin Schneider: How does Economic development in Eastern Europe affect Austria’s regions? A multiregional general equi-librium framework
2/1999 Richter, Frank: Ökonomische Hintergründe der Verwaltungsreform von 1952 in der DDR
1/2000 Röhl, Klaus-Heiner: Die Eignung der sächsischen Agglomerationsräume als Innovations- und Wachstumspole für die wirtschaftliche Entwicklung des Landes
2/2000 Röhl, Klaus-Heiner: Der Aufbau der ostdeutschen Infrastruktur und sein Beitrag zur wirtschaftlichen Entwicklung in Sachsen
3/2000 Kummer, Sebastian; Mating, Anette; Käsbauer, Markus; Einbock, Marcus: Franchising bei Verkehrsbetrieben
5/2000 Röhl, Klaus-Heiner: Saxony’s Capital Dresden – on the Way to become East-ern Germany’s first “Innovative Milieu”?
6/2000 Schramm, Hans-Joachim: Electronic Commerce im Lebensmitteleinzelhan-del - Auswertung einer Konsumentenbefragung im Großraum Dresden 1/2001 Schramm, Hans-Joachim; Veith, Elisabeth: Schwerlasttransport auf
deut-schen Straßen, Ergebnisse einer Befragung deutscher Schwerlasttrans-portunternehmen
2/2001 Schramm, Hans-Joachim; Eberl, Katharina: Privatisierung und Going Public von staatlichen Eisenbahnunternehmen - Versuch eines adaptiven Ver-gleichs zwischen Japan und Deutschland
1/2002 Kummer, Sebastian; Schmidt, Silvia: Methodik der Generierung und An-wendung wertorientierter Performance-Kennzahlen zur Beurteilung der Entwicklung des Unternehmenswertes von Flughafenunternehmen
2/2002 Wieland, Bernhard: Economic and Ecological Sustainability - The Identity of Opposites?
1/2003 Freyer, Walter; Groß, Sven: Tourismus und Verkehr - Die Wechselwirkun-gen von mobilitätsrelevanten Ansprüchen von touristisch Reisenden und Angeboten (touristischer) Transportunternehmen
2/2003 Stopka, Ulrike; Urban, Thomas: Implikationen neuer Vertriebs- und Distri-butionsformen auf das Customer Relationship Management und die Gestal-tung von virtuellen Marktplätzen im BtoC-Bereich
1/2004 Hoppe, Mirko; Schramm, Hans-Joachim: Use of Interorganisational Systems - An Empirical Analysis
2/2004 Wieland, Bernhard; Seidel, Tina; Matthes, Andreas; Schlag, Bernhard: Transport Policy, Acceptance and the Media
2/2005 Stopka, Ulrike; Urban, Thomas: Erklärungsmodell zur Beurteilung der be-triebswirtschaftlichen Vorteilhaftigkeit des Kundenbeziehungsmanage-ments sowie Untersuchung zur Usability von Online-Angeboten im elektro-nischen Retailbanking
3/2005 Urban, Thomas: Medienökonomie
4/2005 Urban, Thomas: eMerging-Media: Entwicklung der zukünftigen Kommunika-tions- und Medienlandschaft
1/2006 Wieland, Bernhard: Special Interest Groups and 4th Best Transport Pricing
2/2006 Ammoser, Hendrik; Hoppe, Mirko: Glossar Verkehrswesen und Verkehrs-wissenschaften
1/2007 Wieland, Bernhard: Laudatio zur Verleihung der Ehrendoktorwürde an Herrn Prof. Dr. rer. pol. habil. Gerd Aberle
2/2007 Müller, Sven; Kless, Sascha: Veränderung der leistungsabhängigen Schwer-verkehrsabgabe in Abhängigkeit der Streckenbelastung
1/2008 Vetter, Thomas; Haase, Knut: Alternative Bedienformen im ÖPNV – Akzep-tanzstudie im Landkreis Saalkreis
2/2008 Haase, Knut; Hoppe, Mirko: Standortplanung unter Wettbewerb – Teil 1: Grundlagen
3/2008 Haase, Knut; Hoppe, Mirko: Standortplanung unter Wettbewerb – Teil 2: Integration diskreter Wahlentscheidungen
1/2009 Günthel, Dennis; Sturm, Lars; Gärtner, Christoph: Anwendung der Choice-Based-Conjoint-Analyse zur Prognose von Kaufentscheidungen im ÖPNV 2/2009 Müller, Sven: A Spatial Choice Model Based on Random Utility