NREL is a national laboratory of the U.S. Department of Energy Office of Energy Efficiency & Renewable Energy
Energy-Efficient Supermarket
Heating, Ventilation, and
Air Conditioning in Humid
Climates in the United States
J. Clark
NREL is a national laboratory of the U.S. Department of Energy Office of Energy Efficiency & Renewable Energy
Operated by the Alliance for Sustainable Energy, LLC
This report is available at no cost from the National Renewable Energy Laboratory (NREL) at www.nrel.gov/publications.
National Renewable Energy Laboratory 15013 Denver West Parkway
Energy-Efficient Supermarket
Heating, Ventilation, and
Air Conditioning in Humid
Climates in the United States
J. Clark
National Renewable Energy Laboratory
Prepared under Task No. ARCB.1102
Technical Report
NOTICE
This report was prepared as an account of work sponsored by an agency of the United States government. Neither the United States government nor any agency thereof, nor any of their employees, makes any warranty, express or implied, or assumes any legal liability or responsibility for the accuracy, completeness, or usefulness of any information, apparatus, product, or process disclosed, or represents that its use would not infringe privately owned rights. Reference herein to any specific commercial product, process, or service by trade name, trademark, manufacturer, or otherwise does not necessarily constitute or imply its endorsement, recommendation, or favoring by the United States government or any agency thereof. The views and opinions of authors expressed herein do not necessarily state or reflect those of the United States government or any agency thereof.
This report is available at no cost from the National Renewable Energy Laboratory (NREL) at www.nrel.gov/publications.
Available electronically at http://www.osti.gov/scitech
Available for a processing fee to U.S. Department of Energy and its contractors, in paper, from:
U.S. Department of Energy
Office of Scientific and Technical Information P.O. Box 62
Oak Ridge, TN 37831-0062 phone: 865.576.8401 fax: 865.576.5728
email: mailto:reports@adonis.osti.gov
Available for sale to the public, in paper, from: U.S. Department of Commerce
National Technical Information Service 5285 Port Royal Road
Springfield, VA 22161 phone: 800.553.6847 fax: 703.605.6900
Acknowledgments
This project was made possible with American Recovery and Reinvestment Act of 2009 funds. Thanks to Arah Schuur and Glenn Schatz of the U.S. Department of Energy Building
Technologies Office for their support of the project.
Knowledge of current heating, ventilation, and air conditioning (HVAC) industry best practices was made possible through generous input from designers and manufacturers who provided recommendations regarding HVAC design and control based on their extensive experience with supermarket design, construction, and operation. This includes Phillip Walker, Consolidated Energy Solutions; Ethan Kinsey, Trane; Steve Brown, LC Systems; Fuoad Parvin, Halton; Tim Johnson and Chuck Reis, CTA Group; Hugh Henderson, CDH Energy; and Dustin Lilya, DC Engineering.
At the National Renewable Energy Laboratory (NREL), Eric Kozubal and Ian Doebber provided valuable technical input, and Adam Hirsch supervised the project. Also, we extend thanks to those who supported the detailed modeling of the different HVAC systems within a supermarket whole-building simulation. This includes Thierry Nouidui, Michael Wetter, and David
Lorenzetti, Lawrence Berkeley National Laboratory; Marvin Gui, Consolidated Energy Solutions; and Eric Bonnema and Edwin Lee, NREL.
Special thanks to those who reviewed this report and provided helpful feedback: Ren Anderson, Eigen Energy, LLC; Jay Burch; and Jason Woods, Ian Doebber, and Adam Hirsch, NREL. Also, we would like to thank the HVAC manufacturers who contributed their performance data to the project, including Trane, Consolidated Energy Solutions, and AIL Research.
Lastly, thanks to high-level contributors to initial phases of the project, including John Murphy, Trane, and Stanley Mumma, Pennsylvania State University.
List of Acronyms
ASHRAE American Society of Heating, Refrigerating and Air-Conditioning Engineers
CIBSE Chartered Institution of Building Services Engineers CBP DOE Commercial Buildings Partnership
cfm cubic feet per minute—unit often used to quantify volumetric airflow rates COP coefficient of performance = cooling energy delivered/power input
DBT dry-bulb temperature
DCKV demand-controlled kitchen ventilation—strategy for ventilating kitchens that modulates exhaust rates based on equipment in use
DOE U.S. Department of Energy
DOAS dedicated outdoor air system—an HVAC strategy that conditions outdoor air in a separate system from recirculating air
DPT dew point temperature—temperature at which water in air condenses for given water content in air
DX direct expansion—means of cooling air through refrigeration cycle
EA exhaust air
EEM energy efficiency measure
EER energy efficiency ratio = cooling output of a device/electrical power input (Btu/Wh)
HEH high-efficiency hood—a kitchen hood that captures exhaust air more efficiently
HVAC heating, ventilation and air conditioning
LD liquid desiccant—hygroscopic material that dehumidifies air with which it is in contact
LT low temperature—refers to cooling devices with suction DPT < 10ºF
MAS mixed air system
MAU make-up air unit—device used to provide air to counteract exhaust
MBL Modelica Buildings Library—library of building-related Modelica models created by Lawrence Berkeley National Laboratory
MSL Modelica Standard Library—standard library included with all software packages that implement the Modelica language
MT medium temperature—refers to cooling devices with suction DPT > 10ºF MX abbreviation used to designate mixed air condition on psychrometric
charts
NREL National Renewable Energy Laboratory
OA outdoor air
RA return air
RH relative humidity—ratio of moisture content to saturated moisture content
WADW wrap-around desiccant wheel- a cooling device that operates by passing air through one side of a desiccant wheel, then a cooling coil, then the other side of the desiccant wheel, also called the Cromer Cycle
WAHP wrap-around heat pipe—a cooling device that operates by passing air through one side of a heat pipe heat exchanger, then a cooling coil, then the other side of the heat pipe heat exchanger
Executive Summary
Supermarkets are energy-intensive buildings that consume the greatest amount of electricity per square foot of building of any building type in the United States and represent 5% of total U.S. commercial building primary energy use (EIA 2005). Refrigeration and heating, ventilation, and air-conditioning (HVAC) systems are responsible for a large proportion of supermarkets’ total energy use. These two systems sometimes work together and sometimes compete, but the performance of one system always affects the performance of the other.
A wide variety of solutions are currently available that meet the HVAC needs of supermarkets, but the effects of these solutions on energy use and costs are not fully understood. For example, there are a number of energy-saving options for dehumidification in supermarkets. There may also be new HVAC approaches that can offset energy use resulting from larger food preparation areas and the proliferation of superstores that combine general merchandise and food sales. To better understand these challenges and opportunities, the Commercial Buildings team at the National Renewable Energy Laboratory investigated several of the most promising strategies for providing energy-efficient HVAC for supermarkets and quantified the resulting energy use and costs using detailed simulations. This research effort was conducted on behalf of the U.S. Department of Energy (DOE) Commercial Building Partnerships (CBP) (Baechler et al. 2012; Parrish et al. 2013; Antonopoulos et al. 2014; Hirsch et al. 2014). The goal of CBP was to reduce energy use in the commercial building sector by creating, testing, and validating design concepts on the pathway to net zero energy commercial buildings. Several CBP partners owned or operated buildings containing supermarkets and were interested in optimizing the energy efficiency of supermarket HVAC systems in hot-humid climates. These partners included Walmart, Target, Whole Foods Market, SUPERVALU, and the Defense Commissary Agency. Simulations were performed for six climate zones in the United States with large humidity loads, where advanced HVAC strategies are likely to show the greatest benefit. Accordingly, the research focused on advanced approaches for energy-efficient dehumidification. This report targets the supermarket design team trying to lower operating costs through efficient HVAC design. It specifically targets design teams that use energy modeling to understand the energy impacts of different design decisions and the interactions between the HVAC and refrigeration systems. Building owners will also be interested in the high-level results comparing different approaches. This report can be thought of as an extension to the energy modeling done for the DOE-funded ASHRAE 50% Advanced Energy Design Guide for Grocery Stores
(www.ashrae.org/freeaedg), which provides guidance to achieve 50% whole building energy savings through proven efficiency measures across all building systems.
Methods
With these expanded capabilities, NREL simulated 23 different HVAC solutions for each of the six climates, including demand-controlled kitchen ventilation (DCKV); improved kitchen hoods and outdoor air (OA) delivery; dedicated outdoor air systems (DOAS); and enhanced
dehumidification and air-conditioning equipment.
Objectives
For this research, NREL pursued five objectives:
• Demonstrate the use of recently enhanced building-integrated HVAC modeling capabilities and explain their benefit for modeling building energy use.
• Evaluate and assess the energy impacts of using advanced exhaust equipment in supermarket kitchens.
• Quantify and compare the energy impacts of various methods for delivering and conditioning OA.
• Determine the advantages and disadvantages of using novel HVAC systems to condition supermarkets, with a special emphasis on dehumidification.
• Understand and quantify the interactions between the various energy efficiency measures (EEMs), such as the combined effects of reducing humidity in the refrigerated aisles, adding a DOAS unit, and using high-efficiency hoods (HEHs).
Scope
NREL investigated 23 HVAC solutions, which are combinations of three EEMs: reduced kitchen exhaust, improved delivery of OA, and advanced dehumidification equipment. The three EEMs are explained in detail in Chapter 3. The EEMs and candidate solutions included:
• Reduced ventilation requirements:
o A DCKV strategy that uses sensors to detect activity in the kitchen and then automatically adjusts the exhaust flow rates to better meet occupants’ needs o An approach that combines DCKV with HEHs to reduce the required exhaust
flow to less than that of the DCKV strategy alone. • Improved OA delivery and conditioning strategies:
o A make-up air unit (MAU) in the kitchen that provides air to counteract the exhaust flow rates from the kitchen
o Interior dehumidifiers working in conjunction with a reduced-capacity main rooftop unit (RTU) that brings in unconditioned air and provides some dehumidification before supplying it to the space
o A DOAS unit pretreating OA before supplying it to the return of a main RTU o A DOAS unit in full dual-path configuration that delivers conditioned OA directly
• Advanced dehumidification and air-conditioning systems: o Variable capacity direct-expansion (DX) systems o Liquid desiccant systems
o Solid desiccant systems
o Adaptable DX-based systems with advanced controls.
Results
In general, analysis results demonstrate that significant energy savings are possible with
advanced HVAC strategies in supermarkets. The best performing systems demonstrated savings of more than 50% of HVAC energy and energy costs across climates, as well as more than 30% of combined HVAC and refrigeration energy and costs. Different types of systems and strategies with a range of associated initial costs were modeled and shown to save energy and operating costs in many instances. NREL identified three promising EEMs: reduction of exhaust
requirements (EEM 1), improvement of OA delivery method (EEM 2), and improved dehumidification systems (EEM 3). See details about the results in Chapter 4.
Preliminary investigations showed that inclusion of an MAU is highly recommended in all climates studied. Simulations showed a 13%–46% savings in HVAC site energy (energy consumed at the building) for the Sales and Service Zones in the climates studied and a 33%– 46% savings in HVAC energy costs.
Reduction of Exhaust Requirements (Energy Efficiency Measure 1)
EEM 1 investigations showed that inclusion of a DCKV system in conjunction with HEHs can result in 11%–16% savings over the baseline MAU strategy in HVAC site energy for the Sales and Service Zones in the climates studied and 11%–13% savings in HVAC energy costs. Figure i shows the savings calculated for refrigeration and HVAC site energy and energy costs using a DCKV strategy alone or in conjunction with HEHs. In all cases, an MAU was used to deliver air to the kitchen to counteract exhaust flows. The combined strategy was found to save from 5% of combined refrigeration and HVAC energy in hot-humid climates to 10% in cold-humid climates. HEHs made more of an impact in temperate-humid climates than in very hot or very cold
Figure i. Calculated energy savings with a DCKV scheme and with DCKV in conjunction with HEHs Improvement of Outdoor Air Delivery Method (Energy Efficiency Measure 2)
EEM 2 investigations concluded that advanced OA delivery strategies, such as Pretreatment (“pre-treat”), DOAS, and Interior Dehumidifiers provided significant energy savings in the warmest climates but not in cooler climates. Savings over the baseline MAU strategy of up to 25% in combined refrigeration and HVAC site energy were calculated for the warmest climate studied, as well as savings of up to 47% of HVAC site energy and energy costs for the best performing systems.
The savings in energy consumption and energy costs for the Pre-Treat, DOAS, and Interior Dehumidifier strategies are shown in Figure ii. In all cases, an MAU was used to counteract kitchen exhaust flows and the baseline kitchen exhaust flow was assumed (no DCKV or HEH). Combined energy savings ranged from zero in cold-humid climates up to 25% for the Pre-Treat option in hot-humid climates.
Figure ii. Calculated energy and cost savings with improved OA delivery Improved Dehumidification Systems (Energy Efficiency Measure 3)
The final EEM was the use of novel dehumidification systems to help meet the conditioning
needs of supermarkets. EEM 3 investigations demonstrated that even greater savings across all
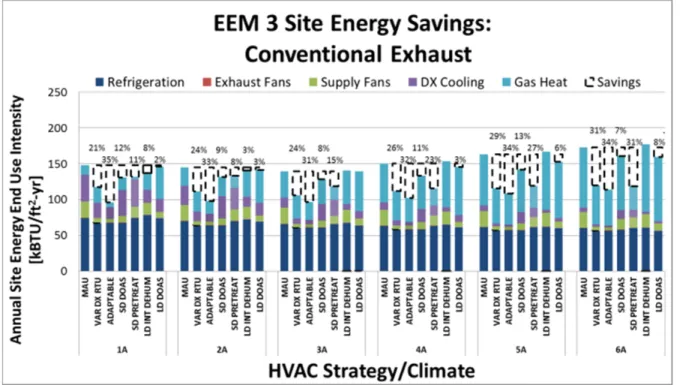
climates are available with advanced HVAC systems focused on dehumidification. For the Service and Sales Zones, we calculated total refrigeration and HVAC site energy savings of 31%–35% across all climates studied, 30%–36% combined refrigeration and HVAC energy cost savings, 49%–61% HVAC site energy savings, and 56%–62% HVAC cost savings.
As shown in Figure iii, site energy and energy cost savings of 30% or more of the total Service and Sales Zone HVAC and refrigeration energy costs were achieved with the advanced HVAC systems that incorporated dehumidification strategies. Again, these calculations were made assuming use of a kitchen MAU unit and baseline exhaust flows.
Figure iii. Calculated energy savings with improved OA delivery
In general, the calculations predicted that desiccant systems would perform best in colder
climates where overcooling is detrimental, and DX-based systems were clear winners in warmer climates where additional cooling used for dehumidification could be used for sensible cooling. The Adaptive Multi-Path System and the Variable Capacity DX RTU saved a large portion of the HVAC energy in cold climates as well, as did the solid desiccant system in Pre-Treat configuration.
Conclusions
We conducted a total of 138 detailed simulations that investigated a variety of strategies for energy-efficient HVAC solutions for U.S. supermarkets. These solutions represent several different levels of complexity and associated initial costs. The best performing solutions were
calculated to operate with more than 56% HVAC energy savings across all humid climates in the United States.
In this report, we also include a detailed procedure for conducting advanced supermarket energy
analysis. We hope that the information provided here will result in more informed decisions about energy-efficient supermarket HVAC design and equipment selection and expand the frontiers of supermarket energy modeling.
Table of Contents
1 Introduction and Objectives ... 1
1.1 Objectives ... 2
1.2 Structure of the Report ... 2
2 Supermarket Energy Use ... 3
2.1 Overall Supermarket Energy Intensity ... 3
2.2 Breakdown of Supermarket Energy Use ... 4
2.3 Drivers of Supermarket HVAC/Refrigeration Energy Use ... 4
2.3.1 Sensible Loads ... 4
2.3.2 Latent Loads ... 5
2.3.3 Exhaust and Ventilation Requirements ... 7
3 Project Scope ... 8
3.1 Reducing Exhaust Air Requirements ... 8
3.2 Improvement in Outdoor Air Distribution and Delivery ... 8
3.3 Advanced Dehumidification Systems ... 12
3.3.1 Baseline Direct Expansion System ... 12
3.3.2 Improved Mixed Air Systems ... 13
3.3.3 Interior Dehumidifiers in Refrigerated Case Zone ... 15
3.3.4 Dedicated Outdoor Air Systems ... 17
3.4 Experimental Matrix ... 19
4 Summary of Results ... 22
4.1 Comparison of Alternative Baselines ... 22
4.2 Energy Efficiency Measure 1: Exhaust Reduction Strategies ... 24
4.3 Energy Efficiency Measure 2: Outdoor Air Delivery Strategies ... 26
4.4 Energy Efficiency Measure 3: Improved Dehumidification Systems ... 29
4.5 Energy Efficiency Measure 1 + Energy Efficiency Measure 3: Improved Dehumidification Systems With Reduced Exhaust ... 31
4.6 Price Points for Desired Payback Periods ... 31
4.7 Conclusion ... 34
References ... 36
Appendix A. Modeling Methodology and Validation ... 40
Appendix B: Protocol or Co-Simulating EnergyPlus and External Program ... 57
Appendix C: System Model Validation ... 74
Appendix D. EnergyPlus-Modelica Comparison ... 82
List of Figures
Figure 1. OA distribution schemes ... 11
Figure 2. Baseline system psychrometric processes and system schematic ... 12
Figure 3. Adaptive Multi-Path System psychrometric processes and system schematic ... 15
Figure 4. LD interior dehumidifier ... 16
Figure 5. DX interior dehumidifier ... 16
Figure 6. Psychrometric process and system schematic for DX DOAS strategy ... 17
Figure 7. Psychrometric processes and system schematic for LD DOAS system ... 18
Figure 8. Psychrometric processes and system schematic for condenser heat-regenerated SD wheel DOAS strategy ... 19
Figure 9. Site energy comparison for three alternative baseline systems ... 23
Figure 10. Energy cost comparison for three alternative baseline systems ... 23
Figure 11. Source energy comparison for three alternative baseline systems ... 24
Figure 12. Site energy savings calculated with reduced exhaust strategies ... 25
Figure 13. Energy cost savings calculated with reduced exhaust strategies ... 25
Figure 14. Source energy savings calculated with reduced exhaust strategies ... 26
Figure 15. Site energy savings with four means of conditioning OA supplied to Sales Zone ... 27
Figure 16. Energy cost savings with four means of conditioning OA supplied to Sales Zone ... 28
Figure 17. Source energy savings with four means of conditioning OA supplied to Sales Zone ... 28
Figure 18. Site energy savings with advanced dehumidification systems ... 29
Figure 19. Energy cost savings with advanced dehumidification systems ... 29
Figure 20. Source energy savings with advanced dehumidification systems ... 30
Figure A1. Exhaust and OA supply schedules for baseline operation ... 41
Figure A2. Exhaust and OA supply schedules for DCKV schedule ... 42
Figure A3. Exhaust and OA air supply schedules for DCKV strategy with HEHs ... 43
Figure A4. Rendering of supermarket building in EnergyPlus ... 49
Figure A5. Designation of HVAC zones within supermarket ... 50
Figure C1. Comparison of modeled and measured data for Adaptive Multi-Path System ... 75
Figure C2. Comparison of modeled and measured space DBTs and DPTs ... 75
Figure C3. Specifications and operating conditions for tested absorber and regenerator ... 76
Figure C4. Comparison of absorber model and laboratory data showing good agreement ... 77
Figure C5. Discrepancy between measured and modeled temperature in three fluids of the absorber ... 77
Figure C6. Discrepancy between modeled and measured outlet temperatures of three fluids. Error bars represent precision of measuring instruments. ... 78
Figure C7. Comparison between manufacturer’s software and model prediction of compressor power ... 79
Figure C8. Comparison between manufacturer’s software and model prediction of moisture removal ... 80
Figure C9. Comparison between manufacturer’s software and model prediction of temperature change across system ... 80
Figure C10. Comparison between manufacturer’s software and model prediction of fan power ... 81
Figure D1. Cumulative DX coil electricity modeled with two programs ... 84
Figure D2. Gas use modeled with two simulation programs ... 84
Figure D3. Supply fan power use modeled with two simulation programs ... 85
Figure D4. Typical control of space DBT as modeled with Modelica, showing cooling SP and heating SP with night setback and fluctuation of space temperature ... 85
Figure D5. Space DPT throughout the year as predicted by Modelica simulation ... 86
Figure E1. WAHP system schematic and psychrometric processes ... 87
Figure E2. WADW system schematic and psychrometric processes ... 89
Figure E3. WAHP DOAS psychrometric processes and system schematic ... 90
List of Tables
Table 1. Energy Use Intensity, Including Both Gas and Electric (left) and Electricity Use Intensity (right)
by Building Activity (EIA 2005) ... 3
Table 2. Breakdown of Electrical Energy by End Use From Various Sources ... 4
Table 3. Climate Zones and Representative Cities ... 20
Table 4. System Combinations Considered in the Study ... 21
Table 5. Price Points for 3- and 5-Year Payback Periods for Climate Zones 1A-3A ... 33
Table 6. Price Points for 3- and 5-Year Payback Periods for Climate Zones 4A-6A ... 34
Table A1. Sizing and Model Information for HVAC Solutions Studied ... 45
Table A2. Occupancy and Load Design Values ... 50
Table A3. Thermal Properties Assumed for Building Envelope ... 51
Table A4. Window-Wall Ratio for Simulated Building Walls ... 51
Table A5. Infiltration Assumptions for Simulated Building ... 51
Table A6. SPs in Dry Goods and Refrigerated Sections of Sales Zone ... 54
1 Introduction and Objectives
This research project was conducted as part of the U.S. Department of Energy’s (DOE) Commercial Buildings Partnerships, a public-private, cost-shared initiative that demonstrated cost-effective, replicable ways to achieve dramatic energy savings in commercial buildings. CBP aimed to reduce energy use by 50% in new construction and 30% in existing buildings versus minimum code requirements set by ASHRAE Standard 2004 (or Appendix G of 90.1-2007), which were the applicable versions when CBP began. Companies and organizations, selected through a competitive process, teamed with DOE, national laboratory staff, and experts from the private sector who provided technical expertise to explore energy-saving ideas and strategies that were applied to specific building projects and that could be replicated across the market. The work presented here, conducted by the Commercial Buildings group at the National Renewable Energy Laboratory (NREL), focuses on reducing energy use in supermarkets.
Supermarkets are energy-intensive buildings. Also, their design, layout, and associated energy use patterns are rapidly evolving due to the increasing size of prepared food areas and new HVAC and refrigeration systems entering the market. Therefore, supermarkets present many opportunities for improvement from an energy standpoint. Thanks to the work of several
researchers in the last few decades, discussed below, we understand that supermarkets operate in a way that is quite different from other building types and require unique heating, ventilation, and air-conditioning (HVAC) equipment and strategies. However, the net effect of the complex interactions of the various systems present in supermarkets on overall energy use is less
understood. This type of analysis requires either construction of actual supermarkets employing the latest technologies, or detailed and original modeling performed at a level of sophistication not usually employed in building energy research.
Modeling of supermarkets must consider dynamic interaction of refrigeration equipment with the HVAC system, movement of air throughout the building, and HVAC systems that often are not included in standard software libraries. For these reasons, a great deal of extant research is limited to studying single phenomena (e.g., use of desiccant air conditioners in supermarkets) and uses simple modeling assumptions that allow for simulation of the building in a reasonable time at the expense of some accuracy (e.g., an assumption of constant kilowatt hours per ton of cooling in a dedicated outdoor air [DOAS] system). Recent developments in building simulation science allow for the inclusion of novel HVAC systems in DOE’s EnergyPlus building
simulation tool via co-simulation with an external program. This method allows a variety of energy efficiency measures (EEMs) to be studied and the interaction of building-related EEMs and HVAC-related EEMs with the refrigeration equipment to be understood more thoroughly. To that end, we studied a series of EEMs in a building chosen to be representative of the current U.S. supermarket building stock. In this modeling study, we reviewed the most advanced HVAC equipment available to supermarkets, the most advanced kitchen exhaust equipment, and the variety of best practices gathered from interviews with industry professionals. We hope that the results will provide building owners, designers, and researchers with more quantitative
understanding of different approaches to achieving energy-efficient supermarket HVAC, and that the simulation procedures herein help extend the frontier of building energy simulation.
1.1 Objectives
Specifically, we pursued five objectives in this work:
• Demonstrate the use of recently enhanced building-integrated HVAC modeling
capabilities and publicly explain their use to building energy modelers through a study of supermarkets.
• Quantify and compare the energy impacts of using advanced exhaust equipment in supermarket kitchens.
• Quantify and compare the energy impacts of using various means of delivering and conditioning outdoor air (OA) being introduced into supermarkets.
• Quantify the advantages and disadvantages of using novel HVAC systems to condition supermarkets, with a special emphasis on dehumidification.
• Understand and quantify the interactions between the various EEMs studied, such as the effect of greater dehumidification on refrigeration energy use and the benefits of adding a DOAS system versus high-efficiency hoods (HEHs) in the kitchen, or both.
1.2 Structure of the Report
First, this report briefly explains the aspects of supermarket operation that make this building type unique and necessitate a detailed study of its HVAC systems. Then, the report introduces three sets of EEMs selected according to their energy-savings potential for supermarket
applications and overall market interest based on correspondence with industry representatives. Next, the scope of the project and experimental matrix are presented. Lastly, results are
presented and discussed. Appendices contain detailed information about the modeling
assumptions used and the procedure for integrating building and HVAC simulation programs and sample input files.
2 Supermarket Energy Use
This section briefly describes the energy use patterns in supermarkets, the main drivers of energy use in supermarkets, and the unique facets of supermarket operation that define HVAC design. Section 2.1 presents a high-level quantification of overall supermarket energy use. Section 2.2 delineates this energy use by end use. Finally, Section 2.3 gives a detailed explanation of the unique facets of supermarket operation that drive energy use in this building type and that will be used in this study.
2.1 Overall Supermarket Energy Intensity
In general, supermarkets are very energy-intensive buildings. A 2003 Commercial Buildings Energy Consumption Survey reported that food sales account for more than 1.2 billion ft2 of commercial building space and more than 250 trillion BTUs of total energy use per year (EIA 2005). As shown in Table 1, supermarkets ranked third in energy intensity, preceded by only restaurants and health care facilities. Supermarkets have the largest electric energy intensity (electricity use normalized by floor area) of any building type. In general, the energy intensity of supermarkets is growing because of market trends toward larger kitchen and prepared food areas, which make supermarkets more like restaurants in appearance and energy use patterns. These expanded kitchen areas require greater exhaust flow rates; therefore, greater amounts of OA must be conditioned and brought into the spaces to replace the air exhausted through the kitchen hoods.
Table 1. Energy Use Intensity, Including Both Gas and Electric (left) and Electricity Use Intensity (right) by Building Activity (EIA 2005)
2.2 Breakdown of Supermarket Energy Use
Several researchers have provided breakdowns of supermarket energy use by end use. Estimates vary and are climate-dependent, but the large refrigerated cases and walk-in refrigerators in supermarkets account for a large portion of the energy use (estimates range from 40%–60%). Estimates of typical HVAC energy use are 10%–25% of total building energy. This number varies considerably with building design, climate, outdoor air requirement, HVAC strategy, and refrigeration density.
Kosar and Dumitrescu (2005) report that 50% of the electricity consumption of a typical
supermarket is due to refrigeration equipment and 10% is due to HVAC systems. The following chart gives a breakdown of the electrical energy expenditure in supermarkets as reported by ASHRAE (2014). This chart is useful because it shows a further breakdown of refrigeration energy. It should be noted that advanced lighting features such as light-emitting diode fixtures, dimmable lights, and skylights are experiencing large market uptake and reducing the portion of energy attributable to lighting in supermarkets.
Table 2. Breakdown of Electrical Energy by End Use From Various Sources
As shown in Table 2 (the estimates of total energy by end use) the large amount of refrigeration equipment present in supermarkets accounts for a large portion of energy expenditure. This amount is influenced by many variables, including several that are determined by the HVAC system, as discussed in the next section. This study pays particular attention to these variables to suggest means of reducing the energy expenditure of the refrigerated cases in supermarkets while also reducing HVAC energy.
2.3 Drivers of Supermarket HVAC/Refrigeration Energy Use
Supermarkets differ in their operation and in their HVAC needs from other building types, as presented in this section. Specifically, Section 2.3.1 discusses the unique sensible load situation in supermarkets, Section 2.3.2 discusses the unique latent loads and their effects on refrigeration and HVAC equipment, and Section 2.3.3 discusses the unique exhaust and ventilation
requirements of supermarkets. End Use Walk-Ins 4% Condenser 3% Display Cases 15% Compressors 28% Space Conditioning 5% Lighting 38% Misc 7% 50% Percent of Total
ins, a great deal of cold air spills into the larger space and heat is conducted and radiated through display case and walk-in boundaries as well. For the purposes of HVAC design, this is accounted for via the use of “sensible case credits,” which are negative sensible loads applied to the space that represent the cooling effect from the display cases. In many cases, refrigerated cases provide the majority of the sensible cooling in the greater space of supermarket Sales Zones during the cooling season. In the heating season, the cooling provided by the cases must be counteracted with additional heat from the HVAC system.
These sensible case credits impact the HVAC operation by driving down the sensible heat ratio (SHR) demands of the space compared to a building without refrigeration. In the shoulder seasons in many climates, the space SHR may be zero or negative, signifying only
dehumidification (no sensible cooling) is needed or dehumidification and some heating is needed, respectively. An electrical cooling and dehumidification strategy requires the HVAC system to cool air below its dew point temperature (DPT) for dehumidification and then provide a large amount of reheat to ensure the space does not drop to a dry bulb temperature (DBT) that is lower than desired. This is particularly a problem in cold climates. Recommendations exist for keeping space conditions at DBTs comparable to offices or other building types (75°F, 66°F– 77°F) (Spyrou et al. 2013) but somewhat drier. However, in reality, building owners may be content to not provide the reheat required to maintain space conditions at this temperature during the cooling season and to allow the air around the refrigerated cases to drop in temperature below thermal comfort conditions.
2.3.2 Latent Loads
Several researchers have explained the need for drier conditions in supermarkets, especially in the refrigerated section of the Sales Zone. A good summary of the effects of space humidity on energy use in refrigerated cases is given in Kosar and Dumitrescu (2005). This review draws from several other works that go into greater detail on the effects of humidity on display case operation, including Farmarzi et al. (2000), Howell and Adams (1991), and Henderson and Khattar (1999).
2.3.2.1 Energy Concerns
The energy consequences of space humidity derive from a few different thermodynamic realities. The first is the effect on the energy use of the compressor used to cool the refrigerated display cases and walk-ins. To maintain product temperatures at desired levels, evaporators of
refrigeration systems must be kept at temperatures much lower than that of a roof-top air
conditioner. Medium-temperature (MT) cases typically maintain suction DPTs around 15°F and low-temperature (LT) cases maintain suction DPTs around –25°F, whereas the cooling coil in a common air handling unit may maintain a suction DPT of 50°F. The Carnot efficiency
calculation shows that the lower the evaporator temperature, the lower the coefficient of performance (COP) of the cooling cycle.
In an ideal situation, the refrigerated display cases and walk-ins would not interact
thermodynamically with the greater supermarket environment at all. In reality, large amounts of air infiltration from the surrounding environment into the display cases and walk-ins occur and humidity is inefficiently removed from the space by the case evaporator coil. It is obvious that the HVAC system should provide as much dehumidification as is economical to lessen the latent
In addition, other energy penalties occur due to humidity. Closed-door display cases must periodically run an anti-sweat cycle, accomplished by heating the glass doors through embedded electrical resistance heaters to prevent condensation from building on the door and the frames. Low-temperature cases must also go through periodic electric or hot gas defrost cycles to remove frozen condensate from their evaporator coils. Defrost cycles incur an energy penalty from the electricity used to melt the ice off the evaporator coil (if there is electric defrost) and the compressor energy to bring the case temperature back to set point (SP) after a defrost cycle. Numerous researchers have quantified the effect of reduced space humidity on refrigeration energy use. Kosar and Dumitrescu (2005) give a summary of some of these works, which provide measured ranges of 3%–21% reduction in compressor energy use with a 20% relative humidity (RH) reduction in the space, a 4%–6% reduction in defrost energy, and a 15%–25% reduction in anti-sweat heater energy.
The degree to which the cases affect the balance of sensible and latent energy is changing significantly with the increasing prevalence of reach-in MT cases (with doors) replacing open cases. While adding doors to MT cases reduces refrigeration energy, it also may increase humidity in the space by removing the moisture sink that the refrigerated cases once were. 2.3.2.2 Aesthetic/Safety Concerns
In addition to energy concerns, humidity in supermarkets leads to other concerns. Fogging of display case windows obscures products and discourages customers. For this reason,
supermarket owners often choose open (no door) display cases for much of their MT refrigerated cases, despite the fact that these cases have larger infiltration rates and thus are significantly less energy efficient.
Another concern is slip and fall risks in the aisles containing refrigerated cases. Water from the refrigerated cases can pool on the floor, causing a slippery surface. Again, this suggests drier conditions provided by the central HVAC system are desirable.
2.3.2.3 Lower Limits on Humidity Levels
System interactions limit the benefits of reductions in humidity levels, for several reasons: (1) fresh produce and other products may wilt more quickly when humidity levels in the surrounding air are too low; (2) maintaining very low humidity levels in one section of the store, such as the refrigerated section, and greater humidity in other zones, such as the kitchen, creates large vapor pressure driving forces between the zones that bring significant moisture directly to the
refrigerated section, where it is unwanted; and (3) maintaining a building overall humidity level that is much lower than the outdoor condition becomes increasingly energy intensive because of the large air infiltration rates in most supermarkets that constantly add large amounts of moisture to the space. Also, large cross-envelope vapor pressure driving forces, which would be present if there were a large difference in humidity between the indoor environment and the outdoor
operation, with a maximum DBT of 75°F. In discussions with industry professionals involved in supermarket HVAC, the consensus was that the “sweet spot” at which humidity should be maintained is between 48ºF and 52ºF DPT, if possible. This is not always possible with
traditional DX-based systems, particularly in humid climates. This study looks at the best way to maintain this level of humidity either through advanced, dehumidification-focused HVAC technologies and/or improved ventilation and exhaust strategies.
2.3.3 Exhaust and Ventilation Requirements
Most of the undesirable latent loads discussed previously are introduced into the conditioned space from the OA as opposed from internal moisture gains (i.e., occupants and produce misting). Supermarket OA requirements are unique in that the amount of OA intentionally brought into the supermarket is often dictated by make-up air (MAU) necessary to counteract large exhaust flow rates rather than ventilation or indoor air quality concerns. These large exhaust flow rates are due to the presence of cooking and cleaning equipment in the service area of supermarkets. Service areas often include more than one commercial oven and equipment such as a bread proofer, donut fryer, large range and fryer, and meat and seafood preparation areas with large ventilation requirements for odor control. In total, a typical supermarket may require make-up air quantities of around 0.5 cfm/ft2, which is about five times the amount of air required by ASHRAE Standard 62.1-2013 for ventilation and indoor air quality.
2.3.3.1 Airflow Requirements
Supermarkets house several different thermal zones within a single space that are often not separated by walls. Each of these zones has unique conditioning requirements and zone equipment. For this reason, general airflow within and among the spaces is a crucial design consideration in supermarkets, and the fan power required to move this air is an important contributor to overall supermarket energy use. In general, a minimum amount of air recirculation must be provided at all times when the supermarket is occupied. This ensures that air remains well mixed (both horizontally and vertically) and that occupants are comfortable. Industry professionals do not completely agree on minimum supply requirements for maintaining mixed space conditions, with estimates ranging from 0.3–1 cfm/ft2. For the purposes of this report, we chose an assumption of 0.5 cfm/ ft2 minimum airflow during occupied hours for all zones to best reflect the consensus of available sources.
The second airflow consideration arises from the fact that exhausts are often located in a different zone than where the OA is being provided. For example, a typical supermarket may have the vast majority of its exhaust leaving from the kitchen and half of its OA being supplied to the sales floor. The OA must then have an uninhibited path to migrate to the kitchen to maintain reasonable pressurization in both zones. The sales floor should be pressurized relative to the kitchen to ensure this migration and prevent kitchen odors from reaching the sales floor. For the reasons outlined here, the following section describes various ways of maintaining desired space conditions within a supermarket and emphasizes technologies and strategies for reducing supermarket energy use and cost.
3 Project Scope
With the unique HVAC needs of supermarkets described in the previous section, we analyzed three sets of EEMs. They correspond to three different aspects of the operating requirements for supermarkets and look at the various strategies available for reducing the energy impacts of these aspects of operation. The three EEMs are reducing exhaust air (EA) requirements, improving outdoor air delivery and distribution, and using advanced dehumidification equipment. These are discussed subsequently in Sections 3.1, 3.2, and 3.3, respectively.
3.1 Reducing Exhaust Air Requirements
Since overall HVAC energy use has a strong correlation to EA requirements, reduction of exhaust requirements is a promising area for overall supermarket energy use reduction. This reduction is currently being pursued through a few different strategies:
• Next-generation HEHs are available that more precisely engineer the air movement in the environment of the hood to capture heat and kitchen contaminants and reduce “spillage” into the surrounding environment. These hoods allow for a reduction in the required exhaust and therefore the required make-up air and its associated energy consequences.
• Demand controlled kitchen ventilation (DCKV) systems are realizing greater market uptake. A DCKV allows the exhaust flow rate to modulate in response to cooking activity in the kitchen. This modulation is achieved via optical and temperature sensors that detect cooking activity and modulate exhaust fan and interlocked make-up air fan speed in response. This saves both fan energy and the energy required to condition the make-up air.
• Additional strategies for reducing exhaust may be developed. These include, for example, strategically placing hotter cooking surfaces in the center of the exhaust hood to increase capture rate and reduce exhaust requirements.
Design specifications for EA flow rates for some systems are included in ASHRAE 90.1. Figures A1–A3 in Appendix A show the typical schedule for EA flow rates based on ASHRAE 90.1 (baseline), flow rates for a DCKV scheme, and flow rates for a DCKV exhaust schedule in conjunction with an HEH. Also shown in dotted lines are the associated OA supply schedules for each, which are large enough to offset exhaust flows plus maintain a positive pressurization in the building to avoid infiltration. It should be noted that interlocking the OA supply rate with the exhaust rate can significantly reduce OA requirements.
3.2 Improvement in Outdoor Air Distribution and Delivery
The large OA requirements in supermarkets suggest that further investigation into how the OA is delivered into the space will be beneficial. In discussion with industry practitioners, the general understanding was that supermarket designers often apply their own or general rules of thumb for determining how to deliver the required OA to the space. In this study, we quantify the
In the first strategy, referred to as “MAS” (mixed air system) in Figure 1 and from here forward, the MAS combines untreated OA with return air (RA). The mixed air is then conditioned by a DX coil before being distributed throughout the dry goods and refrigerated sections. Supply air is conditioned to ensure that the space conditions remain near SPs of 70°F DBT and 50°F DPT. The advantages of this strategy include a simple, compact design and one set of ductwork that delivers both the OA and conditioned air to the space.
The disadvantages of the MAS strategy include the fact that a large amount of air is moved through a large pressure drop during all times when ventilation and make-up air is required, which increases fan energy use. In addition, greater supply flow rates than required to meet space loads may need to be specified to maintain an OA fraction into the cooling coils of less than 20%; this is an industry standard maximum value that ensures proper functioning of the system. In turn, this may necessitate a larger cooling capacity than is needed to maintain a desired cubic foot per meter per ton and ensure adequate dehumidification. For example, 50 tons of cooling may be required to meet loads, with a supply flow rate of 17500 cfm or 350 cfm/ton desired to provide adequate dehumidification. However, if 5000 cfm of OA are needed for make-up or ventilation purposes, a supply flow rate of 25000 cfm is required to ensure the OA fraction is below 20% and thus a 71-ton system (43% larger than is needed to meet loads) operating at 350 cfm/ton will be specified. Also, a clear flow path must be provided between the location in the store at which the OA is delivered and the place at which air is exhausted. If OA is supplied in the Sales Zone and exhausted in the kitchen, a relatively unobstructed path between the two zones must exist.
The second strategy is referred to as “MAU” in Figure 1 and from here forward. The mixed air RTU in this strategy introduces only the amount of OA to satisfy ventilation requirements, unconditioned, into the return of the main RTUs. A separate make-up air unit (MAU) delivers OA necessary to balance the exhaust in the kitchen and delivers this directly to the kitchen. In this case, the MAU conditions the air only as much as needed to provide for a minimum amount of comfort in front of the cook line. The mixed air RTU ensures the dry goods section is
maintained at SPs of 70°F DBT and 50°F DPT. The refrigerated section conditions float based on the supply air delivered to this space and cross-mixing with the dry goods section of the Sales Zone.
The advantages of this strategy are: (1) the main RTU is smaller and more efficient because of the smaller burden from large OA flow rates; (2) the kitchen MAU can be interlocked with the exhaust fan to provide OA only when exhaust flows require it; and (3) designers need not be concerned with providing a clear path for transfer air from the sales zone to the kitchen.
Disadvantages are that two sets of HVAC equipment (RTU and MAU) are required and the main RTU still must move a relatively large amount of air whenever the space is occupied.
One improvement that can be made to the MAU strategy is the inclusion of an interior dehumidifier in the refrigerated section of the Sales Zone. This has been studied thoroughly (Fricke and Sharma 2011). We look at this scenario as well, which is referred to as “Interior Dehumidifier.” All “Interior Dehumidifier” configurations include an MAU in the Service Zone as well for easy comparison to other configurations/systems.
The Mixed Air System with DOAS Pretreatment, “Pre-Treat,” preconditions all the OA to a dry, cool condition before it is mixed with the return air. The mixed air RTU then provides mostly sensible cooling based on the demands of the dry goods section—the refrigerated section space conditions are not actively controlled and will float. The advantages of this strategy are: (1) the DOAS pretreatment handles most of the latent load and thus the main RTU can be smaller and more efficient; (2) only one set of ductwork is required; and (3) all the OA can be brought in through the main system. Disadvantages include: (1) a large amount of air must be moved
constantly through a large pressure drop whenever the building is occupied or exhaust flows; and (2) a clear path is needed for the make-up air to migrate from the sales floor area to the exhaust locations in the service area.
The DOAS with Recirculation System, “DOAS,” has the DOAS providing conditioned OA through separate ducting to the refrigerated section. Unlike the other scenarios, the DOAS actively controls the DBT and DPTs in the refrigerated section. A separate RTU conditions recirculated air to maintain the DBT and DPT SPs in the dry goods section. The DOAS
conditions the OA to a very dry condition and thus handles the majority of the latent load for the entire space.
This strategy offers several advantages. These include the fact that the fan in the recirculation RTU delivers only a minimum amount of airflow to maintain mixing or the minimum to
maintain sensible conditions, rather than the large amount of air required to dehumidify OA in a mixed air stream. Thus, fan power is greatly reduced in the recirculation RTU. The recirculation RTU may be sized smaller and configured for faster air speeds across the evaporator coil for increased SHRs because it no longer needs to handle the OA load, and the refrigeration systems operate more efficiently because of drier microclimatic conditions (see Section 2.3.2).
Disadvantages include the increased capital costs of the two systems and two sets of ductwork being required (one supplying recirculated air to the dry goods section and one supplying conditioned OA to the refrigerated section).
3.3 Advanced Dehumidification Systems
Because of the large quantity of OA necessary and the low space humidity levels desired for efficient operation of the refrigeration systems, more advanced dehumidification systems may offer cost and energy savings in supermarkets compared to dehumidification provided by conventional fixed-capacity direct expansion cycles in roof-top mixed air units. To evaluate these benefits, we quantified the savings available with seven advanced dehumidification systems in various combinations with exhaust and OA strategies mentioned above. Additional advanced HVAC systems were considered but not included in the analysis after consultation with manufacturers and sales professionals because of lack of interest or applicability for supermarket applications. These systems are described in Appendix E.
3.3.1 Baseline Direct Expansion System
The baseline system is a direct expansion (DX) air conditioner that conditions mixed air. The psychrometric process and a schematic of the system are shown in Figure 2. In Figure 2 and all subsequent figures, “OA” designates a design outdoor air condition, “SP” designates a space temperature and humidity SP, MX designates the mixed air condition, red lines on the
psychrometric chart represent heat and moisture transfer processes that are accomplished with an electric or natural gas input, and green lines represent passive processes.
Figure 2. Baseline system psychrometric processes and system schematic
Supply air moves at a constant volume through the system and the compressor cycles on and off in response to thermostat and humidistat signals. Heat rejected from the cooling cycle of the DX system and additional gas furnace reheat are often needed to ensure thermal comfort in the space. The main advantage of this type of system is that it is compact with low initial costs. No
Khattar and Brandemuehl (2002) have enumerated the disadvantages of this type of system. These include:
• Poor humidity control, because this system is intended mainly for handling sensible loads.
• The necessity for simultaneous heating and cooling caused by a need to overcool to dehumidify and then reheat in order to maintain comfortable space temperatures, because refrigerated cases negate much of the positive sensible loads in the space.
• Designers must choose either improved energy efficiency ratio (EER) and poorer dehumidification performance provided by a system with a high airflow/capacity or cfm/ton ratio, or the improved dehumidification performance of a low cfm/ton device, with a consequent decrease in EER.
• The need for a constant speed fan to run continuously and move a large amount of air through a system with a large pressure drop. Simulations in this study show that fan electricity use is of the same magnitude as the DX coil annual electricity for many buildings conditioned by this configuration.
• Re-evaporation of water from the evaporator coils into the airstream caused by frequent cycling of the compressor. Henderson et al. (2003) showed that, because of this
phenomenon, as the run-time fraction of the cooling coil drops below 0.5 (which may occur frequently in supermarkets during the shoulder seasons) the SHR of the system approaches 1, meaning no dehumidification is provided. Conversely, supermarkets experience an appreciable number of hours annually when only dehumidification is needed.
3.3.2 Improved Mixed Air Systems
Several improvements to traditional DX systems provide a lower SHR without reheat, which improves performance at part-load conditions. These improvements are described next. 3.3.2.1 Variable-Capacity Direct Expansion Systems
Variable capacity HVAC compressors, using either digital scroll technology or a variable frequency drive connected to a compressor, allow the system to continuously modulate its cooling rate based upon the cooling demands of the space, which are rarely at peak design conditions. Conversely, in typical DX systems, constant speed compressors cycle to adjust the cooling delivered over time. This leads to start-up inefficiencies as well as excessive wear on the compressor motor. In many cases, because of the lack of capacity modulation, 90% of system power capacity is used to meet a load of only 50% (Mehltretter 2014). Variable capacity compressors offer continuously adaptable control of the delivered load, reduced noise and vibration due to gradual startup and reduction of switching on and off, a low starting current, more uniform temperature control, and better COPs when part-load conditions are the
predominant operational state, which is the case for most buildings throughout the year (Cuevas and Lebrun 2009).
Variable capacity compressors are not recommended for certain applications because they may result in greater energy consumption. For variable capacity compressors that include a variable frequency drive, losses in the drive and motor reduce efficiency 3%–5% below a constant speed
compressor (Mehltretter 2014) while switching losses in the inverter also exist (Cuevas and Lebrun 2009). These variable frequency drive losses must be recouped by savings gained at part-load conditions to make economic sense. One example where constant speed compressors provide improved performance are applications that require a large year-round sensible load, such as data centers in a hot, dry climate. Proper sizing and staging of the compressors would minimize cycling losses, and with the focus being on sensible cooling, the system would actually perform better at an SHR approaching 1. In practice, variable capacity compressors should be paired with variable speed supply fans to deliver maximum efficiency (Wang et al. 2011). Several systems with variable capacity compressors are currently commercially available and typically include one or two variable capacity compressors in conjunction with one or two constant speed compressors. Constant speed compressors are responsible for handling the long-term fluctuations in load, while the variable capacity compressors are responsible for the short- and medium- term fluctuations (Mehltretter 2014).
3.3.2.2 Adaptive Multi-Path System
One improvement to the variable capacity DX system is the inclusion of dampers that optimize how the OA is mixed with the RA before entering the evaporator coil. This system, called the “Adaptive Multi-Path System” in this study, contains three independently modulating dampers that control the mixing ratio of the air stream and allow the DX coils to condition 100% OA, mixed air, or 100% RA. In this system, shown in Figure 3, optimized control algorithms ensure the most energy-efficient delivery of ventilation air and thermal comfort possible by modulating the position of the dampers and the system capacity. By adjusting the mixing of the air streams and modulating the capacity of the coils simultaneously, the Adaptive Multi-Path System continually modulates the system SHR to match the space loading SHR. Also included is a damper that allows return air to bypass the coil completely. Variable speed fans are also used to provide the most efficient conditioning.
Figure 3. Adaptive Multi-Path System psychrometric processes and system schematic
3.3.3 Interior Dehumidifiers in Refrigerated Case Zone
In applications in which the latent load in one area of the store is very high and the sensible load is small or negative, as in the refrigerated section of a supermarket, a dedicated interior
dehumidifier may provide an energy-efficient means of conditioning the space. Fricke and Sharma (2011) have studied this concept in detail. The two types of interior dehumidifiers studied are described next.
3.3.3.1 Liquid Desiccant Dehumidifier
Liquid desiccant (LD) systems have been gaining interest recently as a means of providing dehumidification without using vapor compression overcooling and reheat. Many different types of LD systems have been proposed. A review of available technologies is given in Lowenstein (2008). Among these is the Lithium Chloride low-flow liquid desiccant system studied in this project, described in detail in Lowenstein et al. (2006) and Lowenstein (2004).
Many different advantages of LD systems have been demonstrated. First, the most fundamental function of an LD system is to shift energy consumption from the electrical input of the com-pressor in a DX system to a thermal input in the regenerator of an LD system (Lowenstein 2008). In lieu of electricity, LDs can use waste heat, thermal energy generated onsite, such as a gas-fired boiler, or solar thermal energy, to name a few. Another advantage over DX systems is that desiccant systems on their own do not require synthetic refrigerants as do vapor compression systems, although LDs often must be combined with sensible cooling devices that may or may not involve the use of refrigerants. Lastly, because they dehumidify through contact with hygroscopic media rather than overcooling and reheat, desiccant systems can achieve DPTs below the freezing point of water, which would cause ice build-up in conventional systems (Lowenstein 2008).
The particular LD system modeled is not commercially available at the time of writing. At least one high-flow liquid desiccant system is commercially available, but performance data for this product was not available for this study.
Figure 4. LD interior dehumidifier
3.3.3.2 Direct Expansion Dehumidifier
Dehumidifying locally with a DX dehumidifier in the refrigerated section of a supermarket offers similar advantages similar to an LD dehumidifier, by reducing the latent load on the refrigerated cases. The difference is that dehumidification with the DX dehumidifier is accomplished
mechanically with an overcool-reheat strategy rather than chemically. Figure 5 depicts the system and processes.
Figure 5. DX interior dehumidifier
The system modeled is a commercially available, ENERGY STAR®-rated system that is simple but effective. It contains an evaporator coil with a drip pan and a full condenser in the supply path providing reheat. Air exits the dehumidifier drier and warmer than the entering air, thus dehumidifying and bringing the refrigerated section to a more comfortable temperature. The
3.3.4 Dedicated Outdoor Air Systems
DOAS, also called dual path systems, have been used in applications in which a relatively high latent load exists, especially if this load is due to ventilation. The basic principle behind DOAS is that one system treats ventilation air by bringing it to a low DPT and this provides for all of the dehumidification needs of the space. Another parallel system treats only recirculated air or provides radiant cooling, and does 100% or nearly 100% sensible cooling. This can reduce total fan power used by 20%–30% (Mumma 2001), provide for dehumidification in a more efficient manner, and even reduce capital costs by around 15%, contrary to popular perception (Mumma 2001). Next, we briefly describe three DOAS system categories.
3.3.4.1 Direct Expansion Dedicated Outdoor Air Systems
The first DOAS strategy studied involves operating two DX systems in parallel. This system is usually run with a total enthalpy recovery wheel between the exhaust stream and the ventilation air stream (Mumma 2001). However, it is not clear that exhausting sufficient amounts of air from supermarkets without underpressurizing the building is possible. This is due to exhaust fans already operating in the bakery and deli zones and the large amount of infiltration that is present in most supermarkets due to doors being open for large portions of the day. These systems are usually operated with the ventilation air stream being dehumidified with a 42°F–48°F coil in office and retail buildings to remove enough moisture to provide for all of the space’s
dehumidification (Mumma 2001). However, for supermarkets, common practice is to keep the coil as cool as possible without freezing to dehumidify as much as possible. DBTs of both supplies are controlled to 55°F or below (Mumma 2001). This strategy is shown in Figure 6.
Figure 6. Psychrometric process and system schematic for DX DOAS strategy
There are several benefits to such a system. First, the sensible conditioning of the recirculation air can be done with a DX coil operating at a much higher evaporator temperature because only sensible cooling is being done. This leads to higher system COPs. This strategy also reduces fan power by constantly supplying only the quantity of air needed for ventilation, rather than
constantly recirculating a large quantity of room air (Mumma 2001). It also eliminates the problem of off-the-shelf air conditioners having airflow per ton quantities larger than those needed for efficient dehumidification (Morris 2003).
For the purposes of this study, we also analyzed a system that has the DX DOAS system placed upstream of the main RTU in a “Pre-Treat” configuration. This is a convention often adapted in practice because it eliminates the need for a separate set of ductwork to bring the OA to the space. OA is preconditioned by a dedicated system before being introduced into the return of the main RTU that allows the main RTU to be downsized and run at a greater airflow per ton, thus making it more efficient.
3.3.4.2 Liquid Desiccant Dedicated Outdoor Air Systems
This strategy involves using the LD system described above in Section 3.3.3.1 to dry the ventilation air to a very low DPT and a parallel DX system to provide for sensible cooling. The LD system dries the air as much as possible, usually to around 20% RH, and it is delivered to the space. Little is known about the performance of this configuration in supermarkets because it has not been studied. The system is depicted in Figure 7.
Figure 7. Psychrometric processes and system schematic for LD DOAS system
3.3.4.3 Condenser Heat-Regenerated Desiccant Wheel Dedicated Outdoor Air System The last system studied, shown in Figure 8, is a dual-path solid desiccant (SD) dehumidifier that dehumidifies and cools air in one stream and uses condenser heat to regenerate the desiccant wheel in the parallel stream before exhausting the regeneration air. The wheel used in this system is also a Type 3 wheel (Kosar et al. 2007). Before entering the wheel, the air is precooled by a four-stage DX cooling coil. This configuration is capable of delivering about a 45°F DPT at design conditions.
Several benefits and shortcomings of this system have been suggested. First, it was shown to reduce the SHR further than either a wrap-around heat pipe (WAHP) or wrap-around desiccant
Figure 8. Psychrometric processes and system schematic for condenser heat-regenerated SD wheel DOAS strategy
3.4 Experimental Matrix
To study the three EEMs, we simulated several different combinations of the various EEMs in a typical reference building over the course of the year. We chose the combinations of the EEMs in consultation with HVAC professionals and manufacturers to study the strategies most likely to be implemented in practice and that would result in the greatest energy savings. We performed full-building simulations for each of these strategies over the course of a Typical Meteorological Year 3. Readers can refer to Appendix A to see details of the building, loads, system models, schedules, and other assumptions.
We conducted these simulations using DOE’s EnergyPlus building simulation software, which we enhanced by co-simulating EnergyPlus with models of advanced systems not included in the EnergyPlus libraries. We wrote these models in the Modelica modeling language and simulated them with the Dymola software package. Detailed information on the integration of the two software packages can be found in Appendix B. See comparisons of the building simulation results obtained with each of the two programs in Appendix D.
We performed simulations for locations in which it is expected that the greatest benefits will be derived. Because many of the opportunities for improvement in HVAC performance in
supermarkets are available through improved dehumidification and reduction of latent loads, we investigated climates with significant humidity loads, including both hot and cold climates (ASHRAE “A” climate zones). These areas include the entire eastern half of the United States, including many of the major population centers, and regions with high population density. Table 3 shows a list of the modeled representative cities and the corresponding Typical Meteorological Year weather file used for OA assumptions.
Table 3. Climate Zones and Representative Cities
No. Climate Zone Representative City EPW Weather File Source
1 1A Miami, Florida Miami International Airport
2 2A Houston, Texas Bush Intercontinental Airport
3 3A Atlanta, Georgia Hartsfield-Jackson International Airport 4 4A Baltimore, Maryland Baltimore-Washington International Airport 5 5A Chicago, Illinois Chicago-O’Hare International Airport 6 6A Minneapolis, Minnesota Minneapolis-St. Paul International Airport Table 4 summarizes the experimental matrix with the strategies simulated for each climate. We set up the experimental matrix and presented the results later in a manner such that comparisons could be made between sequential simulations. The first three simulations may be thought of as alternative baseline systems. MAS-a is an unrealistic situation, but one that is necessary to maintain a 50ºF DPT throughout the summer in humid climates using only a rooftop unit. MAS-b is the same system, MAS-but sized in a more realistic manner. MAU includes a make-up air unit and is the strategy often specified in supermarkets, although discussion with practitioners indicated that MAS-b is also specified in many instances. The MAU scenario is the baseline against which we compare all other systems in the results section. The other systems are organized by the EEM studied. We simulated each system marked with an asterisk in Table 4 under reduced exhaust conditions (due to the presence of HEHs and a DCKV system) and we present results for this scenario in Table 4.
Table 4. System Combinations Considered in the Study
*Denotes system modeled with both conventional and DCKV+HEH exhaust rates
Designation EEM Exhaust Schedule OA Delivery Mixed Air System Recirc System OA System Simulation Program MAS-a
Baseline Conventional MAS
Oversized Mixed Air DX
RTU
EnergyPlus
MAS-b Baseline Conventional MAS
Mixed Air DX
RTU EnergyPlus MAU Baseline Conventional MAU
Mixed Air DX
RTU MAU EnergyPlus MAU + DCKV 1 DCKV MAU
Mixed Air DX
RTU MAU EnergyPlus MAU+ DCKV+ HEH 1 DCKV+ HEH MAU Mixed Air DX RTU MAU EnergyPlus
DX PRETREAT*
2 Conventional Pretreat Mixed Air DX RTU
MAU +DX PRETREAT/
RTU
EnergyPlus & Modelica
DX DOAS* 2 Conventional DOAS DX
MAU + DX DOAS
EnergyPlus & Modelica DX INT DEHUM* 2 Conventional MAS DX
DX
Dehumidifier MAU
EnergyPlus & Modelica LD INT DEHUM* 3 Conventional MAS DX
LD
Dehumidifier MAU
EnergyPlus & Modelica VAR DX* 3 Conventional MAS MAU
EnergyPlus & Modelica LD DOAS* 3 Conventional DOAS DX
MAU + LD DOAS
EnergyPlus & Modelica SD DOAS* 3 Conventional DOAS DX
MAU + SD DOAS EnergyPlus & Modelica SD PRETREAT* 3 Conventional Pretreat DX MAU + SD PRETREAT/ RTU EnergyPlus & Modelica ADAPTABLE* 3 Conventional EnergyPlus & Modelica Adaptable System Variable DX RTU