CHARACTERIZATION OF THE EVOLUTION OF A RELOCATED TIDAL INLET: MASON INLET, NORTH CAROLINA
John M. Welsh
A Thesis Submitted to the
University of North Carolina at Wilmington in Partial Fulfillment Of the Requirements for the Degree of
Master of Science Department of Earth Sciences
University of North Carolina at Wilmington 2004
Approved by Advisory Committee
_____ _ Paul A. Thayer _______ ________Lynn A. Leonard_______ _____ William J. Cleary _ ____
Chair Accepted by
_______ Robert D. Roer _ _____ Dean, Graduate School
This thesis has been prepared in a style and format consistent with
TABLE OF CONTENTS
ABSTRACT...v
ACKNOWLEDGEMENTS... vi
LIST OF TABLES... viii
LIST OF FIGURES ... ix INTRODUCTION ...1 Objectives ...3 Site Description...4 Background...4 Previous Works...12 METHODOLOGY ...16
ADCP and Flow Dynamics...16
Ebb-Tidal Delta and Inlet Throat Topo-Bathymetric Analyses...23
Flood Shoal ...26
Vertical Aerial Photographs...28
RESULTS ...32
Water-Level Data...32
Vertical Aerial Photographic Data...35
Inlet Dimensional Data ...35
Net Shoreline Change ...37
Pre- and Post-Relocation Comparisons and Relationships...39
Channel Cross-Section Changes ...48
Flood Shoal Transport...52
Ebb-Tidal Delta Development ...53
ADCP Data ...57
Inlet Throat and Tidal Prism...57
Feeder Channels and Flow Distribution ...59
Theoretical Relationships and Comparisons...63
Tidal Prism and Cross-Sectional Area...63
Ebb-Tidal Delta Volume and Tidal Prism ...66
Ebb-Tidal Delta Volume and Cross-Sectional Area...68
DISCUSSION ...70
CONCLUSIONS...90
ABSTRACT
Between January and April 2002, Mason Inlet, situated between Figure Eight Island and Wrightsville Beach, N.C. was artificially relocated 2,800 ft updrift of its most recent position at the southern terminus of a migrating barrier spit. Relocation was chosen from several coastal management options due to increased backbarrier infilling and southerly migration of the inlet that imminently threatened a resort complex and infrastructure on northern Wrightsville Beach. The relocated Mason Inlet provides an ideal site to study the evolution and impacts of a recently relocated system from its inception while simultaneously assessing the relative success of the project. Techniques such as ADCP, RTK GPS, and GIS-based analyses served as tools in the collection of data pertaining to a variety of inlet parameters.
Cumulative erosion measured along neighboring shoreline reaches was induced by inlet relocation and subsequent formation of the ebb-tidal delta coupled with channel migration. Key indicators suggest that the system remains flood dominant. Noticeable infilling of the
backbarrier persists along with ebb durations exceeding flood durations and flood flow volumes exceeding ebb volumes. JARRETT's (1976) theoretical equation relating tidal prism (TP)and
cross-sectional area (AC) appears to be a useful tool for estimation of the relocated Mason Inlet's
TP. However, ebb-tidal delta volume after 1.6 years remains well below the equilibrium volume
predicted by WALTON and ADAMS' (1976) model. Future modification (e.g. dredging feeder channels) to the system will be needed in order to mitigate the infilling nature of the inlet that historically has led to increased migration to the southwest. Failure to contain the inlet within the proposed “inlet corridor” will result in an unsuccessful relocation effort.
ACKNOWLEDGEMENTS
This thesis would not have been possible without the aid of countless individuals. Foremost, I would like to express my utmost appreciation to my entire family, especially my parents, James and Suzanne Welsh, for their instilled confidence and incessant support of my educational endeavors. A genuine debt of gratitude is extended to Dr. W. Cleary for imparting his knowledge and expertise and providing me with an exemplary graduate-level experience. The knowledge bestowed under his advisement has proven to be an invaluable tool in completing this project and preparing for future career opportunities. Appreciation is expressed to Dr. L. Leonard and Dr. P. Thayer, committee members, for their encouragement, advice, and diligence in seeing to completion the success of this project. I would like to thank the members of the Coastal Geology Laboratory, specifically, Ben McGinnis, Chester Jackson, Adam Knierim, Kenny Willson, David Doughty, and Leighann Budde, for their friendship foremost, loyalty, advice, and willingness to aid a colleague. Thanks to one of my best friends, Dan Orr, for your moral support and encouragement over these last three years.
Spencer Rogers, of N.C. Sea Grant, provided countless contacts, information, and advice related to this investigation and was considered an invaluable resource. Special thanks are also extended to Chris Gibson of Gahagan & Bryant Associates for graciously providing detailed bathymetric data and aerial photographs, Lyn Jack of the U.S. Army Corps of Engineers, Wilmington District, for the unlimited access to aerial photographs, and Karyn Erickson of Erickson Consulting Engineers, for providing water-level data. I would also like to thank the UNCW Department of Earth Sciences for providing financial support during my graduate tenure and the UNCW Center for Marine Science for making boats and equipment readily available during the field component of my research. The U.S. Army Corps of Engineers Coastal Inlets
Research Program and N.C. Sea Grant provided funding for a portion of the research invested in this study.
LIST OF TABLES
Table Page
1. List of vertical aerial photographic sets, associated agencies, scale
and error ...29 2. List of tidal data obtained from TG-1 located in Banks Channel ...34 3. Migration rates and position changes for the inlet throat, Figure Eight
shoulder, and Wrightsville Beach shoulder. Pre-relocation measurements were taken along Profile 0; whereas, post-relocation measurements were along Profile 1 (see Figure 2). Note that positive values represent southwest migration; whereas, negative values are indicative of
northeasterly migration of a particular feature...44 4. Throat survey data gathered across Profile 1 (see Figure 15)...51 5. Ebb-tidal delta development. Volumes are calculated off the March
(As-built) 2002 surface and areas refer to the portion of the shoal above
the March 2002 surface...56 6. ADCP and tide range data for each of the eight throat surveys...58 7. ADCP and tide range data for six flood surveys completed in Mason
Creek at Profile 3 and the four flood surveys completed in Banks
Channel at Profile 2 (see Figure 2) ...61
LIST OF FIGURES
Figure Page
1. Location map of the study area. Dark features are dredge spoil islands...5 2. Photographs illustrating (a) Shell Island Resort, (b) construction phase,
(c) beach nourishment of Figure Eight Island, (d) inlet opening, (e and f) old inlet closure, (g) original inlet closed and ebb shoal collapse,
associated with the relocation of Mason Inlet. Photographs courtesy of
ATM and Dr. W. Cleary ...11 3. Post-relocation map depicting positions of ADCP transects, photographic baselines,
bathymetric profiles, and water-level meters (TG-1). Profile 0 depicts the location of the inlet throat pre-relocation. ECE indicates
the location of Erickson Consulting Engineers, Inc., instrumentation ...17 4. Sketch illustrating the subsections of a channel measured and not
measured by an ADCP...21 5. Vertical aerial photograph showing the Banks Channel flood shoal
complex. The outlined area indicates the study area; whereas, the numbered lines are the transects used to measure the migration of
the shoal ...27 6. Post-relocation map depicting shoreline transects (400-ft spacing)
along Figure Eight Island and Wrightsville Beach ...33 7. Aerial photographs illustrating the shoaling trend of within the feeder
channels prior to relocation of the inlet. Note that scale is consistent
for each photograph ...36 8. Photographic set depicting a continued shoaling trend within the feeder
channels after relocation of the inlet...38 9. Graph depicting the net shoreline change before and after relocation of
the inlet. Positive values are indicative of net accretion whereas
negative values are indicative of net erosion at an individual transect...40 10. Aerial photographs depicting the “shoreline bump” situated within
Transects 4–10 along the northern portion of Wrightsville Beach.
Notice growth of the feature during the four years prior to the relocation ...41 11. (a) Graph illustrating inlet width and migration distance since the
ebb channel when the inlet was opened on March 7, 2002. (b) Graph depicting high correlation between inlet channel position and width
following the relocation ...42 12. Graph depicting inlet evolution at Profile 1: Position of inlet channel,
and both shoulders of the inlet through time. Note that negative values
represent positions northeast of the position in March 2002 ...46 13. Post-relocation map depicting three delineated shoreline zones. The
extended lines represent boundaries between neighboring zones...47 14. Graphs depicting cumulative erosion along opposing shorelines with
inlet migration: (a) Wrightsville Beach shoreline erosion with southwest channel migration. (b) Figure Eight Island shoreline erosion with southwest channel migration. Note that an increase in value of cumulative inlet migration indicates southwesterly inlet migration; whereas, a decrease in cumulative shoreline change is indicative of
erosion...49 15. Cross-sections of the inlet throat taken across Profile 1. Each graph
compares the March (As-built) 2002 cross-section, taken within one
week following opening of the inlet, with a later cross-section ...50 16. Flood shoal (a) feature position changes and (b) net volume
changes within Banks Channel. ...54 17. Post-relocation map based on July 2002 bathymetric survey depicting
bathymetric map (1-ft contour interval) and delineated ebb-tidal delta
area (green) ...55 18. Inlet throat linear regression graphs indicating correlation (Pearson-r)
between (a) ADCP-calculated tidal prism and tidal range and (b) ADCP-
calculated tidal prism and ADCP-measured cross-sectional area...60 19. Bar graph illustrating differences in derived tidal prism values ...65 20. Linear regression graphs indicating correlation (Pearson-r) between
(a) ADCP-calculated tidal prism and Jarrett’s predicted TP and
(b) ADCP-measured cross-sectional area and Jarrett’s predicted AC...67
21. Bar graph illustrating differences in derived ebb-tidal delta values ...69 22. Flow speed comparison between data measured by the ADCP and
Erickson Consulting Engineers within Banks Channel on a flood
23. Feeder channel cross-sections measured during October 2003: (a) Banks Channel measured along Profile 2 and (b) Mason Creek measured along Profile 3. Note change in distance scale
INTRODUCTION
Tidal inlets are corridors between adjacent barrier islands that act as pathways for exchanging water, sediment, and nutrients between the open ocean and estuaries. Each inlet is part of a sand-sharing system, and plays a major role in the coastal sand budget by retaining large volumes of sediment from the littoral system (BRUUN and GERRITSEN, 1959; FITZGERALD, 1982; OERTEL, 1975). Tidal prism and the local wave climate of an inlet system control the extent to which these systems interrupt the littoral drift and store sand (HAYES, 1980).
Inlets are dynamic systems and are constantly in a state of flux and as a result pose a heightened threat to adjacent coastal communities. Twenty tidal inlets punctuate the extensive shoreline (320 miles) of North Carolina and currently comprise approximately one percent of North Carolina’s shoreline (CLEARY, 1996). In Onslow Bay, situated between Cape Lookout and Cape Fear and containing approximately one-third of the 320-mile extent of North
Carolina’s shoreline, inlets have influenced sixty-five percent of the barrier island shorelines during the past two hundred years (CLEARY, 1996). The great majority of the critical erosion zones identified along the shoreline are associated with inlet systems. The negative impacts within these inlet-influenced critical erosion zones are exacerbated when the tidal inlet is a migrating system.
Most of North Carolina’s inlets have been modified to some extent as a result of
improved navigation via channel maintenance and removal of sand for beach nourishment. Hard stabilization techniques (engineering solution) by way of jetties or groins are traditionally used in the United States; however, North Carolina implemented a general statute, in 1984, that prohibits the use of hardened erosion-control structures along its coastline. As a result, soft protection techniques (e.g. dredging, beach nourishment, and sandbag installations) have become the
mainstays of North Carolina’s engineering solutions to these coastal hazard scenarios. Reasons for practices such as these are typically associated with the mitigation of shoreline erosion. Large-scale modification of inlets, associated with relocation or jetty emplacement, commonly alters the parameters (e.g. cross-sectional area, tidal prism, etc.) of an inlet and can result in substantial erosion of neighboring shorelines (CLEARY et al., 1989; CLEARY and MARDEN, 1999). Concern over management issues (e.g. artificial inlet relocation) related to these
modifications has increased due to the severe impacts associated with these alterations and the future modifications (e.g. dredging) slated for most of North Carolina’s inlets.
Knowledge of how large-scale modification alters the physical parameters, current dominance, basin filling characteristics, as well as the impact on the offshore portion of specific inlet systems in southeastern North Carolina is lacking. A key element in evaluating the
performance of an inlet is applying the linear regression relationships derived by JARRETT (1976) and WALTON and ADAMS (1976) for equilibrated inlet systems to the new system. This thesis provides a framework from which the ramifications of inlet relocation on the neighboring oceanfront shoreline, tidal prism, inlet-related sand shoal budget, and current dominance will be better understood. The relocated Mason Inlet provides an ideal site to study the evolution and impacts of a recently relocated system from its inception by comparing the actual measured and derived values to predicted values obtained from regression equations associated with key inlet parameters.
Objectives
The specific objectives of this study are to:
• Analyze four sets of pre-relocation and seven sets of post-relocation aerial photographs within a geographic information system (GIS) to identify morphologic changes associated with the inlet’s neighboring shoreline morphology and the extent of sand shoals comprising the new and abandoned flood and ebb deltas.
• Monitor the changes in volume and area of the new ebb-tidal delta, and characterize changes in cross-sectional area, tidal prism, aspect ratio (width:depth), and other parameters of the inlet over a 1.6-year period following the relocation.
• Utilize the theoretical equations of WALTON and ADAMS (1976) and JARRETT (1976) to predict specific physical inlet parameters such as throat cross-sectional area, tidal prism, and ebb-tidal delta volume. Compare the predicted values to those corresponding values that were calculated from directly measured field data. Ultimately determine the
applicability of these theoretical models to this particular inlet system following a relocation effort.
• Quantify volume changes and track the migration of a flood shoal within Banks Channel over a six-week period to monitor tidal and wave influence on sediment transport within a secondary feeder channel connecting the inlet to the Atlantic Intracoastal Waterway (AIWW).
• Monitor currents within the inlet throat, Banks Channel, and Mason Creek using an Acoustic Doppler Current Profiler (ADCP) to ascertain what distribution of flow passes through feeder channels of Banks Channel and Mason Creek, the primary navigational corridor connecting the inlet to the AIWW.
Site Description
Mason Inlet, situated in Onslow Bay along North Carolina’s southeast coast, lies between Figure Eight Island to the northeast and Wrightsville Beach to the southwest (Figure 1). This region is characterized by HAYES (1994) as microtidal and wave-dominated with mixed semi-diurnal tides. The backbarrier region between the AIWW and Mason Inlet is the Middle Sound Estuary, which consists mostly of marsh incised by tidal creeks. Mason Creek and Banks Channel, two primary tidal channels within the estuary, provide the only navigable connection between the inlet and the AIWW.
Mean wave height and period in this region are 2.6 ft and 7.9 seconds, respectively (JARRETT, 1977). The measured tidal range of this system has a mean range of 3.28 ft, which increases to 3.93 ft under spring tide conditions and decreases to 2.66 ft under neap tide
conditions. KNIERIM (2003) noted that the mean range for Rich Inlet to the northeast measured 3.54 ft. Mean sea level was determined to exist at an elevation of -0.31 ft (North American Vertical Datum 1988 (NAVD 88)). The dominant direction of wave propagation is from the east-northeast and comprises 64% of the total wave energy that affects this area. These waves result from the extra-tropical storms that occur during the fall and winter (FINLEY, 1976). Net longshore sediment transport is in the southerly direction and occurs at a rate of approximately 769,000 yd3/yr (USACE, 1982).
Background
A geomorphic and historic account of inlet activity associated with Mason Inlet (Figure 1) and the surrounding area determined that several migrating inlets had cycled through the region during the past 200 years as evidenced by a series of narrow, elongated marsh islands
igure 1. Location map of the study area. Dark features are dredge spoil islands. F
situated within the backbarrier lagoon (CLEARY and MARDEN, 1999). Barren Inlet, a predecessor to Mason Inlet, known also as Wrightsville or Moores Inlet, opened in 1733 along the southern portion of Figure Eight Island and migrated to the southwest prior to the opening of Mason Inlet in 1888 (CLEARY et al., 1979; BROOKS, 1988; CLEARY and MARDEN, 1999; JOHNSEN et al., 1999; FREEMAN, 2001; JACKSON, 2004). Between 1888 and 1965, Mason Inlet was situated between Figure Eight Island and Shell Island whereas Barren Inlet to the south was positioned between Shell Island and Wrightsville Beach (JACKSON, 2004). The artificial closure of Barren Inlet in 1965 by the U.S. Army Corps of Engineers (USACE) resulted in the merger of Shell Island with Wrightsville Beach into one contiguous island. Mason Inlet continued to migrate to the southwest and separated Figure Eight Island from an extended Wrightsville Beach.
Since the early 1900’s, the inlet has exhibited a net migration pattern to the southwest stretching along a one-mile corridor. Although the predominant nature of inlet migration has been in the southwesterly direction, short-term reversals have occurred. Historically, spanning decadal time periods (1940’s to 1990’s), inlet migration rates have varied greatly and are thought to be controlled by the characteristic shoaling nature of the inlet and reduction in tidal prism as migration perpetuates (CLEARY and FITZGERALD, 2003). Migration rates between the mid-1960’s and 1990’s ranged from 0 to 295 ft/yr. The highest rates during this time period occurred during the mid-1990's when the inlet system experienced a marked influx of sediment that resulted in shoaling of the inlet's interior channels along with a subsequent reduction in cross-sectional area and tidal prism. Reduction of the inlet’s tidal exchange capacity allowed
alongshore drift to assume the dominant role in determining the inlet’s location. Between 1974 and 1996, the inlet channel migrated southwest approximately 3,609 ft, at an average rate of 164
ft/yr (CLEARY and MARDEN, 1999). Migration of the opposing inlet shoulders occurred at varying rates with the updrift margin moving 20 ft/yr faster than the downdrift margin during this particular period. Drastic changes in the planform of the adjacent barrier islands resulted from migration of the inlet (BROOKS, 1988).
By 1997, the inlet channel had migrated to a position within 65 ft of a $22 million resort complex (Shell Island Resort) located on the northern terminus of Wrightsville Beach (Figure 2a). The position of the inlet at that time not only imminently threatened the resort but also posed a potential future problem for approximately 650 properties, including single-family homes and several condominium complexes located further to the southwest of the resort. The Shell Island Homeowners Association obtained a variance from the N.C. Coastal Resources Commission (NCCRC) and N.C. Division of Coastal Management (NCDCM) on February 4, 1997 to build a large geotextile revetment (combination of sandbags and geo-tubes) along Mason Inlet’s southern channel bank to protect the imminently threatened resort building (Figure 2a).
Stabilization of the inlet's southern margin caused the inlet throat to adjust accordingly. The throat cross-sectional area in 1996, prior to sandbag and geo-tube emplacement, measured 2,207 ft2 and decreased by 36% over the next two years. The inlet channel’s depth scoured from
6.6 to 11.2 ft over the same period. By 2001, an additional 46% reduction (1,410 ft2 to 764 ft2) in cross-sectional area occurred as continued elongation of the updrift spit led to encroachment of the spit upon the ebb channel and the southern margin that remained in place (CLEARY and FITZGERALD, 2003).
In order to understand changes to the inlet over the past thirty years, knowledge of how the tidal prism fluctuated must be addressed. CLEARY and FITZGERALD (2003) noted a reduction in size of the inlet since the late-1970’s. Based on O’BRIEN’s (1931, 1969) empirical
model that relates inlet throat cross-sectional area to tidal prism, the noted reduction in size of the inlet was attributed to a diminished tidal prism (CLEARY and FITZGERALD, 2003). Over this time period, Mason Inlet experienced a shoaling trend within the feeder channels and flood shoal complexes positioned within the backbarrier portion of the system. Mason Creek
experienced a high degree of sedimentation during the late-1980's through the mid-1990's. FREEMAN (2001) recorded shorter flood durations (6.06 hrs) than ebb (6.36 hrs) with faster flood (2.85 ft/s) than ebb (2.20 ft/s) current velocities from within the creek in 1998.
Measurements such as these indicate flood dominance and support the observation of net sediment transport to the backbarrier portion of the system. Increased shoaling of the lagoon behind the barrier islands eventually diminishes the area that the backbarrier bay encompasses. As the bay area is diminished a notable reduction in the inlet’s tidal prism is expected
(FITZGERALD, 1996). Previous studies of Mason Inlet support this assumption. A sand accumulation rate of 75,861 yd3/yr was estimated to have occurred from 1996 to 1999 within the interior feeder channels (ATM, 2000). A noticeable 63% reduction (67.1 x 106 ft3 to 24.7 x 106 ft3) in tidal prism occurred between 1995 and 1999 (CLEARY, 2003; ATM, 2000).
Initially, the installation of sandbags along the southern margin of the inlet was perceived as a short-term solution to protect the infrastructure of Shell Island against the inlet's migration. However, as a condition of the variance, a long-term solution was needed to deal with this issue. The deadline for removal of the sandbags was initially set for September of 1999.
The Mason Inlet Preservation Group (MIPG) formed in 1998. In conjunction with New Hanover County several “long-term” options were explored. The proposed solutions included a “no-action” proposal that would allow the inlet to migrate uninhibited at the expense of the infrastructure located downdrift of the inlet. Another proposal called for “inlet-closure”. The
environmental ramifications of this scenario, which would result in reduced flushing between the Atlantic Intracoastal Waterway (AIWW) and the ocean by combining Figure Eight Island with Wrightsville Beach, culminated in its rejection by the county. The third proposal of “inlet-relocation” sought to reposition the inlet updrift of its current location. Ultimately, Applied Technology and Management, Inc. (ATM) was contracted by the county in 1998 to devise a workable inlet relocation project.
An extension of the variance was issued that allowed the sandbags and geo-tubes to remain in-place until September 2000 to provide more time to devise a feasible solution. The issue gained national attention after the extension expired, and the homeowners of the resort complex refused to remove the sandbags. Consequently, several variance extensions were granted, and a final deadline to remove the sandbags and geo-tubes was set for December 2001.
ATM engineers designed a plan to reposition Mason Inlet 2,800 feet north of its current location and included excavation of a new inlet channel, realignment of Mason Creek, and closure of the former Mason Inlet. A large-scale hydrodynamic model showing the potential project impacts on wildlife, fisheries and other biological resources, was completed. It was not until November 2001 that the USACE, Wilmington District issued a provisional permit to New Hanover County for the proposed relocation of Mason Inlet. The National Fish and Wildlife Coordination Act and the Clean Water Act required that the USACE include certain conditions on the permit to protect fish and wildlife resources. Finally, on January 10, 2002 the USACE, New Hanover County, and local environmental agencies agreed on a contract that met all the interests that were necessary for the relocation effort.
The 2D hydrodynamic model, used by ATM, allowed engineers to simulate and design the ideal configuration of the new inlet channel. For the purposes of the project, the relocation
design recommended the inlet channel should be cut approximately 2,800 feet northeast or updrift of its December 2001 (pre-project) location and have a cross-sectional area of 5,000 ft2. The major goals established for the project design included: (1) protecting the infrastructure and resort complex on Wrightsville Beach and nourishing the updrift shoreline of Figure Eight Island, (2) reducing the impacts to the surrounding marsh and native bird and marine life habitats, (3) mitigating any hydrodynamic effects on the neighboring Rich Inlet to the northeast and Masonboro Inlet to the southwest, and (4) creating, within reason, a relatively natural stable inlet to be contained within a 1,000-foot “inlet corridor” (ERICKSON et al., 2003).
The construction phase for the relocation began in January of 2002 and extended until April 15, 2002. The new inlet channel was excavated across the southern spit of Figure Eight Island directly in-line with the position of Mason Creek (Figure 2e) in order to maximize flushing between the ocean and the AIWW. Excavation to construct this design template required the removal of 340,000 yd3 of sand from the new inlet channel and 145,000 yd3 from Mason Creek (ERICKSON et al., 2003). An additional 335,000 yd3 was removed from an area located directly landward of the new inlet channel to provide a catchment basin for the newly developing flood shoal and to prevent excess amounts of sediment from being transported into the AIWW. Approximately 400,000 yd3 of the excavated sand was used to nourishment 2.5 miles of shoreline along the southern end of Figure Eight Island (Figure 2c).
Officially, the relocated Mason Inlet channel was opened during a neap tidal phase prior to the beginning of an ebb tidal flow on the afternoon of March 7, 2002 (Figure 2d). The closure of the original inlet channel to the southwest was completed a week later on March 14, 2002. An estimated 270,000 yd3 of material was used to plug the original inlet (ERICKSON et al., 2003).
Figure 2. Photographs illustrating (a) Shell Island Resort, (b) construction phase, (c) beach nourishment of Figure Eight Island, (d) inlet opening, (e and f) old inlet closure, (g) original inlet closed and ebb shoal collapse, associated with the relocation of Mason Inlet. Photographs courtesy of ATM and Dr. W. Cleary.
G 05-26-2002 F 03-14-2002 A B C D E 03-07-2002 03-14-2002 02-20-2002 Jan. 2002 Feb. 2002 G 05-26-2002 F 03-14-2002 A B C D E 03-07-2002 03-14-2002 02-20-2002 Jan. 2002 Feb. 2002
The original ebb-tidal delta was allowed to naturally collapse against this section of shoreline under wave action and nourish the beach fronting the resort complex (Figure 2g). A monitoring program to track inlet evolution was developed in accordance with the New Hanover County Mason Inlet Management Plan and Environmental Assessment, the USACE Permit #19901052, and the N.C. Department of Environmental Resources Permit #151-01 (GBA, 2002). ATM conducted two partial physical monitoring surveys, one prior to and one during the construction phase of the relocation effort. Gahagan andBryant Associates, Inc. (Wilmington, N.C. Office), contracted by the county to execute quarterly physical monitoring surveys of the inlet system during the first year following relocation and bi-annually thereafter, began monitoring efforts in July 2002. The goal of this monitoring effort was to address the relocation’s impact on the neighboring oceanfront shoreline and the shoaling characteristics within the inlet system. Supplemental to these efforts, the USACE Coastal Inlets Research Program (CIRP) funded data collection in association with Erickson Consulting Engineers, Inc. (ECE) to monitor the circulation patterns in the backbarrier feeder channels and development of the ebb-tidal delta. USACE instruments deployed by ECE, at the time of writing this thesis, are no longer collecting data within the inlet system.
Previous Works
Inlet relocation, as a viable management option, is a relatively recently-employed technique that has been made available to coastal managers under site-specific conditions. Completed relocation efforts have exclusively dealt with migrating inlets that have posed some degree of threat to the surrounding coastal zone (usually near infrastructure) that borders an inlet. Relocation may be classified as a soft-solution management option. Rather than attempting to
force the system to behave in a manner unsuitable for the area, the operation works in tandem with the natural processes by artificially recreating the evolution of a migrating inlet. As a result, the environmental impacts on the surrounding system are diminished greatly by comparison to other hard stabilization techniques (e.g. jetty emplacement). Only a few examples of inlet relocation exist worldwide. The first relocation found in the literature was conducted on St. Augustine Inlet situated along the northeastern coast of Florida. This inlet was artificially relocated approximately 1,200 ft north of its original position in 1940. MARINO and MEHTA (1987) describe the morphologic changes of the ebb shoals and oceanfront shoreline associated with this project and the installation of a dual jetty structure between 1941 and 1957. Ironically, Mason Inlet is not the first small, microtidal inlet in North Carolina to be relocated. Tubbs Inlet was relocated in January of 1970. Unfortunately, no studies exist that deal with the morphologic and hydrodynamic evolution of the inlet. However, CLEARY and MARDEN (1999) determined that after a period of adjustment the inlet began to migrate opposite its historic migration
direction and the regional net littoral drift direction. This new migration trend continues to date. Although the reasons for it are not completely understood, reversal in migration direction is likely due to alterations in the interior feeder channel dominance (BUDDE and CLEARY, 2004). Stump Pass, a relatively small inlet situated between Manasota Key and Knight Island, Florida, was relocated 3,200 ft north in 2003 (MICHAEL POFF, pers. comm.).
Published studies dealing with monitoring the effects of relocated tidal inlets along U.S. and foreign coastlines are rare. Studies of the 1983 relocation of Captain Sam’s Inlet (mesotidal setting) near Charleston, South Carolina, include KANA and MASON’s (1988) study that monitored the evolution and growth of the ebb-tidal delta, and the KANA et al. (1987) study that determined a sediment budget for this system. However, as the inlet evolved it managed to
migrate back to its approximate 1982 position twelve years after the relocation (KANA and MCKEE, 2003). Consequently, another artificial relocation of the inlet occurred in 1996. Both inlet relocation efforts are summarized in KANA and MCKEE (2003).
The study of Ancão Inlet’s 1997 relocation, along the mesotidal, Ria Formosa barrier island system, in Portugal by VILA et al. (1999) determined that dramatic volumetric changes occurred during the first year of evolution, with the enlargement of the inlet and the formation of well-developed flood and ebb deltas. A more comprehensive study of the Ria Formosa system was undertaken by CONCEJO (2003) that expanded upon the relocation impacts on Ancão Inlet and included observations pertaining to the 1999 artificial relocation of Fuzeta Inlet. As a result of this study CONCEJO (2003) formulated assesment criteria for determining the success of an inlet relocation effort within the Ria Formosa system. According to the study and based on the assessment scale, the relocation of Ancão Inlet was considered a success. However, the Fuzeta Inlet relocation failed to meet the requirements necessary for a successful relocation effort because the area was soon plagued with the same problems it faced prior to the effort with the inlet swiftly migrating eastwardly. CONCEJO (2003) determined that the most important factor for a relocation action to suceed was the correct choice of where to reopen the inlet.
Studies such as these are extremely important because they serve as case-studies for future inlet modifications. The methods employed and the relative success of previous relocation efforts may be used to identify site-specific locations where inlet relocation may be viable. Also, the importance of relocation studies pertaining to an assortment of tidal settings (e.g. microtidal) will be beneficial to these efforts. Already, future inlet relocations are under consideration. For example, the details of a possible relocation of Fire Island Inlet along Long Island, New York, is provided by KRAUS et al. (2003). Although not a relocation, a feasibility study has been
completed on the potential reopening of Midnight Pass, a historically migrating inlet, along the Gulf coast of Sarasota County, Florida (DAVIS, et al., 1987; Erickson Consulting Engineers (ECE), 2003).
In order for an inlet relocation to be successful, an initial comprehensive study of the inlet's history must be accomplished incorporating as much of the historical data as possible. Additionally, certain fundamental parameters of an inlet system must be monitored as the new inlet system evolves to understand how relocation affects hydrodynamic and morphologic changes.
Regression analyses of related morphologic and hydraulic characteristics of tidal inlets have been relatively successful in modeling of inlet systems. These relationships between inlet parameters and processes have aided in the research of inlets worldwide (KANA et al., 1999). JARRETT (1976) refined LECONTE’s (1905) and O’BRIEN’s (1931 and 1969) relationship between tidal prism and inlet cross-sectional area. WALTON and ADAMS (1976) derived an empirical relationship between ebb delta volume and tidal prism.
Only recently has the relocation of an inlet become a viable solution for coastal
managers. Worldwide, limited studies exist that pertain to the impacts of inlet relocations. The study of Mason Inlet’s relocation provides a unique opportunity to further the understanding of the impacts that these efforts can impose on not only the neighboring shoreline segments but on the hydrodynamics and sediment budget affected by this process. Techniques utilizing ADCP, Real-time kinematic (RTK) global positioning system (GPS), and geographic information system (GIS) technologies were used in this study.
The approach of this study is based on interpreting and drawing meaningful conclusions from field data and derived values to track the performance of the system. Determining potential
relationships between specific inlet parameters and the applicability of those relationships to established regression analyses is a main tenet of the study. This study of Mason Inlet’s relocation is unique when compared to other studies that have collected data strictly from a monitoring and engineering objective. The study's analytical approach seeks to understand the individual processes impacting the system and relating them in order to understand the system as a whole.
METHODOLOGY
The investigation incorporated the detailed collection of photogrammetric,
topo-bathymetric, hydrographic, and tidal data. All tidal and topo-bathymetric data were referenced horizontally (North Carolina State Plane 1983) and vertically to NAVD 88. A Remote Data Systems’ Ecotone-80 model water-level meter was deployed within Banks Channel
approximately 2,400 ft from the inlet throat in order to determine the range and duration of tides (Figure 3). Water-level measurements were collected at ten-minute intervals within an internal data logger. The Microsoft® Excel™ software package was utilized in post-processing all tidal data for management and analysis. Identification of parameters such as Mean Sea Level (MSL); Spring, Neap, and mean tidal ranges; and flood/ebb flow durations, involved the filtration of data to determine successive high and low water levels.
ADCP and Flow Dynamics
A vessel-mounted RD Instruments® (RDI) Workhorse Monitor™ 1200 kHz ADCP was used in the collection of all flow data within the inlet throat, Banks Channel, and Mason Creek (Figure 3). This data collection process differs uniquely from the methodology employed by the
Figure 3. Post-relocation map depicting positions of ADCP transects, photographic baselines, bathymetric profiles, and water-level meters (TG-1). Profile 0 depicts the location of the inlet throat pre-relocation. ECE indicates the location of Erickson Consulting Engineers, Inc., instrumentation.
collaborative efforts of Erickson Consulting Engineers and the USACE for monitoring current velocities and water-level elevations within the estuary behind the inlet. The aforementioned group utilized three stationary, pole-mounted SonTek® Argonaut-SL™ (side-looking) current meters for long-term deployment (months). USACE/ECE instrumentation was located within Banks Channel, Mason Creek, and the AIWW (see Figure 3) and collected current velocities perpendicular to flow and water-level elevations at six-minute intervals while storing the data internally. Instrumentation was referenced vertically (National Geodetic Vertical Datum 1929 (NGVD 29)) and data were combined with numerical models to estimate discharge. Whereas, for the purposes of this study, a vessel-mounted ADCP was utilized during short-term
deployments (e.g. 7–14 hour periods) for measuring flow velocities and direction, cross-sectional area, water levels, and calculating discharge and flow volume. The inlet throat (Profile 1) was perceived as an extremely important location for data collection because a majority of inlet parameter relationships rely on throat measurements.
The RD Instruments® ADCP used in this study maintained the capability of being moored at a fixed position on a channel floor in order to gather continuous data (at a fixed time interval) similar to the technique utilized by the USACE/ECE group. However, vessel-mounting the instrument proved to be vastly more advantageous for the purposes of this study. Most importantly, a single ADCP was available for the extensive monitoring that was planned
throughout the entire system during a particular survey and consequently needed to be portable. The inherent risk to the instrument was perceived as too great when considering the extremely shallow nature (10 to 14 feet) of the inlet throat and the large volume of boat traffic that the inlet would experience during the study period. Another concern was the migratory nature of the inlet
and the eventual burial and perhaps loss of the instrument if the ADCP was moored on the ebb channel floor.
Initial ADCP surveys were limited to the inlet’s throat (Profile 1) and were later expanded to include the primary feeder channels, Banks Channel (Profile 2) and Mason Creek (Profile 3) (Figure 3). These surveys were centered on obtaining detailed flow data spanning one-half (12 hr 25 min) and one-quarter (6 hr 12.5 min) tidal cycles. The first two surveys captured one-half tidal cycles, while the remaining six surveys captured one-quarter tidal cycles. Variations in the tidal prism and cross-sectional area were obtained at the inlet throat. These variations are important for characterizing the inlet’s hydrographic nature. The primary feeder channels were surveyed in order to gain an understanding of flow distribution through the inlet system. Typical surveys included traversing each channel profile a minimum of four times every half hour from the onset of the survey until completion of the tidal stage of concern.
Each survey was conducted under varying fluctuations in tidal amplitude. However, surveys were conducted during periods when the predicted flood tidal range approximated the measured mean Spring flood tidal range of 4.00 ft. An emphasis was placed on measuring the flood duration of the tide in order to determine the tidal prism for a particular survey.
Consequently, seven of the eight surveys included data collection during a flood tide resulting in seven tidal prism values being calculated from flow data collected by the ADCP over the study period.
The ADCP directly measures channel parameters such as flow velocity, direction of flow, water levels, and depth. RD Instruments’® WinRiver™ software was used for the collection of all flow data. WinRiver™ calculated discharge in real-time and cross-sectional area as each profile was traversed across the channel (RDI, 2003). Summary files output by WinRiver™
allowed for further manipulation and post-processing of the flow data within Microsoft® Excel™. Calculated discharge data collected at each profile for the entire cross-section of a channel was manipulated to determine a mean discharge value for each half hour period of an individual field survey. The volume of water that flowed through a channel each half hour was estimated by multiplying 1,800 seconds with the corresponding mean discharge value. Duration of a flood tide was determined from flow speed and directional data. All calculated half hour volume values within a flood tide were then summed to calculate a total volume. This total volume is known also as tidal prism (TP).
Tidal prism, for the purposes of this study, is defined as the volume of water that enters an inlet on a spring flood tide (USACE, 2003), and cross-sectional area is the channel section under mean tide level (MTL) as determined with the ADCP.
Although the ADCP provides a relatively recent innovation in tidal inlet research data collection, several limitations associated with the instrument and data collection must be addressed. Shallow portions of a channel limit the measurements collected by the ADCP
because the instrument cannot consistently measure flow in depths usually encountered along the channel banks (RDI, 2003). Figure 4 depicts the central portion of a channel that is directly measured by the ADCP and the surrounding subsections that cannot be directly measured across a profile. These unmeasured subsections are not unique to the ADCP used in this study but are universal with the use of ADCP’s because the limitations are rooted in the technology of the instrumentation. Consequently, WinRiver™ interpolates the discharge through these
unmeasured subsections based on data gathered in the central measured section. Another limitation is the ADCP’s inability to measure flow when the conditions are such that the channel’s bedload is moving. Basically, the ADCP measures flow speed by determining the
Figure 4. Sketch illustrating the subsections of a channel measured and not measured by an ADCP.
doppler shift associated with transmitting sound at a fixed frequency and receiving echoes returning from sound scatters (e.g. sediment and plankton) in the water column. When the channel floor is moving the doppler shift is affected and creates a situation where the ADCP may over or underestimate flow speed. WinRiver™ informs the user if such a scenario exists and allows for the integration of a depth sounder and GPS in addition to the ADCP. A depth sounder is able to “hear” the true bottom while penetrating through the moving sediment whereas the GPS informs the ADCP as to where in space it is located. Combining these instruments with an ADCP allows for the measurement of flow under fast moving, turbid conditions.
Specific commands necessary for input into the ADCP depended on site-specific conditions of the inlet system, which included: maximum depth, salinity, water temperature, tranquil or turbid flow conditions, suspended sediment concentrations, and channel bedload characteristics. The Configuration Wizard within WinRiver's™ acquire mode allowed the user to define the parameters of the study area and define thecommands sent to the ADCP for the inlet system. A compass calibration was performed upon the ADCP in order to correct for local magnetic variation and for one-cycle magnetic deviation errors induced by ferrous objects (e.g. motor) near the ADCP. All ADCP data were collected in Water Profiling Mode 1, which was recommended for fast flow conditions of any depth with rough and dynamic situations. Due to the dynamic nature of the system modification to certain commands were performed if needed during a survey. All default commands (set by RDI) were used in configuration of the ADCP except for commands controlling depth cell size and number, blanking distance, salinity, and time between pings. Depth cell size and blanking distance were set to 0.82 ft, whereas depth cell number was dependent on depth, time between pings was set to 0.09 seconds, and the salinity was set for 35 ppt. The Power Method, within WinRiver™, estimated discharge measurements
for both the unmeasured top and bottom portions of the channel profile. Power extrapolation fits a power curve to the directly measured section of the water profile, and then uses this power law fit combined with Chen’s coefficient (0.1667) to compute the discharge in the unmeasured top and bottom subsections (RDI, 2003). Edge estimates of discharge along both shoulder margins were determined with the assumption that a triangular area shape existed between the final good ensemble and the channel bank edge. A ratio-interpolation method was used for estimating the velocity between the channel bank and the last known mean velocity determined by averaging water velocity in several ensembles.
Sources of error in the measured subsections include ADCP instrument error and flow variations through the inlet. MORLOCK (1996) determined that discharges in the top and bottom subsections are extrapolated from the measured subsections, resulting in discharge errors of similar magnitude for these estimated subsections. Based on the error equations for discharge measurement presented in MORLOCK’s (1996) paper, it was determined within the throat under a worst-case scenario that a total error of approximately 3% existed for this particular inlet. ADCP instrument error for the measured channel subsection was determined to be 11.6 ft3/s, whereas top, bottom, and opposing southwest/northeast edge subsection errors were 14.9 ft3/s,
2.2 ft3/s, 8.8 ft3/s and 146.5 ft3/s, respectively.
Ebb-Tidal Delta and Inlet Throat Topo-Bathymetric Analyses
Topo-bathymetric data collected by GBA was used in the measurement of throat
parameters and volumetric analyses of the system. GBA surveys covered an area encompassing the tidal creeks feeding the inlet, the main ebb channel, the shoreface updrift and downdrift of the inlet, and the ebb-tidal delta region offshore of the inlet. These data were initially referenced
to the vertical datum NGVD 29 and were converted to NAVD 88 with a conversion offset of -0.95 ft for New Hanover County (National Flood Insurance Program, 2003).
ESRI® ArcView™ GIS version 3.2 software was used to manipulate and display the referenced data. An extension of ArcView™, known as 3D Analyst™, allowed for the generation of digital terrain models known as triangulated irregular networks (TINs) based on these data. A TIN is used to represent a surface using contiguous, non-overlapping triangles. TINs are used for detailed, large-scale applications and were considered optimal for the purposes of this study. BYRNES et al. (2002) recommends that the TIN method be used for the creation of accurate model surfaces from topo-bathymetric data for calculating volume change and determining sediment transport patterns. A total of six topo-bathymetric data sets surveyed by GBA between March 2002 and October 2003 were supplied for analyses. Each data set was used for the generation of a TIN model and a corresponding topo-bathymetric map of the study area to be used in laboratory analyses. The March 2002 survey was completed between the 7th and 14th, the period between the new inlet’s opening and the old inlet’s closure, yet failed to measure the intertidal beach between the +4 ft and -6 ft contours 1,500 ft northeast and 1,700 ft southwest of the new inlet.
Measurements from these models, taken for the purpose of this study, focused on two main regions of the study area, the new ebb-tidal delta and the inlet throat. Profiles across the inlet throat were generated for each survey along Profile 1 to determine the channel's cross-sectional area, aspect ratio (width:depth), and wetted perimeter (Figure 3). Cross-cross-sectional area, channel width, and depth along Profile 1 were all measured at or below MSL (-0.31 ft). Wetted perimeter (WP) refers to the portion of the throat cross-sectional area’s perimeter that makes
Several studies describe a methodology for calculating the ebb-tidal delta volume by reference to idealized no-inlet bathymetric lines (DEAN and WALTON, 1975; WALTON and ADAMS, 1976; MARINO, 1986; STAUBLE, 1998). HICKS and HUME (1996) developed the residual method for analyses of ebb shoal shapes and volumes. In order to perform calculations on the ebb-tidal delta's volume, it is critical to define the boundary of the ebb shoal.
Unfortunately, standardized techniques to determine these boundaries do not exist (STAUBLE, 1998). Volume of the evolving ebb shoal was determined using a variation of the method described by DEAN and WALTON (1975) for estimating quantities of sand stored in outer shoals of inlets on sandy coasts. The method used for this study was similar to STAUBLE’s (1998) Residual Method.
The March 2002 bathymetric map of the inlet’s offshore region was utilized to construct an idealized no-inlet condition by assuming that the natural shape of the coast would mimic the parallel bathymetric lines updrift and downdrift of the inlet. Bathymetric lines of a common depth updrift and downdrift were then joined to follow the general parallel of the shoreline only in areas where field measurements were not obtained. An idealized “No-inlet” TIN was created based on this no-inlet bathymetric map and was used as a base-line surface from which all ebb shoal volumes were calculated. Utilizing the bathymetric maps created from each study area TIN, a delineation of the ebb shoal’s boundary was determined in the offshore region, allowing for the creation of a unique ebb-tidal delta TIN for each survey completed. For the purposes of this study, the boundary of an ebb shoal included a landward baseline across the inlet’s mouth, the updrift and downdrift shorelines, the seaward-most bathymetric line affected by the inlet, and the inflection points updrift and downdrift of the inlet. The 3D Analyst™ extension allowed each unique ebb delta TIN to be superimposed upon the “No-inlet” TIN in order for a cut-and-fill
analysis to be performed. The cut-and-fill analysis generates a new residual map depicting areas within the ebb shoal’s boundary that either lost or gained material based on the “No-inlet” surface. The volume gained within this area was considered to be the volume of the ebb shoal for a particular survey. This was the volume of material found above the March 2002 surface.
Flood Shoal
A short-term, six week monitoring study to track the migration rate and
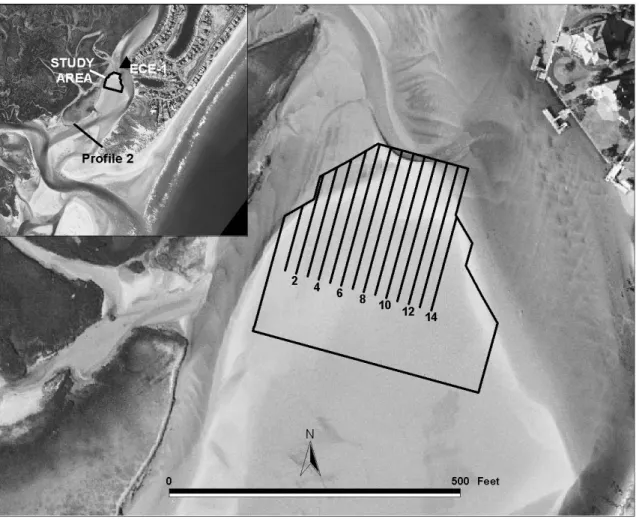
volumetric changes on the subaerial portion of a migrating sand shoal within Banks Channel was conducted during low tide conditions (Figure 5). The monitoring period lasted six weeks to effectively span a full lunar month and to ascertain the effects of both Spring and Neap tides on sediment transport within this section of the inlet system. Topo-bathymetric data were obtained with a Trimble® 5700 RTK-GPS system with surveys conducted once during each week of the study period. This instrumentation allows for the precise measurement of points upon the Earth’s surface that can be referenced to a variety of vertical datums and horizontal coordinate systems. All data were referenced vertically to NAVD 88 and horizontally to North Carolina State Plane 1983. A fixed grid consisting of thirty transects was established in order to survey a constant area (118,000 ft2) of the shoal each week. This portion of shoal was mapped by
walking and taking measurements every 2 feet along each transect.
All topo-bathymetric data were entered into ArcView™ 3.2 and manipulated with the 3D Analyst™ extension. The TIN surfaces with corresponding topo-bathymetric maps were
generated from the collected data from each field survey. The 3D Analyst™ extension allows the user to select a specific contour on a surface from which a volume can be determined above or below. An arbitrary base elevation of -3.58 ft was selected in order to compute the shoal
Figure 5. Vertical aerial photograph showing the Banks Channel flood shoal complex. The outlined area indicates the study area, whereas the numbered lines are the transects
volume above this plane and below a TIN’s surface. This elevation was chosen because it was the lowest elevation mapped consistently with the RTK-GPS. It should be noted that GBA collected topo-bathymetric data over the same shoal area. However, the spacing of their measurements was too great to derive anadequate estimation of volume change and bedform migration on this particular portion of the shoal. A cut-and-fill analysis was performed using this extension in order to check the validity of the volume estimates. Cut-and-fill analysis determines how much material has been lost or gained in a study area by comparing two digital terrain models of the area, one before a change and one after.
Using the topo-bathymetric maps a unique bedform feature (-0.58-foot contour) was selected as a marker to track the migration of the shoal. This contour was chosen because it closely approximated the shape of the bedform and was consistently mapped during the study period. A series of fourteen transects, directed along a northeastern orientation, was established across this feature (Figure 5). Utilizing another extension of ArcView™, Simple Change Analysis of Retrograding and Prograding Systems (SCARPS) version 2.04, the migration rates and position changes of this feature along each transect was determined (JACKSON, 2004).
Vertical Aerial Photographs
Eleven sets of vertical aerial photographs were selected, from various agencies, dating both prior to and following the relocation of the inlet in order to track changes in inlet position, opposing shoulder positions, inlet width, ebb channel orientation, and shoreline position along portions of Figure Eight Island and Wrightsville Beach (Table 1). These aerial photographs were partitioned to define a pre-relocation period (February 1998 to February 2002) and a
Table 1. List of vertical aerial photographic sets, associated agencies, scale and error.
Date Source Scale Average Error
(ft)
17-Feb-98 New Hanover County 1:12,000 2.15
19-Jun-98 NCDENR 1:12,000 Base Layer
11-Oct-00 U.S. Army Corps of Engineers 1:12,000 2.96
20-Feb-02 U.S. Army Corps of Engineers 1:12,000 3.31
16-May-02 U.S. Army Corps of Engineers 1:12,000 3.98
01-Aug-02 Gahagan & Bryant Associates, Inc. 1:12,000 1.84
14-Nov-02 Gahagan & Bryant Associates, Inc. 1:12,000 1.06
15-Jan-03 Gahagan & Bryant Associates, Inc. 1:12,000 2.10
10-Mar-03 U.S. Army Corps of Engineers 1:12,000 3.70
11-May-03 Gahagan & Bryant Associates, Inc. 1:12,000 1.86
31-Oct-03 Gahagan & Bryant Associates, Inc. 1:12,000 1.81
relocation period (March 2002 to October 2003), with utilization of topo-bathymetric data gathered in March 2002, was generated to track changes in inlet width, channel orientation, and position of the ebb channel and shoulder margins. Reasoning behind the formulation of two separate post-relocation periods was rooted in the incomplete data set for the March (As-built) 2002 survey. Topo-bathymetric data was lacking along the shoreline reaches 1,500 ft northeast and 1,700 ft southwest of the new inlet, however it included coverage of the excavated inlet channel. Although combining different data sets is generally not advised, the March 2002 topo-bathymetric data was included in an effort to generate a more robust data set and gain a better understanding of the immediate changes near the inlet channel.
GBA supplied rectified aerials with a 1.0-ft/pixel image resolution and required minimal manipulation prior to digitization. The North Carolina Division of Coastal Management
(NCDCM) performed orthorectification on photographs obtained from the Department of Transportation along this section of coastline yielding an image resolution of 0.5-ft/pixel. USACE aerial photographs were scanned at 600 dpi (resulting in a 1.6-ft/pixel image) and exported as uncompressed TIFF images. Simple rectification of these photographic sets within ArcView™ required a bilinear registration (2nd order polynomial), geo-referencing to a base
layer of 1998 digital orthophotos (NCDENR) in North Carolina State Plane 1983 coordinate system, and at least 10 to 15 ground control points per photograph.
The target average root-mean-square (RMSE) value for each of these photographs
remained below 15 ft of error. RMSE values are listed in Table 1 and represent the average error for each rectified photograph set. The high-water line (HWL) was selected as the primary
reference of shoreline position (DOLAN et al., 1978, 1980; PAJAK and LEATHERMAN, 2002). However, shoreline position errors include an amalgam of incorporated errors in
photographic quality, operator dexterity, and digitizing techniques. Previous work has determined worst-case error estimates for rectified aerial photography at approximately 25 ft (CROWELL et al., 1991). Error comprising this worst-case total included: distortion of air photos (3–7 ft of error), error delineation of the HWL from good quality air photographs (<16 ft), digitizer error (<1 ft), and digitizer-operator error (~8 ft).
Inlet width was measured between the opposing digitized shorelines for all photographic sets and along respective profiles delineated for the pre- (February 1998 to February 2002) and post-relocation (March 2002 to October 2003) periods. A contour map of the March (As-built) 2002 topo-bathymetric data allowed for the measurement of inlet width between the 2-ft contours located on opposing shoulders. The fixed pre- (Profile 0) and post-relocation (Profile 1) alongshore baselines approximate the position of the inlet’s minimum width, the migration trend direction, and follow the general orientation of the coast for each period (Figure 3).
Inlet position was determined for each photograph and the March 2002 topo-bathymetric data set by measuring the distance, along Profile 0 and Profile 1, from an arbitrary reference point to the center of the main ebb channel. Opposing shoulder positions, located on Figure Eight Island and Wrightsville Beach, along these baselines were also measured in the same manner. Positions were converted such that they refer to the position of the main ebb channel or respective shoulder margin on the February 1998 photograph and March 2002 topo-bathymetric map, which represent the initial positions for the pre- and post-relocation periods, respectively. Shoreline position was determined by delineation of the HWL along the southern end of Figure Eight Island and the northern end of Wrightsville Beach. An offshore baseline paralleling the coastline was erected and used to launch a series of thirty landward transects spaced at an interval of 400 ft while encompassing the inlet relocation zone and a 2.2-mile stretch along the
coast (Figure 6). The SCARPS extension of ArcView™ allowed for determination of shoreline change and migration rates for the periods prior to and post-relocation. All shoreline positions and rates were based on the initial data sets (February 1998 and May 2002) for the pre- and post-relocation periods. Various rates generated by SCARPS include the end point rate (EPR), linear regression rate (LRR), and average of end point rates (AER). For purposes of this study the EPR, commonly known as the net migration rate, was determined to effectively represent the migratory patterns of this system and consequently used for comparative purposes. Shoreline change trends were determined for the periods preceding and following inlet relocation. Net shoreline change refers to a positional change experienced between two shorelines; in contrast, cumulative shoreline change utilizes all shoreline positional changes instead of only two within a set period of time.
Correlation coefficients (Pearson-r, henceforth termed r) were calculated between inlet width and channel position, and cumulative inlet migration and cumulative shoreline change, and other parameters. Thus, possible relationships between these parameters were defined.
RESULTS Water-Level Data
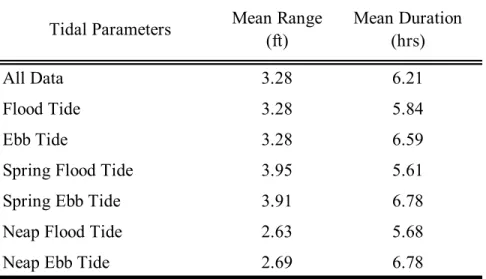
Data gathered from TG-1 in Banks Channel was used to determine tidal parameters such as MSL, durations, and ranges (Figure 3). Mean sea level was determined to exist at an elevation of -0.31 ft (NAVD 88) whereas mean high water and mean low water were 1.33 ft and -1.95 ft, respectively. Tidal ranges and durations under various tidal conditions are presented in Table 2.
Based on the classification scheme devised by HAYES (1979) and the measured mean tidal range of 3.28 ft, Mason Inlet falls within the extreme upper limit of the microtidal category.
Figure 6. Post-relocation map depicting shoreline transects (400-ft spacing) along Figure Eight Island and Wrightsville Beach.
Table 2. List of tidal data obtained from TG-1 located in Banks Channel.
Tidal Parameters Mean Range
(ft) Mean Duration (hrs) All Data 3.28 6.21 Flood Tide 3.28 5.84 Ebb Tide 3.28 6.59
Spring Flood Tide 3.95 5.61
Spring Ebb Tide 3.91 6.78
Neap Flood Tide 2.63 5.68
Neap Ebb Tide 2.69 6.78
Determination of mean flood duration (5.84 hr), based on water level readings, was found to be considerably shorter than the mean ebb duration (6.59 hr). Focusing on the Spring tidal phase, a similar trend occurred with the mean ebb duration lasting 1.17 hours longer than the mean flood duration (5.61 hr). As a final verification, the Neap tidal phase revealed a shorter mean flood duration of 5.68 hr when compared with the mean ebb duration of 6.78 hr.
Vertical Aerial Photographic Data Inlet Dimensional Data
Inspection of photographs revealed that a measurable degree of morphologic variability occurred within the inlet throat over the four-year period before relocation (Figure 7).
Emplacement of sandbags and geo-tubes along the southern margin of the inlet in 1997 stabilized the ebb channel and inlet throat, allowing for the width and cross-sectional area to adjust
accordingly. Between 1998 and 2000, 112 ft of continued elongation of the updrift spit due to migration reduced the inlet width from 1,122 to 1,012 ft. The net southwest elongation of the updrift spit during this four-year period was 341 ft. As a direct result of encroachment by the northern margin of the inlet and readjustment of shoals in the main feeder channel, the length of Banks Channel increased thereby lengthening the flushing distance between the inlet throat and the AIWW from 16,994 ft to 17,643 ft. Also during this period, noticeable movement and accumulation of sand within the inlet throat was noted. Immediately prior to relocation
(February 2002) inlet width measured 788 ft and the ebb channel floor had shoaled to a depth of -9.3 ft (NAVD 88).
Shoal complexes comprising the flood and ebb-tidal deltas also experienced morphologic changes that specifically relate to the variability within the inlet throat. Specifically, the shoal
Figure 7. Aerial photographs illustrating the shoaling trend within the feeder channels prior to relocation of the inlet. Note that scale is consistent for each photograph.
02-20-2002 10-11-2000 02-17-1998 06-19-1998 02-20-2002 10-11-2000 02-17-1998 06-19-1998 D C B A
of the ebb-tidal delta, defined on photographs by waves breaking around the perimeter of the shoal, experienced a 17% decrease in area after the bags were emplaced until the onset of the relocation project. Conversely, increases in sedimentation of the feeder channels and on the flood-tidal delta were particularly noticeable within the primary feeder channel of Banks Channel. The formation of large, well-developed shoal complexes accumulated predominantly within this channel and efficiently plugged Banks Channel over time. Throughout this period, Mason Creek was shoaled and considered unnavigable leaving Banks Channel as the only viable corridor between the waterway and ocean (Figure 7).
Examination of Figure 8 suggests that the feeder channels of the system continued to experience a high degree of sedimentation after relocation. Based on Figure 8, the shoaling nature is quite evident. The sedimentation basin, Banks Channel, and Mason Creek along with its intersection at the AIWW, all became choked with sediment within one year following the relocation project. Well-developed lobes of the flood-tidal delta can be observed extending within Banks Channel both north and south of the inlet's main ebb channel with lesser amounts of sediment developing point bars within Mason Creek. The development of two unique lobes within the portion of Banks Channel behind Figure Eight Island can be seen in Figure 8b where the lower portion of the channel was bifurcated into two separate connections with the main ebb channel. Spit development off Figure Eight's southern terminus resulted in coalescence of a lobe of the flood-tidal delta with the spit while forming one predominant channel within Banks
Channel (Figure 8c and 8d). Net Shoreline Change
Measurements focusing on net shoreline changes before (February 1998 to February 2002) and after the relocation (May 2002 to October 2003) indicated opposing accretion/erosion
Figure 8. Photographic set depicting a continued shoaling trend within the feeder channels after relocation of the inlet.
05-16-2002 03-10-2003 10-31-2003 04-24-2004 05-16-2002 03-10-2003 10-31-2003 04-24-2004 D C B A
trends at 20 of the 28 transects along the 11,600-ft coastal segment of concern (Figures 6 and 9). Although 30 transects were positioned along the 11,600-ft coastal segment monitored in this study, only 28 transects during the pre/post-relocation periods actually measured shoreline change. These gaps in the shoreline position data are attributed to the locations of the inlet channel prior to (Transects 12 and 13) and after relocation (Transects 18 and 19) where the shoreline was nonexistent. Overall, between 1998 and 2002, this segment experienced net accretion with erosion occurring at Transects 11 and 15 on the immediately opposing flanks of the inlet (Figure 9). Net accretion was measured on all other transects except, Transects 12 and 13, where the original inlet channel and swash platform existed.
Relocation of the inlet resulted in a distinct adjustment to the planform of the neighboring islands. A majority of the shoreline (22 of 28 transects) experienced net erosion (ranging from 6 ft to 549 ft of erosion) between May 2002 and October 2003 (Figure 9). Transects 11–13 were positioned within the original inlet zone resulting in an accretionary event of between 23–114 ft of shoreline progradation along this small segment as the old ebb shoal collapsed alongshore. The “shoreline bump” (Figure 10), seaward of the resort complex situated within Transects 4–10, experienced between 24–115 ft of erosion as the shoreline sought to assume a more uniform orientation in alignment with the new inlet conditions. Erosion along the 1,600-ft long
downdrift segment (ranging from 6–549 ft) and along the 4,400-ft long updrift segment (ranging from 74–140 ft) that flank the new inlet generally diminished with distance from the inlet.
Pre- and Post-Relocation Comparisons and Relationships
Mason Inlet’s preliminary evolution, in terms of width and position, is presented in Figure 11a. Position of the inlet refers to the intersection of the ebb channel's centerline with
ore and af
ter relocation of
the inlet. Positive values are indicative o
f net -6 0 0 -4 0 0 -2 0 0 0 20 0 40 0 60 0 1 2 3 4 5 6 7 8 9 10 111 2 131 41 5 161 7 1 81 92 0 212 2 2 32 42 5 2 6 2 7 282 93 0 T rans ect ( 4 00 -f oo t in te rv al ) Net Sh orel ine C han ge (ft) Pr e-Re loc a tion ( F eb-98 to F eb -02 ) Po st -R e loc at ion ( M a y-02 to O ct-0 3) O ld Inlet Zone Ne w In le t Zone M a son In le t R e lo ca tion W righ ts ville Beac h F igu re Eig ht I sland
Figure 10. Aerial photographs depicting the “shoreline bump” situated within Transects 4–10 along the northern portion of Wrightsville Beach. Notice growth of the feature during the four years prior to the relocation.
02-17-1998 02-17-1998
02-20-2002 02-20-2002