Southern Methodist University Southern Methodist University
SMU Scholar
SMU Scholar
Electrical Engineering Theses and Dissertations Electrical Engineering Spring 5-18-2019
Wireless Channel Characterization based on Crowdsourced Data
Wireless Channel Characterization based on Crowdsourced Data
and Geographical Features
and Geographical Features
Rita EnamiSouthern Methodist University, [email protected]
Follow this and additional works at: https://scholar.smu.edu/engineering_electrical_etds
Part of the Business Commons, and the Other Electrical and Computer Engineering Commons
Recommended Citation Recommended Citation
Enami, Rita, "Wireless Channel Characterization based on Crowdsourced Data and Geographical Features" (2019). Electrical Engineering Theses and Dissertations. 25.
https://scholar.smu.edu/engineering_electrical_etds/25
This Dissertation is brought to you for free and open access by the Electrical Engineering at SMU Scholar. It has been accepted for inclusion in Electrical Engineering Theses and Dissertations by an authorized administrator of SMU Scholar. For more information, please visit http://digitalrepository.smu.edu.
WIRELESS CHANNEL CHARACTERIZATION BASED ON CROWDSOURCED DATA AND
GEOGRAPHICAL FEATURES Approved by: Dr. Joseph Camp Associate Professor Dr. Dinesh Rajan Professor Dr. Michael Hahsler Assistant Professor Dr. Behrouz Peikari Professor Dr. Theodore Manikas Clinical Professor
WIRELESS CHANNEL CHARACTERIZATION BASED ON CROWDSOURCED DATA AND
GEOGRAPHICAL FEATURES
A Dissertation Presented to the Graduate Faculty of the Bobby B. Lyle School of Engineering
Southern Methodist University in
Partial Fulfillment of the Requirements for the degree of
Doctor of Philosophy with a
Major in Electrical Engineering by
Rita Enami
B.S., Islamic Azad University Central Tehran Branch, 2004 M.S., Amirkabir University of Technology, (Tehran Polytechnic), 2008
ACKNOWLEDGMENTS
I would like to thank my advisor, Dr. Joseph Camp, for his fantastic guidance, encour-agement, support, and inspiration over the years. He has set an example of excellence as a researcher, mentor, instructor, and role model. I would not be where I am today without the time and effort he spent throughout my studies, and I could not have imagined having a better advisor than him.
Also, I would like to thank Dr. Dinesh Rajan for his constructive comments, scientific advice, knowledge, and many insightful discussions and suggestions. Additionally, I would like to thank my committee members, Dr. Behrouz Peikari, Dr. Michael Hahsler, and Dr. Theodore Manikas for their great support and invaluable advice.
I am thankful for the collaborations and discussions within our research group, including Matthew Tonnemacher, Pengda Huang, Hui Liu, Pengfei Cui, Eric Johnson, Yan Shi, Mah-mood Badi, John Wensowitch, and Yazeed Alkhrijah. I especially thank my friends, Amin Mansoorifar, Ali Vafamehr, Mark Chatchaei, and Yan Shi who helped me to carry out the measurement for my research.
Thanks also go to the Electrical Engineering Department staff Mitzi Hennessey, Julie Bednar, Lorna Runge, Danielle Abraham, Christy Ahsanullah for their help.
I also thank my great friends for providing support and friendship that I needed. My spe-cial thanks go to Mahnza Shafiee, Ramak Ravanbakhsh, and Raha Salimi for their valuable friendship .
In particular, I would like to thank my family for their great support. I would like to express my deepest gratitude to my amazing parents for providing unconditional love, care, support, and constant encouragement over the years. I love them so much, and I could not make it this far without them. In particular, I would like to thank my sister. I love her deeply and thank her for all her advice and support.
Also, we would like to thank Rhode & Schwarz for their extensive support in this mea-surement campaign.
This work was in part supported by NSF grants: CNS- 1150215, CNS-1320442, and CNS-1526269.
Enami, Rita B.S., Islamic Azad University Central Tehran Branch, 2004
M.S., Amirkabir University of Technology, (Tehran Polytechnic), 2008
Wireless Channel Characterization based on Crowdsourced Data and
Geographical Features
Advisor: Dr. Joseph Camp
Doctor of Philosophy degree conferred May 18, 2019 Dissertation completed April 29, 2019
To design and plan wireless communication systems, an accurate propagation estimate is required of a deployment region. Propagation prediction models consist of two types of fading: large-scale and small-scale fading. With large-scale fading, the path loss information is crucial for cell planning, coverage estimation, and optimization. With small-scale fading, the statistical fluctuation on the local variations of the average signal level can have a dra-matic effect on protocol decisions and resulting performance. To obtain accurate estimates of both types of fading, typically field measurements are needed that use drive testing, which is expensive in terms of time and cost. Recently, LTE release 10 in 3GPP TS 37.320 has developed a Minimization of Drive Test (MDT) specification to monitor the network Key Performance Indicators (KPIs) via crowdsourcing.
In this approach, each User Equipment (UE) will be used as a measurement tool to provide the required performance measurement for the operators. MDT is a crowdsourced approach that does not increase the processing load of a UE, and the UE does little more than its regular network monitoring already required for cellular operation. The additional step required by the UE is to share these measurements periodically with the base station and network infrastructure. MDT requests the location information of the UE along with the KPI information in case that the GPS receiver is enabled. Many use cases have been defined for MDT such as coverage optimization, mobility optimization, capacity
optimiza-tion, parametrization for common channels, and Quality of Service (QoS) verification. In this thesis, we study the capability of the MDT to infer wireless channel characteristics.
However, mobile phones are not designed to function as a measurement tool. Namely, there are various imperfections induced by user equipment when sampling signal quality. To confidently use the MDT approach, we first need to understand the role that mobile phone imperfections have on wireless characterizations when compared to drive testing equipment. In particular, our focuses in this work consists of three fundamental concepts. First, we eval-uate the perceived channel quality in terms of the average loss from crowdsourced data using state of the art phones versus professional RF measurement tools. Specifically, we perform extensive experimentation across different mobile phone types, two pieces of software, and a channel scanner in three representative geographical regions: single-family, multi-family, and downtown areas. With these devices and in-field measurements, we evaluate the effects of averaging over multiple samples, uniform and non-uniform downsampling (in time and space), quantization, and crowdsourcing on the path loss exponent estimation.
Then, we design a model to use the crowdsourced data efficiently. We build a regional analysis framework to infer KPIs by establishing a relationship between geographical data and crowdsourced measurements. To do so, we use a neural network and crowdsourced data obtained by a UE to predict the KPIs in terms of the reference signal’s received power (RSRP) and path loss estimation. Since these KPIs are a function of terrain type, we provide a two-layer coverage map by overlaying a performance layer on a 3-dimensional geographical map. As a result, we can efficiently use crowdsourced data (to not overextend user bandwidth and battery) and infer KPIs in areas where measurements have not or can not be performed. Finally we study the capability of the MDT approach to estimate the fast fluctuations of the wireless channel which has rarely been addressed in prior studies. Estimating the multipath and fading characterization would help in different real-life scenarios such as channel characterization, link budget calculations, adaptive modulation, and geolocation applications, to enhance the network performance for the end user. However, currently this information is only achievable in a lab environment, and under controlled conditions.
A UE in an LTE network can measure the rapid fluctuations of the wireless channel condition using reference signals. MDT enables the UE to periodically send additional information to the transmitter according to the base station and infrastructure requirements. There is, however, concerns over battery consumption if the MDT reporting becomes too frequent, memory concerns if the reporting becomes too infrequent (and yet the recording level stays high), and privacy concerns over providing location information.
Also, a mobile phone may average over multiple samples of received signal quality, which might affect the instantaneous observations of the channel variations. In this work, we study the capability of MDT measurements to estimate the channel fluctuation characteristics in the presence of phone measurements shortcomings include averaging over multiple samples, imprecise quantization, and non-uniform and/or less frequent channel sampling. We use outage probability as the performance metric, which is a function of the wireless channel variation. Outage probability defines as the point at which the receiver power value falls below a threshold. This threshold is the minimum signal-to-noise ratio within a channel to have a certain QoS.
TABLE OF CONTENTS
LIST OF FIGURES . . . x
LIST OF TABLES . . . xii
CHAPTER 1. Introduction . . . 1
1.1. Summary of Thesis Contributions . . . 4
1.2. Thesis Overview . . . 6
2. Background . . . 7
2.1. WiEye: Free Android Base Spectrum Analyzer . . . 7
2.2. Acquiring Signal Measurements Using Advanced RF Measurement tools . . . 8
2.2.1. R&S TSMW Universal Radio Network Analyzer . . . 9
2.2.2. QualiPoc Android . . . 10
3. Pre-Crowdsourcing: Predicting Wireless Propagation with Phone-Based Chan-nel Quality Measurements . . . 11
3.1. Introduction . . . 11
3.2. Related Work . . . 15
3.3. In-Field Calibration of Received Signal Power from Mobile Phones . . . 17
3.4. Leveraging Mobile Phone Based Measurements on Path Loss Prediction . . . 20
3.4.1. Modeling Large-Scale Fading: Path Loss . . . 20
3.4.2. In-Field Analysis of Inferred Path Loss Across Region and Device Types . . . 21
3.4.3. Mobile Phone and Crowdsourcing Impact on Path Loss Estimation . 28 3.4.3.1. Averaging of the Received Signal Power . . . 28
3.4.3.2. Non-Continuous Measurement Periods . . . 30
3.4.4. Joint Analysis of Mobile Phone Factors on Path Loss . . . 36
3.4.5. Impact of Heterogeneous Mobile Phones and Users on Path Loss Characterization . . . 38
3.4.5.1. Calibrating Diverse Phone Models and Setup . . . 39
3.4.5.2. Inferring Path Loss Across Devices . . . 40
3.4.5.3. Inferring the Path Loss from Crowdsourcing . . . 41
3.5. Coverage Estimation Impact from Prediction Error . . . 43
3.6. Summary . . . 46
4. RAIK: Regional Analysis with Geodata and Crowdsourcing to Infer Key Per-formance Indicators . . . 48
4.1. Introduction . . . 48
4.2. Related Work . . . 51
4.3. Regional Analysis to Infer KPIs (RAIK) . . . 53
4.3.1. Data Acquisition Procedure for KPI Prediction . . . 55
4.3.2. Propagation Over Three Representative Region Types . . . 58
4.4. Prediction and In-Field Evaluation of KPIs . . . 60
4.4.1. MultiLayer Perceptron Components Used in RAIK . . . 60
4.4.2. Training and Performance Metrics of RAIK . . . 61
4.5. Performance of The RAIK Model . . . 62
4.5.1. The Results of the Phase ”A”: Two Dimensional Filter Calibra-tion . . . 62
4.5.2. The Results of the Phase ”B”: Extracting Effective Data Using a Cone-Shaped Filter to Improve Path Loss Prediction . . . 67
4.5.3. Performance of the Kriging Versus RAIK2. . . 73
4.6. Summary . . . 75
5. Channel Fading Estimation Using Geodata . . . 77
5.2. Fast Fading Estimation in the Presence of Non-Ideal data . . . 79
5.2.1. Characterization of Small-Scale Fading or Fading . . . 80
5.2.2. Experimental Set-up: Emulating the Fading Channel . . . 81
5.3. Fading Estimation Evaluation . . . 83
5.3.1. Averaging Impact on Outage Probability Estimation . . . 83
5.3.2. Uniform Downsampling Impact on Outage Probability Estimation . . 85
5.3.3. Non-Uniformly Sample Selection Impact on Outage Probability . . . . 85
5.3.4. Quantization of the Received Signal Power . . . 86
5.3.5. Impact of the Outage Probability Estimation Error On the Net-work Performance . . . 87
6. Future Work . . . 90
6.1. Future Work . . . 90
APPENDIX BIBLIOGRAPHY . . . 91
LIST OF FIGURES
Figure Page
1.1 Typical Rohde & Schwarz backpack for walk/drive testing (left) and TSMW
channel scanner (right) [30].. . . 5
2.1 Global Crowdsourced Data Using WiEye . . . 9
2.2 TSMW channel scanner from Rohde & Schwarz [30].. . . 10
3.1 Pre-processing and post-processing of collected data by channel scanner and
mobile phones.. . . 13
3.2 Signal quality data from three sectors around a base station (left) related
path loss exponents of each (right).. . . 24
3.3 Statistical distribution properties of RSRP based on device (a) and region
type (b). . . 26
3.4 Averaging impact on path loss exponent (γ) prediction.. . . 30
3.5 Impact of averaging on the γ estimation in terms of mean and standard
deviation in a period of 1 to 6 seconds.. . . 31
3.6 Uniformly downsampling the measurements of a sector in downtown (left)
and across all three regions (right).. . . 32
3.7 Non-uniform downsampling of a sector in downtown (left) and non-uniformly
downsampling in space compared to uniformly (right).. . . 34
3.8 Impact of spatial non-uniformly downsampling.. . . 35
3.9 Required number of measurements in uniformly and non-uniformly
down-sampling case. . . 37
3.10 Joint impact of mobile phone imperfections relatively (left) and per effect (right). 37
3.11 Impact of each mobile phone imperfection.. . . 38
3.12 Path Loss Analysis for Crowdsourced Data Sets in Four Different Regions. . . 42
3.13 Variation of γ in homogeneous region (single-family residential) at varying
3.14 Impact of theγestimation’s error on the cell area coverage probability estimation. 46
4.1 Regional Analysis to Infer KPIs (RAIK) Framework.. . . 54
4.2 3-dimensional map from same region using LiDAR. . . 57
4.3 RSRP from Downtown (left), single-family residential (middle), and multi-family residential (right) regions.. . . 57
4.4 Path loss exponent (γ) calculated over entire downtown region (left) versus a 200 m x 200 m sub-region (right). . . 60
4.5 Prediction in downtown adjacent sub-region.. . . 65
4.6 Adjacent sub-region analysis with Kriging Algorithm.. . . 66
4.7 Filter’s Angle Sizes for Different Regions.. . . 71
4.8 The reference area vs smaller and larger areas.. . . 72
4.9 Non-uniform data selection. . . 74
4.10 The impact of the clustered data on Kriging prediction performance. . . 75
5.1 Evaluation of Phone Measurement to Measure Fading. . . 79
5.2 Hardware Setup.. . . 83
5.3 Averaging Impact on Outage Probability.. . . 84
5.4 Uniform Downsampling Impact on Outage Probability.. . . 86
5.5 Uniform Downsampling Impact on Outage Probability.. . . 87
LIST OF TABLES
Table Page
2.1 Measured Metrics with Android.. . . 8
3.1 Field-tested range of reported signal quality (dBm) from channel scanner (TSMW), Qualipoc, and WiEye. . . 19
3.2 Average signal quality offsets (dBm) reported from Qualipoc and WiEye with matched channel scanner measurement. . . 19
3.3 Minimum and maximum observed path-loss exponent per region and corre-sponding geographical features. . . 23
3.4 Field-tested path-loss exponent per cell from channel scanner (TSMW) and corresponding geographical features.. . . 25
3.5 Path loss exponents inferred from mobile phone signal quality reported at the firmware (Qualipoc) and API level (WiEye) from total measure-ments versus those matched closest in time to that of the channel scan-ner (TSMW).. . . 27
3.6 Measurement tools configuration and field-tested range of reported signal quality (dBm) from channel scanner (TSMW) and WiEye of four phones. . . 39
3.7 Average signal quality bias reported from heterogeneous phones as reported by WiEye with matched channel scanner measurement.. . . 40
3.8 Path loss characteristics obtained by four devices in three modes: matched, aggregated, compensated mode.. . . 42
3.9 Field-tested path-loss exponent per cell from channel scanner (TSMW) and Corresponding Geographical Features.. . . 43
4.1 Impact of tile size on RAIK performance.. . . 63
4.2 Impact of Measurement Number in Propagation Prediction.. . . 64
4.3 RAIK with Homogeneous Training and Testing. . . 65
4.4 RAIK with Heterogeneous Training and Testing.. . . 67
4.6 Delay Spread Corresponds to Three Different Environment. . . 72
4.7 The impact of the one-shape filter angle on the RAIK2 performance.. . . 73
4.8 The impact of the input features on the NN performance.. . . 73
4.9 Comparing the Performance of the RAIK2 and Kriging. . . 75
5.1 Comparing the Error Imposed by Phone Imperfection on Outage Probability Estimation.. . . 87
Chapter 1 Introduction
Cellular network providers collect and analyze radio signal measurements continuously to improve network performance and optimize the network configuration. Available methods to obtain the signal measurements consist of drive testing, network-side-only tools, dedi-cated testbeds, and crowdsourcing [47]. The former three methods are extremely resource intensive. For example, one common approach for capturing radio signal measurements is to outfit a backpack with six mobile phones running various applications and network protocols alongside an expensive mobile channel scanner (see Fig.1.1) for network engineers to gather data on foot. Vehicles are often used for a greater number of and potentially higher-powered and more costly devices, allowing higher levels of mobility in a targeted region. In con-gested areas with various technologies (e.g., LTE, GSM, UMTS, and TETRA) the problem becomes worse: to get an acceptable quality of service, data collection should be repeated multiple times per roll out of each technology to appropriately configure the network [126]. Further complicating matters, physical changes to the environment such as construction of new buildings or highways can decrease the effectiveness of the obtained data. Estimation shows that the drive testing cost reached $961.2 million in 2016 and will touch $1.6 billion by the end of 2023.
An alternative and less-costly way to capture such Key Performance Indicators (KPIs) is crowdsourcing, as outlined in the Minimization of Drive Test (MDT) effort of LTE release 10 in 3GPP TS 37.320. MDT allows carriers to monitor the in-situ network performance of end users to detect variations of the provided Quality of Service (QoS) to perform such actions as handover, if the problem is confined to a single user, or self-organization, if the problem extends to one or more towers. The use case scenarios for MDT are determined as follows: coverage optimization, mobility optimization, capacity optimization, parametrization for
common channels, and QoS verification [53]. Coverage optimization contains some other use cases such as coverage mapping, detection of excessive interference, and overshoot coverage detection.
In MDT, the User Equipment (UE) is used as a measurement tool to log the signal quality measurements coupled with the location information of the user at the time of each measurement. Furthermore, a UE can log the signal measurements when either active or idle. Since the required signal measurements can be obtained from the regular Radio Re-source Management Process (RMP), MDT does not put a burden on a network regarding computational complexity or excessive battery consumption.
However, the mobile phones are not calibrated measurement devices. Hence, a first step in using crowdsourced data requires understanding the viability of mobile phones to replace more advanced measurement equipment as channel modeling probes. A phone possesses a number of shortcomings when compared to a channel scanner in reporting channel quality, such as: (i) averaging over multiple samples, (ii) coarse quantization, which can impose a unit step for minuscule changes,(iii) sampling at non-uniform intervals when crowdsourcing information as opposed to long, consecutive testing periods recorded when drive testing, and
(iv) clipping that results from less sensitive receivers with fringe network connectivity. In this work, we study the capability of MDT to estimate the channel characteristics. The propagation characteristics of a wireless channel consist of large- and small-scale fad-ing. Large-scale fading consists of two components: (i) path loss which is signal strength degradation as a function of distance and(ii) shadowing which happens due to large objects such as buildings and hills in the concerning region. We first study the accuracy of the perceived path loss characteristics by phone measurements in the presence of the aforemen-tioned phone measurement shortcomings versus a piece of advanced equipment (e.g., channel scanner). To do so, we perform extensive in-field experimentation to quantify the impact of each of these four effects when evaluating the viability of mobile phones to characterize the path loss exponent, a metric commonly used by carriers for deployment planning, frequency allocation, and network adaptation.
Furthermore, we address how efficiently we can use the crowdsourced data (to not overex-tend user bandwidth and battery) to infer the signal quality level in areas where measure-ments have not or can not be performed. It is well known that channel characteristics depend on the surrounding geographical features, though the relationship and correlation thereof has not be formalized to a large extent. Thus, we establish the relationship required by MDT ef-forts between geographical data and user-based data to improve the accuracy of the channel propagation estimation. Using our framework, Regional Analysis to Infer KPIs (RAIK), we predict the network coverage using neural networks alongside crowdsourced data collected by UEs with an overlaid LiDAR dataset in that same region. The prediction model is based on a feed-forward, back-propagation model, which employs multilayer perceptron (MLP) with the geographical features of a region to provide a KPI-based coverage map. To evaluate RAIK, we perform extensive in-field measurements from urban and suburban regions with diverse geographical features such as type, density, and height of the buildings and trees. RAIK forms a generalized framework that allows prediction of the KPIs in areas that have yet to receive crowdsourced channel quality measurements from users, relying solely on the terrain and clutter information of a given area.
Finally, we study the capability of phone measurements to estimate the fluctuations of a wireless channel. Small-scale fading or fast fading is the rapid fluctuation of the amplitude of received signal over a short period of time and distance. Fading is mainly caused by multiple paths of propagation, where more than one copy of the transmitted signal arrive at the receiver with random phases and various delays. The different copies are generated due to the reflection and scattering from objects like trees and buildings surrounding the transmitter and receiver. Fading estimation would help in different scenarios such as channel characterization, link budget calculations, adaptive modulation, and geolocation applications, to enhance the network performance for the end user. A UE in an LTE network can measure the rapid fluctuations of the wireless channel condition using reference signals. In LTE networks, the UE measures a reference signal every 0.5 milliseconds. With MDT, a UE can log these KPIs of the network to report them to the MDT servers immediately or periodically. However,
there are some limitations on the UE side to measure, log, and report the KPIs of the network regarding the memory, bandwidth, and battery usage. Also, a mobile phone may average over multiple samples of received signal quality, which might affect the instantaneous observations of the channel variations. We study the impact of the averaging and the number of signal samples on the accuracy of the fast-fading estimation in terms of outage probability, which is a function of the wireless channel variation.
1.1. Summary of Thesis Contributions
Mobile Network Operators need to perform ongoing signal quality testing to improve the network coverage perdition accuracy. Knowledge of the wireless channel is essential to accurately estimate the network coverage. However, performing signal measurements using drive testing, which is the common approach, is expensive in time, manpower, and equipment. During the last decade, on-device measurement or crowdsourcing has become an alternative approach to drive testing. Crowdsourcing provides large-scale network testing using distributed mobile phones. Furthermore, LTE release 10 in 3GPP TS 37.320 has developed a Minimization of Drive Test (MDT) specification to monitor the network Key Performance Indicators (KPIs) via crowdsourcing to reduce the time and cost of the drive testing.
In this dissertation, we analyze the viability and the accuracy of crowdsourced data to estimate the propagation characteristics of a cellular network, considering the large-scale and small-scale fading. Then, we establish a platform to use the crowdsourced data along with the geographical features to improve the accuracy of the propagation prediction model and channel estimation. Later, we study the capability of MDT measurement to estimate the fast-fading parameters.
The contributions of this thesis are as follows: First, we study the impact of various ef-fects induced by user equipment when sampling signal quality. These shortcomings include averaging over multiple samples, imprecise quantization, and non-uniform and/or less fre-quent channel sampling. We specifically investigate the accuracy of characterizing large-scale
Figure 1.1: Typical Rohde & Schwarz backpack for walk/drive testing (left) and TSMW channel scanner (right) [30].
fading using crowdsourced data in the presence of the aforementioned phone measurement shortcomings.
Secondly, we address how efficiently crowdsourced data may be used (to not overextend user bandwidth and battery) to infer the signal quality level (MDT or drive testing) in areas where measurements have not or can not be performed. To do so, we establish the relationship between geographical data of a region and corresponding channel characteristics. We improve the prediction accuracy of the model by considering the obstacles along the direct path from the base station to the mobile user that has a large effect on the propagation characteristics. Additionally, due to multipath, there is a width of this direct path that comes into question. The angle around this direct path might be larger or smaller depending on the degree to which the multipath delay spread exists in the environment and varies due to the region type. We optimize this angle using the delay spread information obtained from the concerning region.
Finally, we study the capability of MDT measurements to estimate the channel fluctua-tion characteristics in the presence of phone measurements shortcomings include averaging over multiple samples, imprecise quantization, and non-uniform and/or less frequent channel
sampling. We use outage probability as the performance metric, which is a function of the wireless channel variation. Outage probability defines as the point at which the receiver power value falls below a threshold. This threshold is the minimum signal-to-noise ratio within a channel to have a certain QoS.
1.2. Thesis Overview
The thesis is structured as follows. In Chapter2, we present background information on the hardware and software platforms used for the experiments. In Chapter 3, we quantify the impact of various effects induced by mobile phones when interpreting signal quality such as averaging over multiple samples, imprecise quantization, and non-uniform and/or less frequent channel sampling. In Chapter 4, we use a neural network and crowdsourced data obtained by a UE to predict the KPIs in terms of the reference signal’s received power (RSRP) and path loss estimation. In Chapter 5, we study the viability of MDT measurement to measure fast-fading parameters under different circumstances such as averaging over different numbers of samples, quantization, and less frequent channel sampling in a different fashion (uniform and non-uniform). Finally, we conclude in Chapter 6 and discuss future possible directions for this line of work.
Chapter 2 Background
The purpose of this study is to compare the ability of mobile phone measurements to measure wireless channel characteristics, captured either at the API level or the firmware level, to an advanced measurement tool, the channel scanner. Before doing so, in this section, we compare and calibrate the raw measurements provided by diverse mobile phones at different levels of the software stack with data provided by a channel scanner. API-Level Phone Data. At the API level, we modify our Android application WiEye, which we designed to crowdsource measurements, to log signal quality measurements at the highest sampling rate that the operating system will allow (1 Hz). Since WiEye can be installed on any Android-based phone, we can compare APIlevel measurements across a wide array of devices. In our study, we use four different mobile phones: (i.) Samsung S5, (ii.) Nexus 5, (iii.) Google Pixel, and (iv.) Samsung S8. While the former two phones are not the latest models, they provide a comparison across multiple generations, and the Samsung S5 is the phone that allows a firmware-based tool that we will now discuss.
In this chapter, we describe the background of our research, including the basic technology related to this work, the hardware and software tools that we used to conduct and evaluate our proposed approaches in this work.
2.1. WiEye: Free Android Base Spectrum Analyzer
For our research purposes, our wireless and communication team developed a smartphone application called WiEye which works as a spectrum analyzer. This application allows users to scan and collect signal measurements form different cellular technologies such as GSM, LTE, CDMA, WCDMA, and WiFi networks. From WiFi perspective, the application facilitates setting the routers wireless channel or simply viewing the potential interference of
other networks to the user.
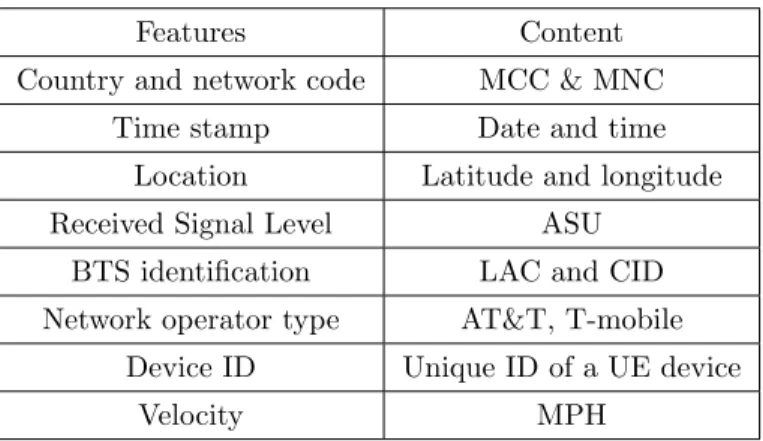
The application allows the users to opt into data collection for our research, covered by an Institutional Review Board (IRB). If the user opts into the research, the application on the users device will log RF measurements to our repository. The crowdsourced measurements are recorded periodically approximately ten times per day to be mindful of data usage and energy constraints of our participants’ phones. Each record includes the received signal level coupled with user’s coordinate in time of measurement. Table 2.1 contains the provided features by the application, such as the received signal level, the user’s coordinate, loca-tion accuracy, velocity, device ID, Mobile Network Operator’s name, and the base staloca-tion identification.
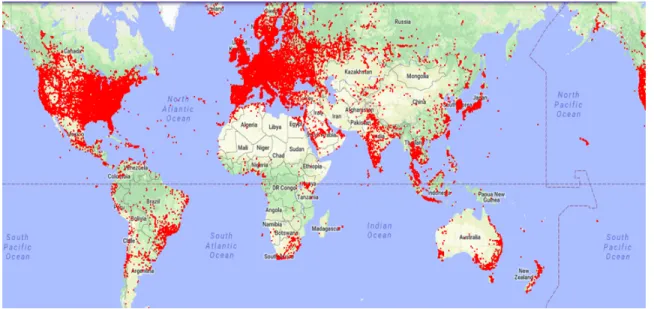
This publicly-available Android application has recorded measurements from voluntary participants to form a crowdsourced data set. We have captured more than 250 million num-ber of signal quality measurements from more than 60 thousands users worldwide. Fig. 2.1
shows the reported signal quality measurement for LTE technology. The dataset consists of the performance metrics from different technologies such as GSM, UMTS, WCDMA, and LTE.
To perform controllable measurement we developed a local version of WiEye to log the signal quality on the phone in a higher rate as 1Hz. Also we recorded the logs directly on the phone to avoid any confusion with our global data base.
Table 2.1: Measured Metrics with Android.
Features Content
Country and network code MCC & MNC
Time stamp Date and time
Location Latitude and longitude
Received Signal Level ASU
BTS identification LAC and CID Network operator type AT&T, T-mobile
Device ID Unique ID of a UE device
Figure 2.1: Global Crowdsourced Data Using WiEye
2.2. Acquiring Signal Measurements Using Advanced RF Measurement tools
Drive testing requires advanced RF measurement tools to carry out the measurements such as a channel scanner. In this work we evaluate the accuracy of the received signal reporting by mobile phones as compared to a two advance RF measurement tools include (i) a channel scanner (TSMW) and (ii) a smartphone-based RF optimization and service quality assessment application from Rohde & Schwarz company.
2.2.1. R&S TSMW Universal Radio Network Analyzer
The TSMW network analyzer depicted in Fig.2.2 includes of two antennas for any input frequency from 30M Hz to 6GHz, and a global positioning system (GPS) receiver. We control the equipment by a laptop while performing the drive testing. The channel scanner architecture is different with a mobile phone. It has a broadband RF front-end and a based band processing system, which is independent from any mobile phone chipset. So it can be configured to collect signal measurements from different technologies, such as LTE, GSM, and WCDMA in a certain frequency range simultaneously. The collected data by the scanner is post processed by using Rohde & Schwarz ROMES software.
Figure 2.2: TSMW channel scanner from Rohde & Schwarz [30].
2.2.2. QualiPoc Android
QualiPoc Handheld release 15.3 has been designed for handheld radio network optimiza-tion and quality assessment. This applicaoptimiza-tion supports different technologies such as GSM, GPRS, EDGE, WCDMA, HSDPA, HSUPA and LTE. Also, it can be installed on a variety of devices. Using QualiPoc we can collect data and voice services statistics. Using Qualipoc we can collect the Key Performance Indicators (KPI)s of the network such as Received Signal Level, Received Signal Quality.
Chapter 3
Pre-Crowdsourcing: Predicting Wireless Propagation with Phone-Based Channel Quality Measurements
3.1. Introduction
For configuration and maintenance of a wireless network, a regular monitoring of the wireless network is required. A conventional approach to collect data from mobile networks is drive testing which consumes enormous time and is expensive in terms of manpower and equipment. Within the last decade crowdsourcing has emerged as a competitive approach to drive testing.
While there is less control of the factors leading to a recorded channel quality, there are many advantages to crowdsourcing this information in terms of lessening the need for costly equipment, reduced in-field man hours, rapid scalability of data sets, and penetration into restricted physical locations.
However, mobile phones possess a number of shortcomings when compared to a channel scanner in reporting channel quality, such as: (i) averaging over multiple samples, which can flatten channel fluctuations [114] with manufacturer-specific methodologies to estimate the received signal power [22], (ii) coarse quantization, which can impose a unit step for minuscule changes, (iii) sampling at non-uniform intervals when crowdsourcing information as opposed to long, consecutive testing periods recorded when drive testing, and(iv)clipping that results from less sensitive receivers with fringe network connectivity. The accuracy of the received signal reporting by mobile phones as compared to a channel scanner was evaluated in [71], but the effect of averaging, the impact on path loss calculation, and the resulting coverage estimation impact was not considered. Hence, while a crowdsourcing framework for characterizing wireless environments would have tremendous impact on drive testing costs,
we believe that a first step in doing so requires understanding the viability of mobile phones to replace more advanced measurement equipment as channel modeling probes.
In this chapter, we study the impact of various effects induced by user equipment when sampling signal quality. These shortcomings include averaging over multiple samples, impre-cise quantization, and non-uniform and/or less frequent channel sampling. We specifically investigate the accuracy of characterizing large-scale fading using crowdsourced data in the presence of the aforementioned phone measurement shortcomings. To do so, we perform extensive in-field experimentation to quantify the impact of each of these four effects when evaluating the viability of mobile phones to characterize the path loss exponent, a met-ric commonly used by carriers for deployment planning, frequency allocation, and network adaptation. Our results indicate that the inferred propagation parameters by smartphone measurements in GSM and LTE networks is comparable to those obtained by the advanced equipment that are frequently used by drive testers (e.g., channel scanners). Finally, we an-alyze the impact of the path loss prediction error on a carrier’s misinterpretation of coverage area and predicted network throughput. In wireless networks, the percentage of coverage area is determined by a region over which the signal level exceeds the sensitivity level with a specified level of probability. This value is the likelihood of coverage at the cell boundary and a function of the received signal level. Therefore, an accurate network design will avoid possible gaps in the network (overestimating propagation) or interference in adjacent cells (underestimating propagation), which both affect the network throughput [64]. In particular, our work makes the following four contributions.
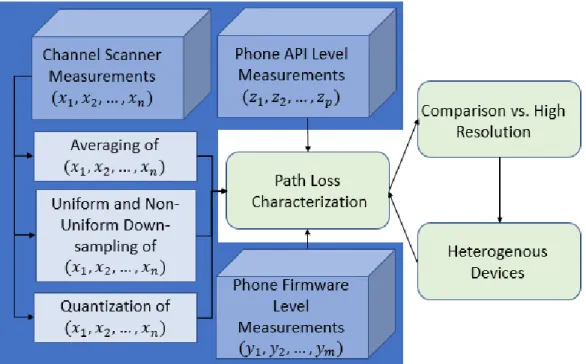
First, we set forth a framework to evaluate the impact of strictly using mobile phones (as opposed to a channel scanner) in propagation prediction. As depicted in Fig. 5.1, we consider how the averaging, uniform and non-uniform downsampling over time and space, and quantization of mobile phone channel quality samples at both the firmware and API levels affect the path loss characterization. At the API level, we have designed a freely-available Android application called WiEye, which can help users globally analyze spectrum in an economical manner. Additionally, WiEye functions as a crowdsourcing tool, which
has captured over 250 million signal quality measurements from over 60 thousand users worldwide (protected by an IRB). At the firmware level, we capture signal quality directly from the hardware via a Rohde & Schwarz tool called Qualipoc.
Figure 3.1: Pre-processing and post-processing of collected data by channel scanner and mobile phones.
Second, we compare the perceived channel quality across the channel scanner, multiple mobile phone models, and various levels of the software stack. To do so, we perform extensive local experiments across downtown, single-family residential, and multi-family residential re-gions and directly compare the received channel quality as reported by the channel scanner to mobile phone firmware-level and API-level data, where each mobile phone measurement considered has a corresponding channel scanner measurement for comparison. We initially observe that even over different sectors from the same base station in the same region type there can be a 0.4 difference in inferred path loss exponent and identify some of the geo-graphical features that are responsible for this variation. More generally, as compared with the path loss exponent calculated for each region based on the channel scanner, we find
that the firmware level measurements had an average path loss exponent estimation error of 0.06, 0.06, and 0.1 and API-level measurements had an error of 0.12, 0.13, and 0.11 for the single-family, multi-family, and downtown regions, respectively. This result considers the same number of samples from each device for direct comparison. Each prediction error occurred in the positive direction, meaning the value of the predicted path loss exponent from the mobile phone was greater than that predicted by the channel scanner data, an observation that can be used for future MDT calibration. We also examine the range over which each user-side device and software is able to receive cellular base station transmissions (i.e., their sensitivities) to understand where clipping of crowdsourced data might occur.
Third, we quantify the impact on inferring propagation characteristics from the various calculations and imperfections that mobile phones induce on received channel quality before reporting it to the user.
To do so, we consider numerous data sets from the channel scanner in the aforementioned environmental contexts and impose these imperfections to understand their role by evaluating against the root mean-squared error of path loss prediction from the original channel scanner data set in that region. Our results show that the path loss parameters obtained by mobile phone samples are sufficiently comparable to the advanced drive testing equipment, paving the way for crowdsourcing as a viable solution for in-field performance analysis.
Fourth, considering the fact that any error in path loss estimation will ultimately af-fect the coverage area estimation and Bit Error Rate (BER), we build intuition about the prediction errors reported throughout the previous sections of the chapter as they relate to network planners and operators by quantifying the impact on coverage estimation and user BERs. Since we observe path loss exponents ranging from 2 to 4 from our crowdsourcing platform, we consider a situation in which the actual path loss exponent is 3, but errors in prediction range from -1 to +1. In doing so, we allow a continuum of analysis about how much the network holes (overestimating propagation) or redundancy (underestimating prop-agation) might exist from the original targeted area. In particular, a modest propagation overestimation error of -0.4 (13% error) from an actual path loss exponent of 3 results in a
quarter (25%) of the targeted area having coverage holes in regions that were assumed to be covered. Conversely, the same modest propagation underestimation error of +0.4 from actual path loss exponent of 3 would result in a 40% overlap in the targeted coverage region. While the percentage of error is very small (-/+13%), the impact on coverage estimation is large. In terms of user BER, such a 0.4 prediction error frequently raises the BER by an order of magnitude for many situations (e.g., predicting 2.1 but an actual path loss exponent of 2.5, a relative error of only 16%, for an SNR of 15). In other words, at locations where there was assumed to be moderate to high SNR, the prediction errors can have a dramatic effect on user performance. For example, some services like video streaming require a spe-cific throughput. Small variations in throughput will increase the latency of live streams, especially at the cell boundaries.
The remainder of the chapter is organized as follows. We discuss related work in Sec-tion3.2. In Section3.3, we experimentally quantify the channel quality reporting differences of mobile phones versus a channel scanner. In Section 3.4, we analyze the role of mobile phone imperfections in terms of path loss prediction. Section3.5 relates path loss prediction error to coverage estimation for operational networks. Lastly, we conclude in Section 3.6.
3.2. Related Work
The Minimization of Drive Tests (MDT) initiative in the 3GPP standard has been cre-ated to exploit the ability of smartphones to collect radio measurements in a wide range of geographical areas to enhance coverage, mobility, capacity, and path loss prediction [2]. MDT is a crowdsourcing approach which enables a large-scale network testing using smart-phone. Crowdsourced data has already been utilized in some studies to identify network topology [27], perform real-time network adaptation [111], characterize Internet traffic [110], detect network events [19], fingerprint and georeference physical locations [96], assess the quality of user experience [60], and study network neutrality [33]. The bandwidth, latency, and throughput have previously been used as crowdsourced KPIs [102,114] to evaluate wide-area wireless network performance [44] and in-context performance [127].
Also, a few measurement studies have used API-level measurements to estimate different KPIs of cellular networks [51,86,102,114]. They each measured KPIs in terms of throughput, received signal power, and delay and involved regular users to provide measurements (i.e., crowdsourcing) across large geographical regions in some cases. In contrast, we focus on characterizing the wireless channel using diverse end-user devices at different levels of the software stack. Predicting the cellular network coverage by using the crowdsourced data has been studied in a few studies. For example, network coverage maps using crowdsourced data is studied in [74]. However, the authors provided the observed received signal level without a discussion of the differences across end-user devices. In addition, another work used a similar idea of using crowdsourced data along with interpolation techniques to predict the coverage area [78]. Although, the impact of location inaccuracy and data distribution of the interpolation techniques was investigated, the impact of the imperfections of end-user devices was not explored. In fact, [73] argued that [78] suffers from a lack of control and repeatability of capturing data and piggy-backing mobile broadband measurements onto public transport infrastructures.
Furthermore, others proposed the Bayesian Prediction method to improve the coverage estimation obtained by drive testing and MDT measurements, but the results were strictly based on advanced devices as opposed to mobile phone measurements [105]. The provided X-map accuracy from simulated data in [84] has been evaluated in terms of position inaccuracy, UE inaccuracy, and number of measurements. However, to analyze crowdsourced data, using in-field experimentation is important to distinguish between the performance of more advanced equipment versus a mobile phone in channels similar to those experienced by user devices. Furthermore, three major application scenarios for spatial big data obtained by performing MDT in a wireless network are depicted in [65]. Also, it has been shown that massive amounts of data needs a high-performance processing platform and solutions to obtain meaningful conclusions. Hence, [24,65] have focused on providing a platform to deal with big data regarding different applications. To estimate the channel quality, we are using RSRP as our metric from the LTE standard. It was previously observed by [22] that the
reported value by a mobile phone in terms of RSRP is influenced by averaging but did not consider the compounding effects. Similarly, [71] depicts that the received signal power by commercial phones is comparable to an advanced tool. While this is close in nature, we also consider many of the spatial and temporal downsampling effects that would cause imprecise estimation of the path loss estimation for a given environment and develop a carrier-focused intuition of the network and user impact of these errors.
3.3. In-Field Calibration of Received Signal Power from Mobile Phones
The purpose of this study is to compare the ability of mobile phone measurements, captured either at the API level or the firmware level, to an advanced measurement tool in characterizing wireless channels in terms of path loss. Before doing so, in this section, we compare and calibrate the raw measurements provided by diverse mobile phones at different levels of the software stack with data provided by a channel scanner.
API-Level Phone Data. At the API level, we modify our Android application WiEye, which we designed to crowdsource measurements, to log signal quality measurements at the highest sampling rate that the operating system will allow (1 Hz). Since WiEye can be installed on any Android-based phone, we can compare API-level measurements across a wide array of devices. In our study, we use four different mobile phones: (i.) Samsung S5, (ii.) Nexus 5, (iii.) Google Pixel, and (iv.) Samsung S8. While the former two phones are not the latest models, they provide a comparison across multiple generations, and the Samsung S5 is the phone that allows a firmware-based tool that we will now discuss.
Firmware-Level Phone Data. At the firmware level, we have purchased a software tool called Qualipoc from Rohde & Schwarz, which allows signal strength measurements to be reported directly from the chipset. Qualipoc can receive the channel quality information from many diverse technologies, such as LTE, GSM, and WCDMA. The sampling rate of the Qualipoc is approximately 3 Hz. Unlike the channel scanner, the mobile phones continuously search for the best visible base station by measuring the signal power received from multiple base stations, affecting both the API-level and firmware-level measurements.
Channel Scanner Data. To replicate the measurement process typically performed by drive testers, we use a commonly-used Rohde & Schwarz TSMW Channel Scanner for ob-taining detailed signal quality measurements. The TSMW can passively and continuously monitor numerous technologies in 30 MHz - 6 GHz frequency range, with a sampling rate of 500 Hz. The scanner is controlled by Romes software (version 4.89), which is installed on a laptop connected via an Ethernet cable to the TSMW.
In-Field Measurement Setup and Calibration. We conduct a measurement campaign across three diverse regions of Dallas, Texas with respect to terrain type: single-family residential, multi-family residential, and downtown. All five device types are connected to the same network operator for direct comparison and perform measurements in parallel on a co-located roof of a car. In each region, we observe cellular transmissions and record data from 11 total base stations.
We first quantify the signal quality sensitivities of each device for measurements taken at the same time and location. To do so, we applied a post-processing procedure on the entire collected data set. Since the sampling rate of the channel scanner is higher than that of Qualipoc (firmware) or WiEye (API), we extract the samples from the channel scanner data set, which are the closest in time to that of WiEye and Qualipoc. The matching process consists of two steps: (i.) grouping measurements based on the transmitting base station, and (ii.) downsampling channel scanner data to have the same number of samples as the Qualipoc and WiEye’s data set, where each mobile phone sample has a corresponding channel scanner measurement in time. If the channel scanner did not report a measurement within one second of the mobile phone measurement, we do not consider that data point in our comparison.
Table 3.1 shows the minimum, maximum, and range of the received signal power for all of these measurements across all cell towers in each region. As it is seen from the results, the widest range (77) and greatest sensitivity (-134 dBm) is captured by the channel scanner with the least range (71) and sensitivity (-128 dBm) captured by WiEye. The reduced range experienced by the mobile phone will cause some clipping on the extreme ends of the
connectivity ranges, especially with poor signal quality.
Table 3.1: Field-tested range of reported signal quality (dBm) from channel scanner (TSMW), Qualipoc, and WiEye.
Device Min Max Range Channel Scanner -134 -56 77
Qualipoc Phone -129 -55 74 WiEye Phone -128 -57 71
Next, we again consider this downsampled data set which matches the time stamps across devices to consider the difference in reported signal quality per signal quality sample across devices. Table 3.2 shows the difference of WiEye compared to the matched channel scanner measurement and Qualipoc compared to the matched channel scanner measurement across the three region types. This measurement shows the dBm offsets that mobile phones could induce on a crowdsourced data set as compared to more advanced equipment. We also report the mean reported signal strength per region for completeness.
Table 3.2: Average signal quality offsets (dBm) reported from Qualipoc and WiEye with matched channel scanner measurement.
Device Qualipoc WiEye Location dBm Diff. (Mean) dBm Diff. (Mean) Downtown -1.5 (-75.6) -4.4 (-78.5) Single-Family -1.3 (-82.5) -3.8 (-85.0) Multi-Family -1.9 (-78.4) -4.1 (-80.3)
We observe that the difference in reported received signal level is on average 1.57 dBm higher on the channel scanner versus Qualipoc across the three regions with a range of 1.3 to 1.9. In contrast, the difference in reported received signal level is on average 4.43 dBm higher on the channel scanner versus WiEye across the three regions with a range of 4.1 to 4.8. These dBm offsets could affect the path loss characterization as a higher reported
channel quality could lower the path loss exponent versus a lower reported channel quality which could raise the path loss exponent. In the following section, we will consider the role of these dBm offsets as well as multiple other mobile phone imperfections.
3.4. Leveraging Mobile Phone Based Measurements on Path Loss Prediction
One of the most common metrics which drive testers use to evaluate a given region is path loss. Since we ultimately want to use mobile phone measurements in a crowdsourcing manner to obtain this metric, we need to understand the role of mobile phone imperfections on evaluating the path loss of a given environment. In particular, reported signal quality from mobile phones will have the following effects: averaging, uniform and non-uniform downsampling, and different resolutions caused by quantization. In this section, we first provide some background on path loss modeling and then experimentally evaluate the role of these mobile phone imperfections on path loss estimation.
3.4.1. Modeling Large-Scale Fading: Path Loss
Large-scale fading refers to the average attenuation in a given environment for transmis-sion through and around obstacles in an environment for a given distance [97]. Path loss prediction models are classified into three different categories: empirical, deterministic, and semi-deterministic. Empirical models such as [57] and [87] are based on measurements and use statistical properties. However, the accuracy of these models is not as high as deter-ministic models to estimate the channel characteristics. These models are still widely-used because of their low computational complexity and simplicity. Deterministic models or geo-metrical models consider the losses due to diffraction, and detailed knowledge of the terrain is needed to calculate the signal strength [62,121]. These models are accurate. However, their computational complexity is high, and they need detailed information about the region of interest. Semi-deterministic models applied in [25] and [32] are based on empirical models and deterministic aspects.
In our study, we use empirical methods since it is the type of modeling that would be most appropriate to leverage crowdsourcing. The large-scale fading is a function of distance (d) between the transmitter and the receiver, and γ is the path loss exponent, where the path loss exponent varies due to the environmental type from 2 in free space to 6 in indoor environments. Some typical values are 2.7-3.5 in typical urban scenarios and 3-5 in heavily shadowed urban environments [97]. In this work, we focus on the inferred path loss exponent from mobile phone measurements and use a linear regression model to calculate the path loss exponent.
3.4.2. In-Field Analysis of Inferred Path Loss Across Region and Device Types
As discussed in Section 3.3, our experimental analysis spans three region types (single-family residential, multi-(single-family residential, and downtown) with multiple mobile phone types at the API-level (WiEye), with mobile phones at the firmware level (Qualipoc), and with a channel scanner (TSMW). All of these devices report which base station sector is transmit-ting the received signal. We performed the measurements while the car speed was maintained at approximately 20 mph. To avoid stopping at the traffic lights, we observed traffic light patterns, and we drove each route many times to record data regarding our requirements. In the future, we could consider predicting the future received signal strength concerning the UE speed and direction regarding the base station. To do so, we can record the compass data from the phone along with the signal strength, location information, and time stamp.
Since prior works have shown per region performance [97] and per sector performance can differ [44], we first analyze the variation of the path loss exponent from each region and each sector in three regions from the channel scanner to show some examples of the γ diversity. We consider the following three types of areas:
1. A downtown region containing tall buildings and trees, which are non-uniformly dis-tributed over the region.
2. A single-family area that is covered by a high density of foliage and mostly two-story buildings.
3. A multi-family area that has a mixture of vegetation and buildings of two stories or more in height.
Since path loss is not only a function of distance but is also affected by obstacles between the transmitter and receiver and environment type, we consider the geographical features in different areas to explain the variation of the observed path loss exponents (even within the same region type). For a more thorough investigation on the relationship between the geographical features and the role they play on propagation effects please refer to our recent work [34,112]. Here, we make the following observations:
i). Path loss slope varies in different region types: To study the path loss exponent’s variation in each region, we inferred all available γs corresponding to different sectors in each region. We eliminated the sectors with a low number of measurements as defined by the results in Fig. 3.9. We performed linear regression on each sector’s signal strength measurements independently to find the path loss exponent for that sector. Then, in each region, we select the sectors containing the minimum and maximum γ.
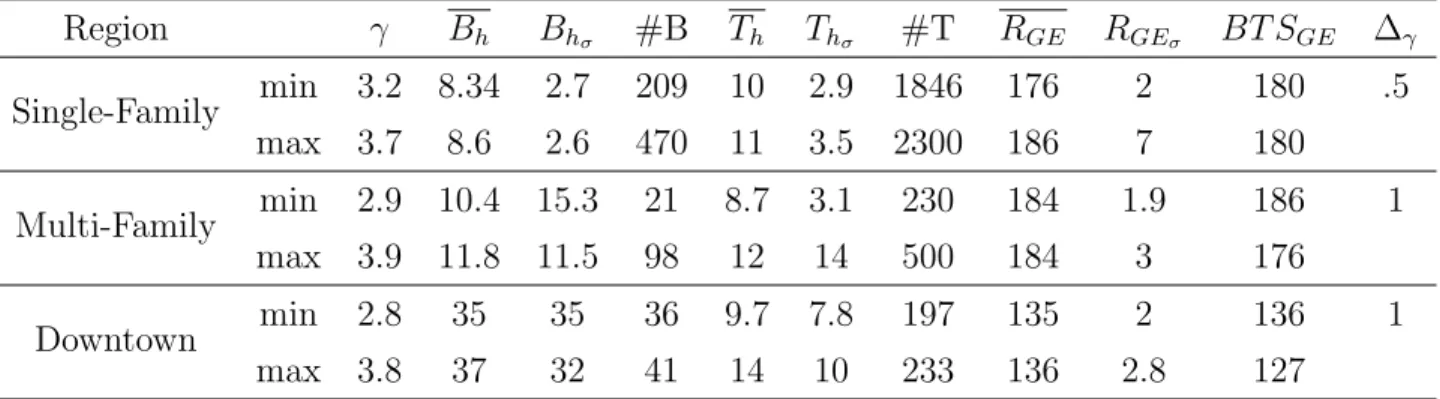
A received signal is a combination of transmitted signals, composed of reflected or scat-tered transmissions that are obscured by buildings or trees. Thus, the propagation environ-ment is profoundly influenced by the path loss and affects the network performance. The impact of the buildings would be more visible in an urban environment where a diversity in building height surrounds the UE. In this work, we considered three different area types to measure. Table 3.3 shows the minimum and maximum path loss exponent obtained using channel scanner measurements for a particular sector in each region. As we can see, there are differences between the path loss exponent readings from different regions. To enhance our understanding about these differences, we provide detailed information of the buildings and foliage corresponding to each region. To provide 3-dimensional geographical features of a region, we used a database of Light Detection and Ranging (LiDAR) information from that region. This dataset contains detailed information of buildings and trees as we discussed extensively in our recent work [34].
because the receiver height is typically lower than the clutter height. Therefore, we provide the average and standard deviation of object heights in that area. Here, Bh and Th depict
the average height of the buildings and trees and the standard deviation of these object heights for and γmax and γmin are depicted as Bhσ and Thσ, respectively. Furthermore, we
consider the number of objects (scatterers and reflectors) and ground elevation information of an area. The ground elevation information of the receiver and the transmitter would ultimately influence the difference between the clutter height and transmitter height. Table 3.3: Minimum and maximum observed path-loss exponent per region and correspond-ing geographical features.
Region γ Bh Bhσ #B Th Thσ #T RGE RGEσ BT SGE ∆γ Single-Family min 3.2 8.34 2.7 209 10 2.9 1846 176 2 180 .5 max 3.7 8.6 2.6 470 11 3.5 2300 186 7 180 Multi-Family min 2.9 10.4 15.3 21 8.7 3.1 230 184 1.9 186 1 max 3.9 11.8 11.5 98 12 14 500 184 3 176 Downtown min 2.8 35 35 36 9.7 7.8 197 135 2 136 1 max 3.8 37 32 41 14 10 233 136 2.8 127
We observe that downtown and multi-family regions report the highest variation range of the path loss slope. In the single-family area, there is not as big of a difference in the average and standard deviation of the object heights forγmax andγmin. However, the number of the
trees (#T) and buildings (#B) located in the sector corresponding to γmax is much higher
than the others. Furthermore, the ground elevation of the area is about 7 meters higher than the ground elevation of the base station in the γmax case. The range of the observed
path loss exponent in each environment is depicted by ∆γ, and the results show that the
variation in the path loss exponent of multi-family and downtown regions are higher than the single-family area.
ii. γ varies in different sectors of a particular base station (even in the same region type). We consider a particular base station consisting of three sectors in each region and
the corresponding geographical characteristics of each sector. Fig. 3.2a depicts the spatial distribution of signal strength measurements obtained from a channel scanner for a base station located in a single-family residential region. The measurement locations across the three sectors are represented by red dots. In Fig 3.2b, we see that the path loss exponent of sector (a) to sector (c) ranges from 3.1 to 3.4, even from the same base station.
(a) Measurements from a base station in the single family region.
(b) Regression line fit to the measurements of each sector.
Figure 3.2: Signal quality data from three sectors around a base station (left) related path loss exponents of each (right).
To generalize this behavior over multiple region types, Table 3.4 depicts the path loss exponent of three sectors of a particular base station in three different areas (downtown, single-family, and multi-family residential areas). The γ in the downtown area shows a higher variation (0.7) than two other regions with the multi-family and single-family areas having a value of 0.3 and 0.4, respectively. Furthermore, we can see that the small variations in average height of the objects in each region account for small changes in estimated γ because the taller objects around the receiver or in between the base station and the UE are more likely to scatter or reflect the signal. Also, in single- and multi-family areas, the number of objects located in a sector and near to the receiver has an impact on the path loss slope [90].
the multi-family and single-family areas having a value of 0.3 and 0.4, respectively. We can see that the small variations in average height of the objects in each region accounts for small changes in estimatedγ. Also, in single- and multi-family areas, the number of buildings and trees located in a sector has an impact on the path loss slope.
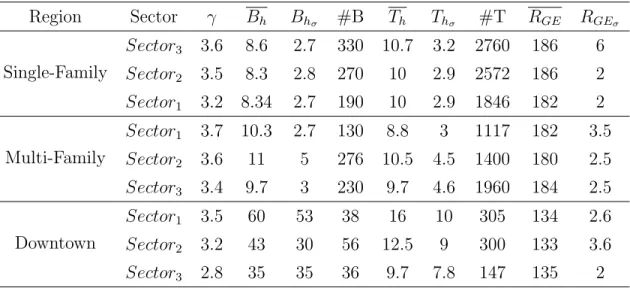
Table 3.4: Field-tested path-loss exponent per cell from channel scanner (TSMW) and cor-responding geographical features.
Region Sector γ Bh Bhσ #B Th Thσ #T RGE RGEσ Single-Family Sector3 3.6 8.6 2.7 330 10.7 3.2 2760 186 6 Sector2 3.5 8.3 2.8 270 10 2.9 2572 186 2 Sector1 3.2 8.34 2.7 190 10 2.9 1846 182 2 Multi-Family Sector1 3.7 10.3 2.7 130 8.8 3 1117 182 3.5 Sector2 3.6 11 5 276 10.5 4.5 1400 180 2.5 Sector3 3.4 9.7 3 230 9.7 4.6 1960 184 2.5 Downtown Sector1 3.5 60 53 38 16 10 305 134 2.6 Sector2 3.2 43 30 56 12.5 9 300 133 3.6 Sector3 2.8 35 35 36 9.7 7.8 147 135 2
iii. RSRP samples form diverse statistical distributions based on device and region types.
To depict the difference in received signal power between the channel scanner, firmware, and API level, we plot the distribution of the Reference Signal Received Power (RSRP) values obtained by each tool for a specific base station sector in Fig. 3.3a. We observe that the difference between the CDF’s median of the channel scanner (-77 dBm), Qualipoc (-78.8 dBm), and WiEye (-79.5 dBm) are about 1.8 dB and 2.5 dB, respectively. This difference is similar to that discussed in Table 3.1, especially for the firmware measurements but shows that the API level samples are subject to other effects such as averaging of samples, which will be explored in greater depth in Section3.4.3.1.
To evaluate the viability of a measurement sample size for each region, we use the Kolmogorov-Smirnov test (KS test), which attempts to determine if the samples come from the same distribution. There are two metrics with the test, h and p, which are the results
-140 -120 -100 -80 -60 -40
Received Signal Level
0 0.2 0.4 0.6 0.8 1 CDF Channel scanner Qualipoc WiEye
(a) CDF of RSRP of channel scanner versus Qualipoc and WiEye.
0 1000 2000 3000 4000 5000 Number of Measurements 0 0.01 0.02 0.03 0.04 0.05 P-Factor Downtown Multi-Family Single-Family
(b) The impact of decreasing the number of sam-ples on the KS value.
Figure 3.3: Statistical distribution properties of RSRP based on device (a) and region type (b).
of the hypothesis test at the default 5% significance level. In particular, h determines if the test is passed or failed, andpis the estimated significance for the specific test evaluated. An h flag will be reported as 0 (false) if the null hypothesis that the two distributions have a common distribution and cannot be rejected at the chosen significance level and concurrently does not have enough evidence to support the similarity.
In our application, if the number of measurements is too small to be representative of the region, the p value will be above a threshold of 0.05. Conversely, if p≤0.05, it signifies that there are a sufficient number of measurements to be confident in the path loss exponent prediction. In Fig. 3.3b, we show the p value of the KS test based on the measurement number per region type. In our case, when p ≤ 0.05, then h is always 1, which means the test passes for these values ofp. When the threshold is crossed, the number is approximately 600 samples for each region. Furthermore, the figure shows that decreasing the number of measurements in a single-family area has a lower impact on the KS value as compared to multi-family and downtown areas. This effect can be credited to the relative homogeneity of the geographical features in the single-family area as opposed to the more heterogeneous multi-family or downtown regions. We will extend this investigation on measurement number
size in Section 3.4.3.2, where we focus on the role of downsampling in both time and space from a very large number of measurements taken by the channel scanner.
iv. Matching the mobile phone samples in time to the channel scanner samples provides precise path loss exponent prediction. We now focus on a single mobile phone (Samsung Galaxy S5) to directly compare the path loss exponent inferred from the received signal quality reported at the API and firmware levels to that reported by the channel scanner in the same environment. We consider the most densely-measured sector from each region type in our comparison and calculate three different path loss exponents. First, we consider the path loss exponent γX as calculated from all measurements in the chosen sector for device
X, where X is T for TSMW,Q for Qualipoc, orW for WiEye. Second, we downsample the TSMW measurements according to the matching process mentioned in Section 3.3, where the TSMW measurement with the closest time stamp to the mobile phone measurement is chosen for Qualipoc and then for WiEye. This second calculated path loss exponent is represented byγQ0andγW0, respectively, and allows the path loss exponent to be considered
for the same number of measurements as Qualipoc and WiEye but with the signal strength readings from the TSMW. This approach inherently controls for the number of samples, which we later evaluate extensively.
These two γ values are shown in Table 3.5. By comparison across these path loss expo-nents, γT with γQ0and γW0, we observe that even when the same device is used (TSMW) to
capture the signal strength measurements, downsampling the number to match the mobile phones raises the estimate of the path loss exponent in every environment. This effect could Table 3.5: Path loss exponents inferred from mobile phone signal quality reported at the firmware (Qualipoc) and API level (WiEye) from total measurements versus those matched closest in time to that of the channel scanner (TSMW).
Region TSMW Qualipoc WiEye
Samples γT 4Q&T (dB) Samples γQ γQ’ 4W&T (dB) Samples γW γW’
Single-Family 2063 3.1 1.4 620 3.23 3.17 3.8 293 3.31 3.19
Multi-Family 1961 3.41 0.9 970 3.48 3.42 3.1 350 3.51 3.38
be explained by the inclusion of lower quality measurements (i.e., considering the measure-ments that were clipped from the mobile phone measuremeasure-ments), which in turn lowers slightly increases the value of the path loss exponent. Despite the consistently positive path loss ex-ponent error in prediction, the matchedγ values ofγQ0andγW0are within 0.06, 0.06, and 0.1
for the firmware level measurements and 0.12, 0.13, and 0.11 for the API-level measurements for the single-family, multi-family, and downtown regions, respectively. Therefore, match-ing the mobile phone measurements in time to the channel scanner measurements allowed highly-effective path loss exponent prediction, especially at the firmware level.
3.4.3. Mobile Phone and Crowdsourcing Impact on Path Loss Estimation
In this section we study the impact of different shortcomings with mobile phone mea-surements (averaging, temporal downsampling, and quantization) and imperfections that arise with crowdsourcing wireless signal strengths (non-uniform downsampling in both time and space) as opposed to drive testing in a known physical pattern with a known peri-odic sampling frequency in a particular region under test. In this subsection (3.4.3) and Section 3.4.4, we use signal strength samples from the channel scanner exclusively in our analysis and emulate each mobile phone imperfection in isolation to evaluate the impact of that effect.
3.4.3.1. Averaging of the Received Signal Power
Network interfaces often use some form of hysteresis to suppress sudden fluctuations in channel state that might lead to overcompensation in adaptive protocols. Many times this hysteresis is performed by averaging multiple received signal qualities before reporting it to the higher layers (e.g., within the firmware) and/or the user (e.g., within the operating system in support of API calls). Each device uses its own policy (often proprietary) to take a specific number of samples over a certain period of time. In particular, a mobile phone in an LTE network is required to measure the Reference Signal Received Power (RSRP) and Reference Signal Received Quality (RSRQ) level of a serving cell at least every Discontinuous
![Figure 1.1: Typical Rohde & Schwarz backpack for walk/drive testing (left) and TSMW channel scanner (right) [30].](https://thumb-us.123doks.com/thumbv2/123dok_us/10177820.2920129/21.918.230.689.129.377/figure-typical-rohde-schwarz-backpack-testing-channel-scanner.webp)