IDENTIFYING SPATIAL DATA NEEDS FOR CHAGAS DISEASE MITIGATION
by
EMILY R. MORRIS
A THESIS
Presented to the Department of Geography and the Graduate School of the University of Oregon
in partial fulfillment of the requirements for the degree of
Master of Science June 2015
THESIS APPROVAL PAGE Student: Emily R. Morris
Title: Identifying Spatial Data Needs for Chagas Disease Mitigation
This thesis has been accepted and approved in partial fulfillment of the requirements for the Master of Science degree in the Department of Geography by:
Christopher Bone Chairperson
Derrick Hindery Member
and
Scott L. Pratt Dean of the Graduate School
Original approval signatures are on file with the University of Oregon Graduate School. Degree awarded June 2015.
© 2015 Emily R. Morris
THESIS ABSTRACT Emily R. Morris
Master of Science
Department of Geography June 2015
Title: Identifying Spatial Data Needs for Chagas Disease Mitigation
The objective of this thesis is to analyze how existing data can address Chagas disease transmission risk in South America given data availability. A literature review was conducted to determine prominent variables that models use to assist with Chagas disease mitigation efforts, followed by a Web search to collect publicly available spatial data pertaining to these variables. The data were then used to create maps of data availability and in an agent-based model to identify which variables are most associated with disease transmission risk. Data availability varied widely across South America, and model results indicate that datasets related to household size and spatial housing arrangement are most important to Chagas disease infection in urban areas. Governments can use this
information to better direct their resources to collect data and control the spread of
triatomine vectors and Chagas disease more effectively and potentially identify more cost-effective strategies for vector elimination.
CURRICULUM VITAE NAME OF AUTHOR: Emily R. Morris
GRADUATE AND UNDERGRADUATE SCHOOLS ATTENDED: University of Oregon, Eugene
Appalachian State University, Boone, North Carolina
DEGREES AWARDED:
Master of Science, Geography, 2015, University of Oregon
Bachelor of Science, Geography, 2013, Appalachian State University
PROFESSIONAL EXPERIENCE:
Teaching assistant, Department of Geography, University of Oregon, Eugene, 2013-2015
GRANTS, AWARDS, AND HONORS:
Graduate Teaching Fellowship, Geography, 2013 to present
G. Herbert Stout Undergraduate Award, North Carolina GIS Conference Outstanding Paper Competition, North Carolina Center for Geographic Information and Analysis (NCCGIA), 2013
Julian Yoder Scholarship for Geography, Department of Geography and Planning, Appalachian State University, 2012
Phi Kappa Phi Undergraduate Research Grant, The Honor Society of Phi Kappa Phi, Appalachian State University, 2012
PUBLICATIONS:
Morris, E. and C. Bone. Under first review. Identifying Spatial Data Needs for Chagas Disease Mitigation. Submitted to “Spatial and Spatio-temporal Epidemiology”.
ACKNOWLEDGMENTS
I would like to thank my adviser Chris Bone, committee member Derrick Hindery, and fellow lab members Lauren Tierney, Seth Kenbeek, Nathan Mosurinjohn and Michael F. Nelson.
TABLE OF CONTENTS
Chapter Page
I. IDENTIFYING SPATIAL DATA NEEDS FOR CHAGAS DISEASE
MITIGATION ... 1 1. Thesis Overview ... 1 2. Introduction ... 2 3. Methods ... 6 3.1. Variable Identification ... 6 3.2. Data Search ... 7 4. Results ... 9 4.1. Identifying Variables ... 9 4.2. Data Collection ... 11 5. Discussion ... 13 6. Conclusion ... 26
II. IDENTIFYING SPATIAL DATA NEEDS FOR CHAGAS DISEASE MITIGATION THROUGH AGENT-BASED MODELING ... 27
1. Introduction ... 27
2. Methods ... 30
3. Results ... 40
4. Discussion ... 45
5. Conclusion ... 49
III. THESIS SUMMARY ... 50
LIST OF FIGURES
Figure Page
1 Total number of available datasets important to Chagas disease risk by
country ... 13
2. Resolutions of housing datasets important to Chagas disease risk ... 17
3. Resolutions of housing datasets important to Chagas disease risk ... 18
4. Resolutions of migration and age datasets important to Chagas disease risk ... 19
5. Resolutions of migration and age datasets important to Chagas disease risk ... 20
6. Model setup with a house distance of 100 meters ... 41
7. Model runs 1-25 with a house distance of 100 meters ... 42
8. Model runs with migration probability at 100% ... 43
9. Model setup with a house distance of 500 meters ... 44
10. Model runs 26-50 with a house distance of 500 meters ... 45
11. Model runs 51-75 with a house distance of 1,000 meters... 46
12. Model runs 76-100 with a house distance of 1,500 meters... 46
LIST OF TABLES
Table Page
1. Identified variables associated with Chagas disease risk ... 14 2. Values for each parameter as varied in the model runs ... 40
CHAPTER I
IDENTIFYING SPATIAL DATA NEEDS FOR CHAGAS DISEASE MITIGATION
1. Thesis Overview
The objective of this thesis is to analyze issues of spatial data availability and collection prioritization regarding Chagas disease transmission risk in South America. The research was completed in two parts. Section 1 represents a study concerning data availability on variables associated with Chagas disease risk. This study involved a literature review to determine prominent variables that models utilize to assist with efforts to mitigate Chagas disease. Next, a Web search was performed to collect publicly available spatial data pertaining to these variables for the countries in South America. The data were classified based on type and spatial extent, which were then used to create maps of data availability of variables related to Chagas disease transmission. This section has been submitted as a manuscript to the journal Spatial and Spatio-temporal Epidemiology for publication. Section 2 focuses on investigating how variables identified in Section 1 affect human infection rates. An agent-based model was
developed to determine which risk factors are most important to Chagas disease risk in urbanizing areas in South America. Governments can use this information to better direct their resources to collect data and control the spread of triatomines and Chagas more effectively, and potentially identify more cost-effective strategies for eliminating triatomine vectors. The model and findings were presented at the 2015 annual meeting of the Association of American Geographers in the New Directions in Geospatial
Simulation session. Finally, a brief summary is provided that describes how these two sections can be used to better inform data collection on Chagas disease.
2. Introduction
Chagas disease (American trypanosomiasis) is a potentially life-threatening illness to humans caused by Trypanosoma cruzi (T. cruzi), a parasite that obtains food from hosts in order to survive. It is transmitted to humans by triatomine insects (also known as ‘kissing bugs’) from the Reduviid family that feed on the blood of mammals. The disease is found mainly in Latin America, where it is endemic to 21 countries, and is responsible for approximately 12,000 human deaths per year (Pan American Health Organization 2011). Chagas disease has been a medical and social problem since the 1940s and has increased in its severity due to the urbanization of rural populations in Latin America (Coura and Viñas 2010). Wild triatomines exist outside of urban areas and have progressively adapted to human dwellings by creating domestic colonies in mud walls and roofs. Domestic colonies have been the target of vector control programs in order to interrupt the transmission of Chagas from insects to humans. Triatomines usually bite humans while they are asleep, feeding on their blood, and then defecating in the wound, the last step of which transmits T. cruzi and infects humans with Chagas. Disease transmission has been successfully interrupted in Brazil, Uruguay, Chile, as well as in large areas of Argentina, Bolivia, Paraguay, and in parts of Central America (Schofield et al. 2006). This is a result of large control initiatives implemented in the past fifteen years in the Southern Cone, Central American, and Andean Pact divisions of the Pan American
Health Organization (PAHO), which focuses on elimination of domestic diseases as well as blood donor screening and maternal screening for infection.
While some control initiatives have been successful, approximately 40 million people are still at risk for Chagas across Latin America (Schofield et al. 2006). Decentralization of Chagas control efforts from national government to the state, provincial, and municipal levels poses a risk to effective vector control and disease surveillance (Schofield et al. 2006). Since the late 1980s, the majority of the operations in health systems in the Southern Cone region have taken place on the municipality level, which are within larger regions like states or provinces where the coordination and consolidation of data takes place (Dias 2007). This makes maintaining control activities difficult in these decentralized health systems without an international institution like the PAHO who can remain involved with technical and political staff inside countries and can coordinate efforts between countries (Dias 2007). Some centralized approaches such as the Southern Cone Initiative (SCI) were successful in helping countries maintain their control initiatives and systemize data collection, which substantially reduced disease transmission by triatomine vectors. However, Chagas disease is emerging in areas that were previously considered free of the disease and in areas where disease control was in progress. This makes strengthening epidemiological surveillance and information systems crucial to successful elimination of the disease (WHO 2014).
In addition to decentralization of control efforts, the spatial heterogeneity of Chagas disease also presents challenges for vector control programs (Gürtler et al. 2007; Gürtler 2009). Parasitic diseases like Chagas often have uneven spatial and temporal distributions. However, control programs have historically applied homogenous control
strategies including pyrethroid insecticides, which have been used for vector control of Chagas disease since the mid-1980s (Gürtler 2009). Insecticide applications to infested homes aim to control Chagas disease by eliminating triatomine vectors (Rojas de Arias et al. 2004). Insecticide applications in control programs usually involve an initial spraying on houses and their surrounding structures, with a subsequent application six to twelve months later (Wilson et al. 2005). However, these strategies do not consider the spatial heterogeneity of Chagas disease which is governed by varying geographic, cultural, and political domains (Gürtler et al. 2007; Gürtler 2009). For example, the living conditions favorable to Chagas disease vectors are linked with poverty in rural areas, and clusters of highly infested homes are associated with low income areas that rely on a subsistence economy (David E. Gorla et al. 2009). These living conditions typically include mud-and-thatch or mud-and-stick building materials favorable for T. infestans (Gürtler 2009). The use of different building materials in different areas would cause the effectiveness of insecticide applications to vary spatially. Furthermore, political support for control programs such as insecticide spraying vary over time due to frequent changes in health authorities and heads of vector control programs, and vary over space due to due the different political domains across South America. For example, vector control programs in Paraguay and Chile have been centralized, while the program in Argentina has been partially decentralized since the 1980s, and programs in Brazil and Bolivia are fully decentralized (Gürtler 2009). Additionally, there is a political tendency to give priority in disease control to urban areas over rural areas (Dias 2007). Due to the spatial
heterogeneity of the disease and its governing domains, more adequate data collection at national and regional levels is needed for continued vector control. Currently, no
international system exists on a continental scale to monitor and compile epidemiological data (Schofield et al. 2006), making spatial heterogeneity of data availability a barrier to successful elimination of Chagas disease in South America.
Monitoring of Chagas disease also varies spatially across South America. Monitoring typically includes observing infection rates and surveying presence of triatomine insects in homes. However, even finer resolution data, such as the province-wide data available in many countries, hides heterogeneities in the distribution of infestation and infection in the averages reported by disease control programs (Gürtler 2009). In a study of the Colombian government’s survey to determine the distribution of Chagas disease risk, Guhl et al. (2005) identified variability of risk within the municipality scale at which the data for the survey were collected. Aggregating data to the municipality level like this could result in high risk villages being ignored if they are located in a low risk
municipality. Therefore, improvements in spatial data collection across the continent and at a fine resolution on variables associated with Chagas disease risk are needed to identify high risk areas and target control resources.
The objective of this study is to determine the current state of publicly accessible spatial data that can be utilized for mitigating Chagas disease in South America. First, a literature review is conducted to determine the variables most important for vector infestation. These variables then guide a Web search for publically available data sets on these variables for each country in South America to help determine which countries are best suited for determining the risk of vector transmission. The data for each country is analyzed based upon the quantity of available spatial data, the variables for which spatial data exists, and the spatial resolution at which data is collected. This study examines if
spatial data pertaining to Chagas disease exists consistently across South America at a resolution adequate for addressing spatial heterogeneities of the disease. The analysis informs a set of recommendations provided in the discussion section on how government agencies could deal with data needs relating to Chagas disease.
3. Methods
3.1. Variable Identification
A literature review was conducted during the period between May and September 2014 to identify variables associated with Chagas disease risk by vector transmission in South America where the disease is endemic. Studies on congenital transmission of Chagas or transmission from blood transfusions were excluded because this study is focused only on vector transmission of the disease. First, a Web of Science search was performed using the following parameters: Topic = “Chagas disease” AND topic = “South America.” This resulted in several papers that identified housing, domesticated animals, migration, and urbanization as important variables for Chagas disease risk (Briceño-León 2007). Next, the keywords: Topic = “Chagas disease” AND topic = “Risk” were searched to find other variables that might influence Chagas disease risk. These two searches provided a set of studies that were then used to refine the search. The search terms “sylvatic” and “reinfestation” were obtained from Noireau et al. (2005), who studied sylvatic and domestic populations of triatomines in the Bolivia and discussed how they may affect vector control efforts. This study found that wild populations of
triatomines were more widespread in some countries than previously thought, and called for more studies on recolonization of insecticide-treated villages to investigate the potential role wild triatomines play in reinfestation. The search terms “dispersal” ,
“peridomestic”, and “reinfestation” were obtained from Abrahan et al. (2008; 2011) who identified dispersal methods for triatomines and found that peridomestic structures may affect recolonization of homes, and from Cecere et al. (2004) who analyzed reinfestation patterns following insecticide sprayings in rural Argentina. The search term “Chaco” came from Gorla et al. (2009) who identified the Chaco as an area in the Southern Cone countries of Bolivia and Argentina where vector transmission had not been successfully reduced by vector control programs.
Variables were identified from the results of these literature searches. The variables were determined to be important for the objective of our study if at least two studies identified them as important to Chagas disease risk. These variables then informed the subsequent spatial data search.
3.2. Data Search
The data search was conducted between August and November 2014, during which time government websites for each country in South America were searched for their latest census data. If a website did not have data for some or all of the variables, a search engine was used to search the internet twice, first using the country’s name and the name of the variable, then using the country’s name and the term “census data.” Results were excluded if they did not come from a government website, a website with government census data, or a website of an agency without an established housing survey. Data were then downloaded at the finest spatial resolution available, but the data had to be available on a national scale in order to be mapped. The data were downloaded in the available format that would allow for mapping of the variables. In addition, the United States’
Demographic and Health Surveys (DHS) program website was searched for variables identified as influencing risk. The DHS program has survey data relating to housing quality that is useful for determining Chagas disease risk. This program is funded by the United States Agency for International Development (USAID) and seeks to collect data to be used in policy formation, program planning, and monitoring and evaluation (DHS Program 2014). Over 90 countries are represented in these surveys and data are available at the national and sub-national region scale. Spatial datasets of two variables related to housing material can be downloaded from their STATcompiler website available at http://www.statcompiler.com/.
The data were downloaded and analyzed to obtain the important variables identified in the literature review along with the spatial extent of coverage and spatial resolution for each country. Due to the different spatial resolutions of administrative areas by which the data are aggregated in each country, the mean areas of the spatial extents of data collected were calculated to provide a standardized method for comparing data
availability between countries. These data were brought into a geographic information system (GIS) where they were merged for the entire continent for each available variable. These data were then converted to raster data format based on the presence or absence of data to compare data availability for all variables by country. A value of 0 was assigned to cells with no data and a value of 1 was assigned to cells that had data for that variable. The raster datasets were then compiled to produce a final map of available data for determining Chagas disease risk for the continent. By analyzing the data this way, we can determine which countries are best able to address Chagas disease risk based on available data, as well as determine which countries are lacking data. ArcGIS 10.2.2 (Esri
2014), Excel (Microsoft 2010), and GNU PSPP (Free Software Foundation, Inc. 2014) were used to process the data.
4. Results
4.1. Identifying Variables
A review of literature on Chagas disease vector transmission indicates that housing quality and building materials are important factors in infestation and reinfestation rates. Chagas disease has been linked to poverty due to the tendency of insect vectors to live in thatched roofs and adobe walls typically associated with poor housing (Pan American Health Organization 2011; Briceño-León 2007; Schofield and Marsden 1982). The cracks in adobe (mud-brick) walls and spaces in thatched roofs made of vegetation such as palm leaves provide favorable habitats for triatomines. Also, type and condition of wall surfaces determine lasting effectiveness of pyrethroid insecticide spraying, which can remain effective for three to nine months (Rojas de Arias et al. 2004). Mud or adobe walls are not ideal for lasting effectiveness, but some studies have demonstrated a
decreased risk with stucco or plaster. Levy et al. (2006) suggest rooms must be
completely stuccoed to be effective, and that other uncoated materials like mortared brick are more likely to harbor triatomines.
Several studies identified peridomestic structures as potential habitats for triatomines. Peridomestic structures are any buildings separated from the home where humans live including storerooms, separate kitchens, and chicken coops (Cecere et al. 2004). Frequent exchange of triatomines can occur between peridomestic and domestic areas (Abrahan et al. 2008). Castañera et al. (2003) and Levy et al. (2006) identified kitchens, store-rooms, goat-pens, chicken coops, and guinea pig enclosures as important structures.
The building materials of the peridomestic structures are also a factor, as Levy et al. (2006) found that wire mesh enclosures were 20% less likely to be infested with triatomines that were infected with T. cruzi than other materials. Conversely, stacked brick or adobe structures were significantly more likely to be infested. In addition, peridomestic structures are exposed to the elements and therefore the effects of insecticide spraying are much shorter than in domestic areas (Cecere et al. 1997).
In addition to peridomestic structures, the presence of animals inside the structures or inside households may increase the risk of Chagas transmission because they can serve as hosts for triatomines and their enclosures can provide suitable habitats for the insects. These animals include dogs (Noireau et al. 1997) , chickens (Noireau et al. 1997; Gürtler et al. 1997; Castañera, Aparicio, and Gürtler 2003), goats (Castañera, et al. 2003;
Abrahan et al. 2011), pigs (Cecere et al. 2004), and guinea pigs (Levy et al. 2006). Levy et al. (2006) found that rooms were almost twice as likely to contain T. infestans if an animal slept in the room. Additionally, several studies found that inclusion of animals in their models influenced triatomines populations and Chagas disease prevalence.
Castañera et al. (2003) found that the presence of even one hen brooding inside a house increased the population size of triatomines, and Devillers et al. (2008) found that
inclusion of reservoir hosts was necessary to obtain realistic simulation results of disease prevalence.
Human migration is another variable associated with Chagas disease risk. Gourbière et al. (2008) concluded that vector populations cannot persist in domestic areas without immigration by wild populations. This makes urbanization associated with human migration a potential risk for disease transmission due to urban areas expanding into wild
triatomine habitats. Urban areas where human populations are close to wild triatomines may increase infectivity of T. cruzi, so the disease should not just be considered a rural health problem, but a complex system where triatomines migrate between rural and urban areas with human mobility (Medrano-Mercado et al. 2008). Migration is also important in more rural areas including the Amazon, where new land-use patterns such as non-indigenous agriculture and cattle-raising allow for domestic transmission of Chagas disease where previous land occupation patterns had been unfavorable for colonization by triatomine vectors (Briceño-León 2007).
Finally, human age is associated with Chagas disease risk (Samuels et al. 2013; Velasco-Hernández 1994). Samuels et al. (2013) found that age was significantly
associated with the likelihood of infection of T. cruzi in a multivariate model, and found a high prevalence of the disease in children aged two to fifteen which they concluded was likely a result of vector-borne transmission. Similarly, Velasco-Hernández (1994) found a strong correlation between presence of children in households and prevalence of T. cruzi vectors in their population dynamics model. Children may sleep in the same room as dogs or cats, increasing their risk of infection (Bowman et al. 2011), and may play with triatomines and not recognize them as a health threat (Velasco-Hernández 1994).
4.2. Data Collection
Twenty variables were identified as being important for determining Chagas disease risk. Datasets for these variables were available for eleven of the thirteen countries in South America: Argentina, Bolivia, Brazil, Colombia, Ecuador, French Guiana, Guyana, Paraguay, Peru, Uruguay, and Venezuela. Suriname did not have any
of the identified data sets, and Chile’s census data had been taken offline at the time of the study. Bolivia’s statistics database server was not working at any time during the study, but some data for the country were available from USAID. Additionally,
Venezuela had data available at the parish level, but there were no spatial data available of these areas, so data for the larger municipality level were used. The datasets for each variable were available at different administrative levels ranging from the smallest (parish and Neighborhood Democratic Council (NDC)) to the largest (country). Information on each variable is presented in Table 1.
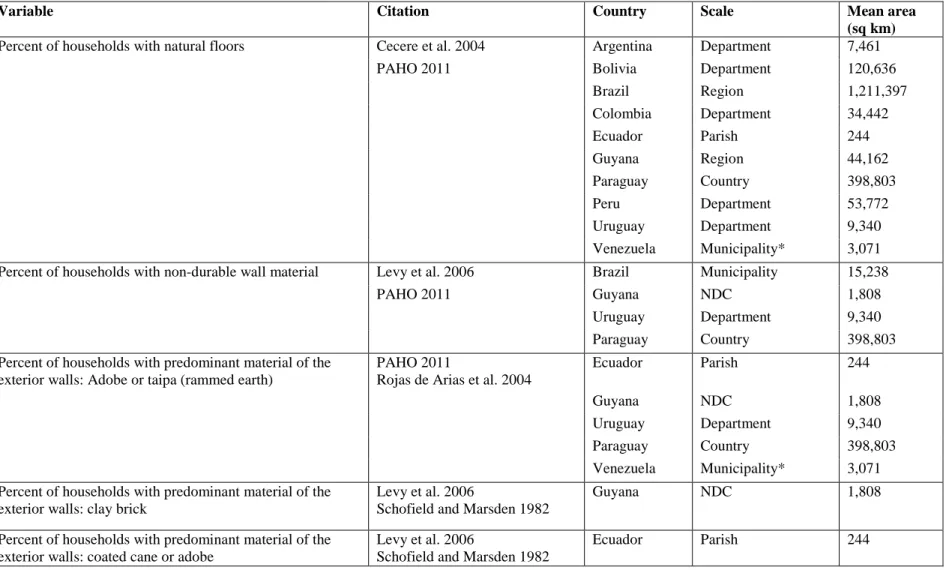
Figure 1 shows the total number of datasets available for each country in South America. Figures 2-5 show the highest resolution data available for each variable from each country. Ecuador had the most datasets available (ten) for determining Chagas disease transmission risk and had these variables at a very fine scale (parish level). Uruguay and Guyana also had many datasets available at fine scales, with Uruguay having nine available datasets at the department scale and Guyana having seven available at the NDC level. Paraguay also had seven available datasets, but these data were only available at the countrywide scale. The remaining countries had four or fewer datasets available. Only Peru had available data on animals present in households, but this data could not be incorporated into the GIS because it was aggregated by natural region.
The location attribute of the data was listed as either “jungle,” “mountain,” “coast,” or “metropolitan Lima,” natural region, without any other spatial reference. The different scales of the available data for each variable can be seen in Figures 2-5. For these maps, the mean area of the dataset was subtracted from the total area of the country, then divided by the total area of the country. Values closer to one indicate finer spatial
Figure 1. Total number of available datasets important to Chagas disease risk by country. The map shows the final result of the addition of the
resolution, and values closer to zero indicate coarser spatial resolution. These show the finest resolution at which data on each of the variables were available by country. Figures 2 and 3 show variables related to housing and Figures 4 and 5 show variables related to migration and age. In most cases, the finest resolutions were at small administrative levels such as municipalities or at the larger province or department administrative divisions.
5. Discussion
The results of this study indicate substantial variation between countries in the
availability of spatial data related to Chagas disease risk across South America, and suggest that the countries of Ecuador,
Uruguay, and Guyana are better situated to determine risk based on amount and scale of available data. Ecuador had the most datasets and also had the finest resolution of data with an
average spatial resolution of 244 square kilometers per unit area. All other countries’ datasets were available at less detailed
Table 1. Identified variables associated with Chagas disease risk
Variable Citation Country Scale Mean area
(sq km)
Percent of households with natural floors Cecere et al. 2004 Argentina Department 7,461
PAHO 2011 Bolivia Department 120,636
Brazil Region 1,211,397 Colombia Department 34,442 Ecuador Parish 244 Guyana Region 44,162 Paraguay Country 398,803 Peru Department 53,772 Uruguay Department 9,340 Venezuela Municipality* 3,071
Percent of households with non-durable wall material Levy et al. 2006 Brazil Municipality 15,238
PAHO 2011 Guyana NDC 1,808
Uruguay Department 9,340
Paraguay Country 398,803
Percent of households with predominant material of the exterior walls: Adobe or taipa (rammed earth)
PAHO 2011
Rojas de Arias et al. 2004
Ecuador Parish 244
Guyana NDC 1,808
Uruguay Department 9,340
Paraguay Country 398,803
Venezuela Municipality* 3,071
Percent of households with predominant material of the exterior walls: clay brick
Levy et al. 2006 Schofield and Marsden 1982
Guyana NDC 1,808
Percent of households with predominant material of the exterior walls: coated cane or adobe
Levy et al. 2006 Schofield and Marsden 1982
Ecuador Parish 244
Table 1. (continued)
Percent of households with predominant material of the exterior walls: uncoated cane
Levy et al. 2006 Paraguay Country 398,803
Ecuador Parish 244
Percent of households with a thatch roof PAHO 2011 Uruguay Department 9,340
Briceño-León 2007 Argentina Department 7,461
Ecuador Parish 244
Guyana NDC 1,808
Paraguay Country 398,803
Percent of population born outside municipality Medrano-Mercado et al. 2008 Briceño-León 2007
Brazil Municipality 15,238
Where did census respondant live five years ago: in this city or parish
Medrano-Mercado et al. 2008 Briceño-León 2007
Ecuador Parish 244
Where did census respondant live five years ago: in another place of this department
Medrano-Mercado et al. 2008 Briceño-León 2007
Uruguay Department 9,340
Where did census respondant live five years ago: another place in the country
Medrano-Mercado et al. 2008 Ecuador Parish 244
Briceño-León 2007 Uruguay Department 9,340
Venezuela Municipality* 3,071
Peru Department 53,772
Where did census respondant live five years ago: in another country
Medrano-Mercado et al. 2008 Ecuador Parish 244
Briceño-León 2007 Uruguay Department 9,340
Annual net migration Medrano-Mercado et al. 2008
Briceño-León 2007
French Guiana Country 83,593
Percent of respondants that are Immigrants Medrano-Mercado et al. 2008 Briceño-León 2007
Peru Department 53,772
Household owns goats Castañera et al. 2003
Abrahan et al. 2011
Peru Natural region
Table 1. (continued)
Household owns chickens Castañera et al. 2003 Peru Natural region
Gurtler 1997
Household owns poultry Castañera et al. 2003
Abrahan et al. 2011 Gurtler 1997
Peru Natural region
Household owns pigs Cecere et al. 2004
Levy et al. 2006
Peru Natural region
Household has guinea pig enclosures Levy et al. 2006 Cecere et al. 2004 Briceño-León 2007
Age Samuels 2013 Argentina Department 7,461
Velasco-Hernández 1994 Bolivia Department 120,636
Brazil Municipality 15,238
Colombia Department 34,442
Ecuador Parish 244
French Guiana Commune 3,967
Guyana NDC 1,808
Paraguay Country 398,803
Peru District 712
Uruguay Department 9,340
Venezuela Municipality* 3,071
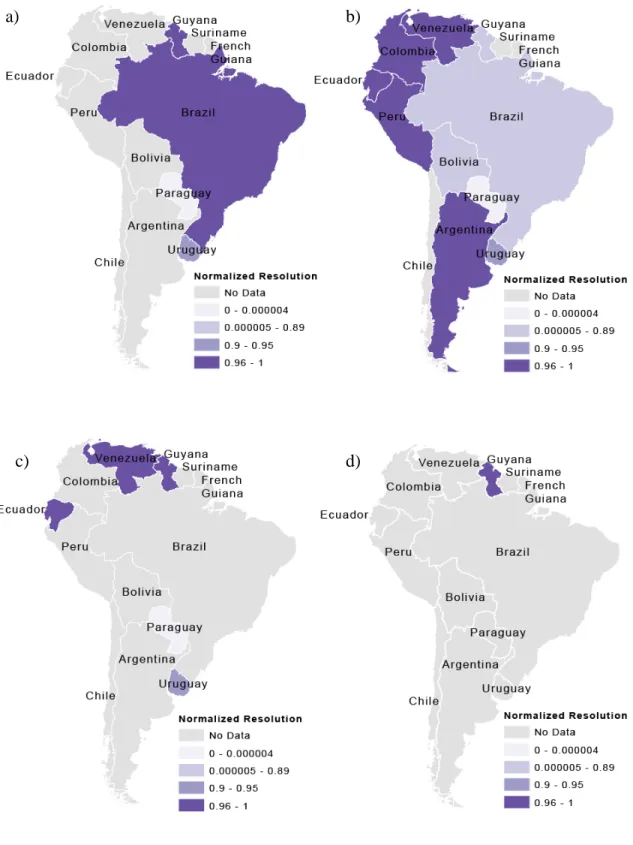
Figure 2. Resolutions of housing datasets important to Chagas disease risk by mean area and normalized by total country area for the variables: (a) percent of households with non-durable wall material (b) percent of households with natural floors (c) percent of households with adobe or taipa (rammed earth) walls, and (d) percent of households with clay brick walls.
a) b)
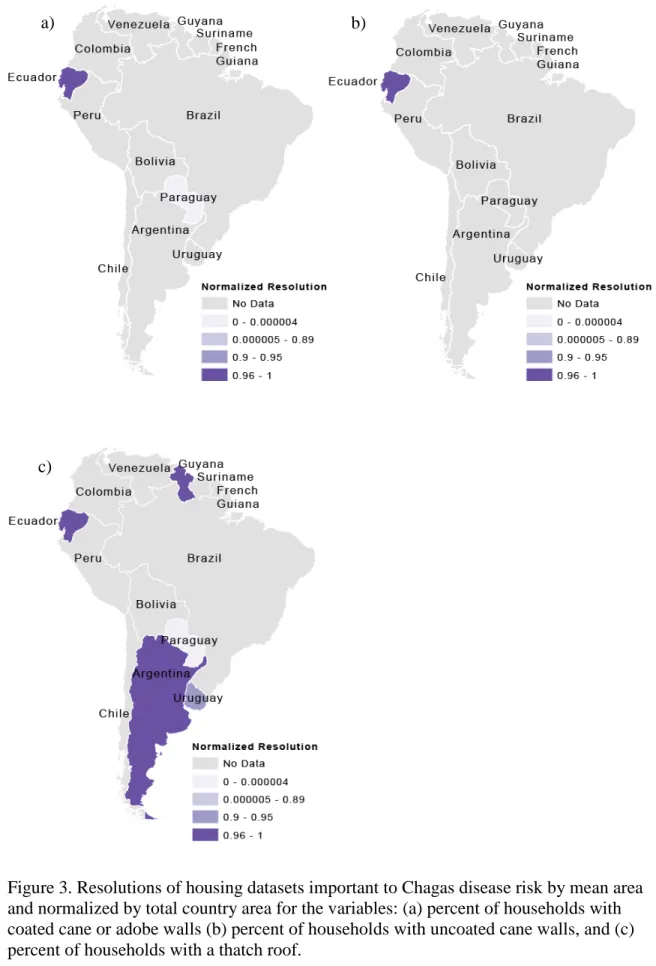
Figure 3. Resolutions of housing datasets important to Chagas disease risk by mean area and normalized by total country area for the variables: (a) percent of households with coated cane or adobe walls (b) percent of households with uncoated cane walls, and (c) percent of households with a thatch roof.
a) b)
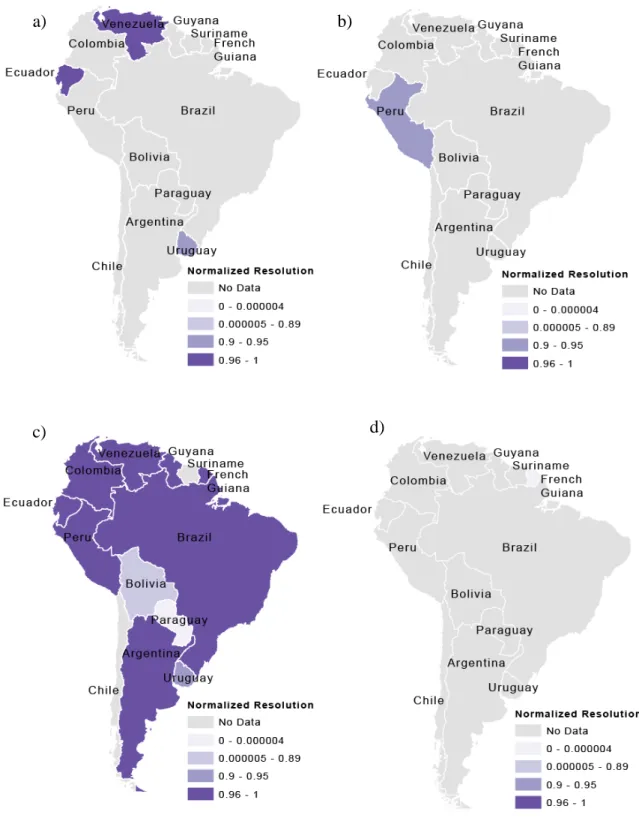
Figure 4. Resolutions of migration and age datasets important to Chagas disease risk by mean area and normalized by total country area for the variables: (a) “Where did census respondent live five years ago: This city or parish,” (b) “Where did census respondent live five years ago: In another place of this department,” (c) “Where did census
respondent live five years ago: In another country,” and (d) percent of population born
a) b)
Figure 5. Resolutions of migration and age datasets important to Chagas disease risk by mean area and normalized by total country area for the variables: (a) “Where did census respondent live five years ago: In another place of the country,” (b) percent of
respondents that are immigrants, (c) age, and (d) annual net migration.
a) b)
levels starting at 1,808 square kilometers per unit area up to 1,211,397 square kilometers per unit area. Ecuador and Uruguay are already ahead of many countries in South America in vector control. Vector transmission has been successfully interrupted in Uruguay as part of the SCI, and the current program in Ecuador to eliminate the vector T. dimidiata has been discussed as a mostly successful process (Schofield et al. 2006). The findings from our study indicate that the availability and detail of spatial data may have played a significant role in this success.
Varying availability and resolution of data is a concern for Chagas disease mitigation. While the SCI was successful in many areas, it was not successful in areas such as the Bolivian Chaco for reasons poorly defined (Gürtler et al. 2007). Therefore, spatial data collection and availability needs to be continually evaluated and improved to ensure successful vector elimination. The spatial variability of the success of the SCI may be due to its focus on collecting data on the prevalence of Chagas disease and interrupting transmission by homogenous insecticide spraying in areas where the disease is endemic (Dias 2007). Collection of data by a centralized program such as the SCI on the most important variables for Chagas disease risk identified in this study would improve vector elimination programs and help governments focus their resources on data collection in target areas most at risk for Chagas disease transmission.
Given current data availability, several countries including Uruguay and Ecuador could focus disease monitoring and vector control on specific parishes or departments based on data on housing type and migration. Other countries are lacking data on some or all of the important variables and/or are lacking data at fine spatial resolutions. For example, Brazil has fine resolution migration data on the municipality level, but has
limited data on housing type on such a fine scale. Therefore, mitigation programs would be limited in their ability to know where to focus vector control at any spatial resolution finer than parish or NDC scale. While these were the finest scales of data available, data at this scale can still hide heterogeneities within these administrative areas (Guhl et al. 2005).
Results from this study indicate that Ecuador, Brazil, Uruguay, Peru, and Venezuela are most prepared in the context of migration data availability, while Argentina, Bolivia, Paraguay, Colombia, and Guyana are least prepared. The lack of migration data would prevent disease programs from predicting where vector elimination needs will be located in the future, such as where there is increasing growth and urbanization. Chagas is now becoming an urban health problem instead of only a rural health problem due to
urbanization and increased contact between humans and wild triatomine populations (Medrano-Mercado et al. 2008). Data on migration would also be important to collect in areas such as the Amazon as identified by Briceño-León (2007) where Chagas may become an emerging problem due to new patterns of land occupation and globalization including highway construction, non-indigenous agriculture, cattle-raising, mining, and lumbering.
Data availability on housing construction materials indicates that the countries of Ecuador, Venezuela, Guyana, Brazil, Paraguay, and Uruguay are most prepared based on the number of available datasets. These countries provide data on three or more of the variables regarding housing construction materials. However, Brazil and Paraguay provide this data at larger spatial resolutions, limiting these countries’ abilities to target areas that need housing improvements to prevent colonization of homes by triatomines.
Colombia, Suriname, French Guiana, Peru, Bolivia, and Argentina had two or fewer datasets available at coarse spatial resolutions and would therefore also be limited in their ability to target vector control in areas with poor housing.
Data on age was the most widely available as all countries except Suriname and Chile had data on this variable. Venezuela, Guyana, Ecuador, Peru, Argentina, and Uruguay had data at fine spatial resolutions, while Brazil, Colombia, Bolivia, and Paraguay had coarser resolutions. The lack of data at finer spatial resolutions would limit a country’s ability to identify areas with higher percentages of households with young children present, which would prevent these countries from more precisely identifying high risk areas for Chagas disease vector transmission. Countries would need this finer scale data due to the associations between presence of children and households and prevalence of T. cruzi found in studies by Samuels et al. (2013) and Velasco-Hernández (1994).
The analysis of the available data would be useful for countries to determine which datasets are most needed to collect and at what spatial scale. The ability of countries to identify smaller local areas of risk could help reduce Chagas disease burden when funding for mass sprayings (like the Southern Cone Initiative) are not available (Guhl et al. 2005). This is important due to the threat of reinfestation of homes by triatomines after vector control by insecticide spraying. At the same time, future data collection efforts should focus on regions with poor quality housing that are constructed with materials that provide habitat for triatomine vectors. These kinds of materials include adobe, clay brick, thatch, and other uncoated materials like cane where triatomines can live in spaces and cracks. Data on poverty-related risk factors like these are necessary at a high resolution (e.g. sub-municipality census tracts) to understand how they influence
Chagas disease dynamics (Mischler et al. 2012). Also, data collection should also be focused in regions with larger populations of recent migrants, which would indicate more growth and more urbanization. Urbanization puts wild triatomines in closer proximity to humans, which may increase the infectivity of T. cruzi (Medrano-Mercado et al. 2008). These data could be collected within municipalities that have already been identified as having high percentages of houses built with poor quality materials and within
municipalities with high percentages of recent migrants.
Additionally, collection of data on the presence of animals in and around homes and on the age of children in households in these higher risk areas would help further identify homes at risk for triatomine infestation and disease prevalence. Several studies identified the presence of animals and children in households as important to disease risk factors (Castañera et al 2003, Cecere et al. 2004, Samuels et al. (2013). Finer scale data collection in these areas would help countries better identify areas most at risk for triatomine infestation in homes and therefore target control programs more accurately and use resources for triatomine elimination more efficiently. This study indicates that no countries are able to identify areas most at risk for Chagas disease transmission based on available animal data. Peru is the only country with data on this variable, but its location attribute by “natural area” did not provide a social data context. This lack of data prevents identification of areas that may be at risk for reinfestation by triatomines due to colonization of peridomestic structures that house these animals, and therefore leads to recolonization of homes.
In addition to collecting data to assess current Chagas risk, long term data collection is also important to ensure continued success of vector control efforts (Gürtler 2009).
Long term surveillance is important due to the threat of reinfestation from the target species eliminated during spraying, as well as the threat of new species invading homes that were not targets of vector control efforts. For example, previously treated homes in Brazil are at risk for other triatomines invading homes after the elimination of the target vector T. infestans due to the existence of other triatomine species in the country
including Panstrongylus megistus, T. brasiliensis, T. sordida, T. pseudomaculata, and
Rhodnius nasutus (Dias 2007). However, effective long term surveillance requires improvements to the spatial extent and detail at which Chagas data is collected. A centralized organization can be a critical piece in the success of long-term vector control initiatives like the Southern Cone Initiative (SCI). The SCI was implemented by the governments of Argentina, Bolivia, Brazil, Chile, Paraguay, and Uruguay in 1991 with the goal of interrupting transmission of Chagas disease by vector elimination (mainly by insecticide spraying) and selection of safe donors in regional blood banks to prevent transmission by blood transfusion (Dias 2007). This international effort helped some countries launch and maintain their national programs. However, the decentralization of health operations since the 1980s has left the SCI without a strong and active central level, making it difficult to collect data, implement control strategies, and maintain field operations (Dias 2007). Additionally, other diseases including dengue fever, AIDS, and leishmaniasis have become a priority over Chagas (Dias 2007). For these reasons, it is important that governments focus their limited resources on collecting data for the
identified variables associated with Chagas disease risk and help ensure that data is collected over the long term in the countries in South America.
6. Conclusion
This study examined the spatial data needs and availability for determining Chagas disease risk by vector transmission in South America. Although disease transmission has been interrupted in some countries or in areas of countries, the risk of reinfestation by triatomine vectors and the risk of infestation in new areas makes continuing and
improving data collection necessary (Schofield et al. 2006; Guhl et al. 2009). In order to maintain a system that advances toward disease mitigation, an assimilation of
georeferenced epidemiological data is necessary (Schofield et al. 2006). A census provides information that guides policy development and planning, and thus a unified dataset of all of the census variables that relate to Chagas disease risk could be effective in aiding policy makers, such as health officials, to decide where to target disease mitigation programs. Such programs have benefitted countries in the past compared to more expensive costs for treatment of the disease (Schofield et al. 2006). Mitigation programs could benefit further by focusing spatial data collection on the variables most important to Chagas disease vector transmission risk. This includes data on housing construction materials, migration, and presence of animals and children in houses. Due to limitations in resources, data cannot be collected at a fine resolution for every area in every country in South America. For this reason, high resolution data collection could be focused in areas identified from existing data with poor housing quality, high percentages of recent migration, and/or large numbers of animals and children in homes. This way, countries could better mitigate Chagas disease transmission by collecting data on these variables associated with disease risk and use this data to focus high resolution data collection and vector control efforts on high risk areas as identified from the data.
CHAPTER II
IDENTIFYING SPATIAL DATA NEEDS FOR CHAGAS DISEASE
MITIGATION THROUGH AGENT-BASED MODELING
1. Introduction
Chagas disease is a complex system that includes several biophysical, geographic, cultural, administrative/political, and economic domains which affect insect infestation, disease transmission, and disease control (Gürtler 2009). Heterogeneities of the
environment, local demographics, spatio-temporal factors, and insecticide resistance may result in areas of high and low levels of insect infestation, disease infection, disease infectiousness, and parasite transmission (Cardinal et al. 2007; Gürtler et al. 2007; Maria C. Cecere et al. 2006). However, vector and disease control strategies have traditionally been homogenous (Gürtler 2009). These heterogeneities can lead to uncertainty as to what control strategies are appropriate (Guhl et al. 2005), which has slowed the setup of control interventions in some areas (Guhl et al. 2009). Furthermore, a lack of spatial data makes it difficult to investigate dispersal potential of individual triatomines and the larger spatial structure of populations (Zeledón et al. 1970)
In urban areas, human migration patterns are an important component of Chagas disease risk (Bayer et al. 2009). Migration is contributing to growth in many urban areas in South America, making reinfestation and infestation of new communities important considerations in vector control efforts. Seasonal migration by residents in new
settlements on the outskirts of cities, called peri-urban areas, provides a way for vectors to enter communities and establish urban transmission cycles of Chagas disease (Bayer et
al. 2009). For example, communities in peri-urban areas such as those outside of
Arequipa, Peru consist of displaced families who migrated from rural areas after agrarian reform in 1969 and to escape terrorism in the 1980s and 1990s (Levy et al. 2006). These communities are called pueblos jóvenes and are home to agricultural migrants who typically migrate to Arequipa in search of work and cheap housing (Bayer et al. 2009). Migrants typically move to Arequipa from rural areas, and then move several more times throughout their life to find work. These short-term agricultural migrants in valleys west of Arequipa may carry triatomines back to the pueblos jóvenes. In addition to migration, human age is a factor in vector-borne transmission of Chagas. Both Velasco-Hernández (1994) and Samuels et al. (2013) that children are associated with an increased T. cruzi
prevalence in households. This may be because children often sleep in the same room as animals (Bowman et al. 2011), and may also play with triatomines without realizing that they present a health threat (Velasco-Hernández 1994). Risk for triatomine infestation also varies spatially depending on presence of other infested homes or structures nearby due to frequent exchanges between domestic and peridomestic areas (Abrahan et al. 2008). Triatomines disperse by flying or by walking for shorter distances, the latter of which may allow them to carry more eggs and good blood reserves and therefore allow for more easily colonization of a home (Abrahan et al. 2011). Several studies have investigated the effects of human migration on Arequipa on Chagas infection, but none have examined how migration, age, and insect infestation interact on a local scale to impact broader patterns of Chagas disease infection.
Complex systems models have been developed to address these gaps in the Chagas literature in a way that does not require extensive spatial data. These include a
cellular automata model examining the temporal variations in Chagas disease
transmission in the Yucatan peninsula in Mexico (Slimi et al. 2009) and a model looking at the effects of insect density thresholds in a single house (Castañera, Aparicio, and Gürtler 2003). While these models include elements of individual behavior in examining spatial patterns of triatomine individuals and populations within homes, they do not consider how human migration and age influence these patterns.
Agent-based models (ABMs) can help address these uncertainties and
heterogeneities. Individual actions of triatomines create emergent behavior on a larger scale, which can best be addressed with an ABM. Emergent behavior refers to how individual behaviors lead to broader-scale patterns in a system, such as how the individual search strategies of triatomines for food and mates influence domestic colonization patterns and the consequential infection of Chagas. In an agent-based model, agents can represent individual insects or humans who adapt their behavior based on their current state and the state of other agents and their environment (Railsback and Grimm 2012). In the case of Chagas disease, insect infestation and disease infection is are emergent patterns influenced by human migration and demographics and triatomine search strategies for food and finding mates.
The first part of this study (Section I) identified high variability in publically availability of data on variables related to Chagas disease risk in South America,
suggesting that focused data collection could more effectively control disease spread. An ABM can be used to address this lack of data by improving our understanding of system dynamics when data is lacking, and to identify areas most in need of better data
migration, as well as the spatial arrangement of houses influence insect infestation and Chagas disease infection. The objective of this study is to use the findings to better inform data collection on variables identified as important to Chagas disease risk.
2. Methods
The methods used for creating the model are described using the ODD (Overview, Design Concepts, and Details) protocol, which provides a complete description of the model using a standard documentation format (Grimm et al. 2010).
2.1. Overview
2.1.1. Purpose: The purpose of this model is to explore how human migration and demographics, insect life cycle, and spatial arrangement of houses affect insect infestation in a peri-urban area, based off of research on peri-urban areas in Arequipa, Peru.
2.1.2. Entities, state variables, and scales
2.1.2.1. Scales: This model has an extent of 5 km. x 5 km., represented by 50 x 50 cells with each cell 100 m. x 100 m in size.
2.1.2.2. Cells: In this model, houses will be represented by cells.
2.1.2.3. Houses: Houses are represented by patches, called house-patches, and are evenly spaced at a distance controlled by the house-distance parameter.
2.1.2.4. Humans: Humans are either adults or children. Adults are
individuals who live in houses in the model and have the state variables age and migration. Age is represented by the adult-age parameter and ranges from 0 to 115. Migration is represented by the migrations
parameter which ranges from zero to five. Adults are initialized with a random number of migrations between zero and five. This is because in Arequipa, humans typically migrate first to the urban area, then multiple times afterward throughout their life to find work (0-5.5 times total) (Bayer et al. 2009). Children are individuals who are created from adults and have the state variables child-age and infection-probability. Child-age is initialized at a random age chosen from a Poisson distribution with a median of 10.3 years. Bowman et al. (2008) conducted a survey of T. cruzi infection in Arequipa found that the median age of children in the survey was 10.3 years. Infection-probability is also based on results of the Bowman et al. (2008) study which found that if children are four years old or older, they have an infection probability that increases by 12% with each year of age. 2.1.2.5. Insects. Insects are represented by mobile agents with state
variables for their sex, age, and ability to colonize a house. Insects have a 50% chance of becoming male or female. Males are initialized as not able to colonize, and become able to colonize if they are at a house and there is at least one female present, representing their desire for a mate. Females are initialized as not able to colonize and become able to colonize if they are at a house, there are no females present, and if there is at least one male present. Abrahan et al. (2011) suggested that it is reasonable to consider that females choose to migrate away from a location if there are other females present due to potentially
decreased fecundity resulting from the presence of other females. Both males and females have the same lifespan of 325 days, and are
initialized as adults, choosing a random age between 180 and 325 days (Schofield 1980). This represents their life stage as adults, beginning at 180 days which usually marks the end of their egg to adult
development (C. J. Schofield 1980).
2.1.3. Process, overview, and scheduling: Each time step represents one day. Triatomines feed at night and other studies have observed triatomine flight and walking strategies with daily observations (Abrahan, Gorla, and Catalá 2011; C. J. Schofield et al. 1992; Lehane et al. 1992). At each time step: 2.1.3.1. Days advance by one.
2.1.3.2. Adult humans die from random chance.
Humans have a random chance of dying based on Peru’s death rate per 1,000 people (Central Intelligence Agency 2014). 2.1.3.3. Insects, adults, and children age.
Insects age by one day at each time step, and adults and children age at 1/365 at each time step to represent aging by year.
2.1.3.4. Adults migrate.
If adults are over 18 years old, and have migrated fewer than six times, and a random floating is less than where the migration-probability slider is set, the adult migrates.
2.1.3.5. Insect updates:
To update their ability to colonize, females must be at a house and must be over 180 days old (the age when they become adults). Females are able to colonize if they count that there is at least one adult insect of the opposite sex in the house and if the number of other adult females in the house is zero. If they are able to colonize, they then lay eggs. Males also update their ability to colonize by counting the total number of insects at the house and the number of adult females. They are able to colonize if there is at least one adult female in the house.
2.1.3.5.2. Leave the house if they are unable to colonize. If the insects are unable to colonize, they keep moving forward.
2.1.3.5.2.1. Lay eggs.
Females lay eggs based on a random chance and if they are able to colonize.
2.1.3.5.3. Move randomly.
Insects move forward one cell each time step, and move into a house if one comes into their sensing radius.
2.1.3.6. Global updates: 2.1.3.6.1. Update age
If adults have been infected for over 30 years, they die based on the probability that up to 30% of infected individuals
develop deadly cardiac conditions (Bowman et al. 2008). If children are 18 years old, they become adults, change their infection probability based on their age, and have a 50% chance of hatching new children. If they are 18 years old or older and not infected, they become adults and set their infection probability to stay the same as 18-year-olds. This is because Bowman et al. (2008) found that adults had the same risk of infection as teenagers, whose infection
probability is 2.16 in this model. Whether they are infected or not, once the children become adults they have a 50% chance of hatching new children.
Insects die when they reach 325 days. They also have a random 2% chance of dying if they are adults, and a 10% chance of dying if they are young. These numbers are from Slimi et al. (2009)’s model parameter of 98% chance of adult survival and 90% chance of young survival in their cellular automata model.
2.1.3.7. Human updates:
2.1.3.7.1. Update infection probability
If children are four years old or greater, they set their infection probability based on their age. This represents the finding by Bowman et al. (2008) that child infection risk increased 12% with age in Arequipa.
2.1.3.7.2. Become infected.
Children and adults have a 0.0012% chance of becoming infected daily if there are triatomines in their house based on Rabinovich et al. (1990)’s estimation of mean daily
probability of transmission. 2.1.3.7.3. Update infection time
Children and adults update their time since infection by adding 1/365 to their infection time.
2.1.3.8. New bugs migrants are created.
Five new bugs are created every day to represent new migrants into the peri-urban area.
2.1.3.9. Observer updates.
Finally, the model outputs are updated at each time step. A line graph plots the number of bugs, human adults, human children, and infected humans.
2.2. Design concepts
2.2.1. Basic principles: How do human agent’s behaviors of migration and aging affect triatomine infestation and Chagas disease infection in peri-urban area? 2.2.2. Emergence: The number of humans infected with Chagas disease is the
emergent result of this model.
2.2.3. Adaptation: Females insects exhibit adaptive behavior by choosing to leave a house if there are other females present because of potentially reduced fecundity.
2.2.4. Objectives: If insects are unable to colonize a house, they become able to colonize by moving to the nearest home if there is one in their search radius. Insects stop searching when they find a house to colonize and a mate. This then allows them to feed (on humans), lay eggs, and create domestic colonies.
2.2.5. Learning and Prediction: There is no learning or prediction.
2.2.6. Sensing: Insects can sense the presence of houses within a specific radius of their current location, the presence of other insects, and the humans’ risk of infection values if they are in the same house as the insect.
2.2.7. Interaction: Insects interact with humans in houses by infecting them with
T. cruzi.
2.2.8. Stochasticity: Stochasticity is used to initialize the model by randomly arranging evenly spaced houses, arranging insects, setting human and insect ages, setting the human adults’ number of migrations, and setting the
number of children in the houses. It is also used to give adults a random chance of dying and migrating at each time step, a random chance of bringing a triatomine back with them after they migrate, and a random chance of dying if they are infected with Chagas. When children become adults, they have a random chance of having children, with the number of children dependent on the household-size parameter. Insects have a random chance of dying at each time step which is higher when they are young and decreases as they become adults based on numbers form Slimi et al. (2009)’s cellular automata model. Human adults and children also have a random
probability of becoming infected with Chagas if there are insects in their home.
2.2.9. Collectives: There are no collectives.
2.2.10.Observation: A line graph plots the number of bugs, human adults, human children, and infected humans at each time step.
2.3. Details
2.3.1. Initialization: Model initialization begins with creating random evenly spaced houses based on house distance parameter. Families are created by the houses by sprouting two adults and a random number of children chosen from a normal distribution based on the household-size parameter. Adults choose a random age from a normal distribution based on the median age of Peru (27), and children choose an age based on the median age in the survey by Bowman et al. (2008) of children in Arequipa (10.3). Five random triatomines are placed throughout the world, and the triatomines choose a random age between 180-325 days to simulate adults because T. infestans
typically have low mobility until they are adults (Vazquez-Prokopec et al. 2004).
2.3.2. Input data: There is no input data. 2.3.3. Submodels
2.3.3.1. Migration: If adults are over 18 years old, and have migrated fewer than six times, and a random floating number is selected that is less than where the migration-probability slider is set, the adult migrates once and adds one migration to their migration count. When adults
migrate they have a 50% chance of bringing a triatomine insect back with them. If an insect is brought back with them, an insect is hatched at the adult’s home and the insect chooses a random age between 180 and 325 days.
2.3.3.2. Update Insect Ability to Colonize: To update ability to colonize, females must be at a house and must be over 180 days old (adults). Females count the total number of insects in the house, the number of female adults in the house, and the number of adult insects of the opposite sex. Females are then able to colonize if there is at least one adult insect of the opposite sex in the house and if the number of other adult females in the house is zero. If they are able to colonize, they then lay eggs. Males also update their ability to colonize by counting the total number of insects at the house and the number of adult females. They are able to colonize if there is at least one female in the house.
2.3.3.3. Leave If Unable to Colonize: If the insects are unable to colonize, they keep moving forward.
2.3.3.4. Lay Eggs: Females lay eggs if they are able to colonize and if a random floating number is selected that is less than 0.004111. This is the probability of reproduction used by Slimi et al. (2009) in their cellular automata model on triatomine dispersal and infestation in Mexico. Females lay a different amount of eggs depending on the season. Because per-capita female fecundity varies from 120-160 eggs
per month in summer to 10-60 eggs per month in winter (Gorla and Schofield 1985), females in this model lay a certain number of eggs per day based off of these numbers (4-5 eggs per day in the summer, 0-2 eggs per day in the winter, and 0-2-4 eggs in spring and fall).
2.3.3.5. Move Randomly: Insects move forward one cell each time step, and move into a house if one comes into their sensing radius.\ 2.3.3.6. Update age:
2.3.3.6.1. Adults: If adults have been infected for over 30 years and a random floating number is selected from 0.0 to 1.0 that is less than 0.3, they die. This number is used because up to 30% of infected individuals develop deadly cardiac conditions (Bowman et al. 2008).
2.3.3.6.2. Children: If children are 18 years old or older and have been infected, they become adults and stay infected. If they are 18 years old or older and not infected, they become adults and set their infection probability to 2.16. Whether they are infected or not, once the children become adults they have a 50% chance of hatching new children.
2.3.3.6.3. Insects: If insects are older than 325 days, they die. Then they have a random 2% chance of dying if they are adults, and a 10% chance of dying if they are young. These numbers are from Slimi et al. (2009)’s model parameter of 98% chance of adult
survival and 90% chance of young survival in their cellular automata model.
2.3.3.7. Update Infection Probability: If children are four years old or greater, they set their infection probability as their age multiplied by 0.12.
2.3.3.8. Become Infected: Children and adults have a 0.0012% chance of becoming infected daily if there are triatomines in their house based on Rabinovich et al. (1990)’s estimation of mean daily probability of transmission.
2.3.3.9. Update Infection Time: Children update their time since infection by adding 1/365 to their infection time.
2.3.3.10. Create New Insects: Five new bugs are created every day to represent new migrants into the peri-urban area.
The model was run 1 times for 10 years each. The parameters for each run were varied as shown in Table 2.
Table 2. Values for each parameter as varied in the model runs.
Parameter Values House-distance 1 5 10 15 20 Household-size 1 5 10 15 20 Migration 0 0.25 0.5 0.75 1 3. Results
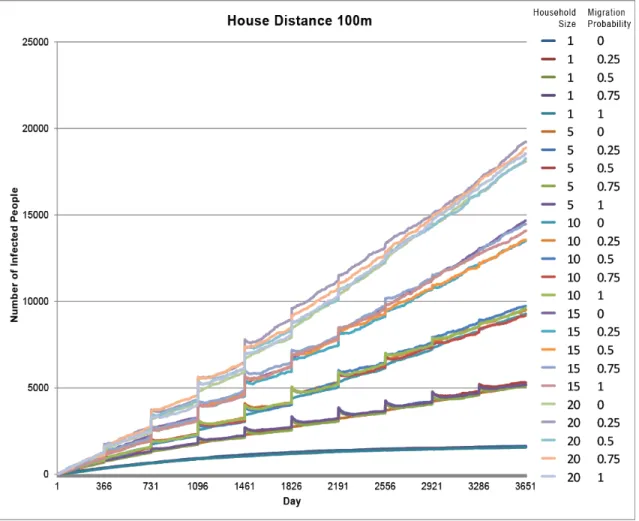
The model resulted in 125 total runs. The first 25 runs resulted in the highest number of infected individuals ranging between 1,575 and 19,213 infected (Figures 6 &
7). These runs represent the densest housing arrangement with houses 100 meters apart. The highest number of infected individuals at this house distance was with a household size of 20. The next highest number of infected individuals was with a household size of 15, then 10, 5, and 1, as illustrated in the groupings of lines in Figure 7. The top four groups of lines (household sizes 5-20) exhibit a cyclic pattern of increased number of infected individuals each year, while the bottom group of lines (household size 1) does not. Migration had little impact on the number of infected individuals. Figure 7 illustrates this as each group of runs is dictated by household size and there is little variation within the groups from the different migration probabilities in each run. Additionally, Figure 8 shows all runs with migration probability at 100%, resulting in much higher infection rates for closer house distances.
Figure 6. Model setup with a house distance of 100 meters. The model is initialized with houses randomly spaced 100m apart that contain two adult humans and a number of children based on the household-size parameter, and with five insects placed randomly.
Figure 7. Model runs 1-25 with a house distance of 100 meters. The legend indicates different model runs listing the household size value and the migration value for each.
Figure 8. Model runs with migration probability at 100%. The number of infected people is mostly influenced by house distance.
The next 25 runs (runs 25-50) had the second highest number of infected
individuals ranging between 98 and 1,473 infected (Figures 9 & 10). These runs had the second densest housing arrangement with houses 500 meters apart. The highest number of infected individuals at this distance was also with a household size of 20. The runs with household sizes 10-20 exhibited more variance in the total number of infected individuals compared to the runs with household sizes 1 and 5 which have more clearly defined groupings in the graph. Like the runs with houses 100 meters apart, these runs also exhibit a cyclic pattern with increasing infected individuals every year with the exception of the runs with a household size of one.
Figure 9. Model setup with a house distance of 500 meters. The model is initialized with houses randomly spaced 100m apart that contain two adult humans and a number of children based on the household-size parameter, and with five insects placed randomly.
Figure 10. Model runs 26-50 with a house distance of 500 meters. The legend indicates different model runs listing the household size value and the migration value for each.
The last 50 runs had the lowest number of infected individuals ranging from 5 to 411 individuals. These runs had the largest distance between houses (1,000-2,000 meters). These runs had similar patterns with fewer clearly defined groups of lines on their graphs (Figure 11-13), and with the number of infected individuals decreasing with increasing house distance.
4. Discussion
The results of this model indicate that the number of infected individuals was influenced mainly by household size. This is illustrated by the groupings of the number of infected humans as a result of each variation in the household size parameter on the model runs (Figure 7). This may seem obvious because a greater number of humans per household in the model increases the likelihood that someone will become infected based
Figure 11. Model runs 51-75 with a house distance of 1,000 meters. The legend indicates different model runs listing the household size value and the migration value for each.
Figure 12. Model runs 76-100 with a house distance of 1,500 meters. The legend
indicates different model runs listing the household size value and the migration value for each.