UDK 528.93:528.914:528.711.1:681.32]:004 Prethodno priopćenje / Preliminary note
Large Scale Topographic Maps Generalisation
and Visualization Based on New Methodology
Ilma DINAR – Breza1, Slobodanka KLJUČANIN – Sarajevo2,Vesna POSLONČEC-PETRIĆ – Zagreb3
ABSTRACT. Integrating spatial data from different sources results in visualization which is the last step in the process of digital basic topographic maps creation. Sour-ces used for visualization are existing real estate cadastre database orthophoto plans and digital terrain models. Analogue cadastre plans were scanned and georeferenced according to existing regulations and used for toponyms. Visualization of topologica-lly inspected geometric primitives was performed based on the ‘’Collection of carto-graphic symbols for scales 1:500 and 1:2500’’ – regulations applied in Republic of Croatia, since Federation of Bosnia and Herzegovina does not have prescribed regu-lations. In addition to integrating different spatial data, it is necessary, prior to the visualization step, to perform the generalization step (depending on basic topographic map scale, partial or complete generalization is applied). This paper describes the process of generalization and visualization of data collected and processed in accor-dance with the topographic data model from the Federal Administration for Geodetic and Property Affairs.
Keywords: basic topographic map, topographic data model, generalization,
visuali-zation.
1. Introduction
Different sources were used for the purpose of creating basic topographic maps at
1:5000 (OTK5) and 1:10 000 (OTK10) scales. Most important of the sources is the
real estate cadastre database. Basis for real estate cadastre database are cadastral
plans (without vertical terrain representation) at 1:500, 1:1000 and 1:2500 scales.
After selected dataset from real estate cadastre database and data from other
sources (digital orthophoto plan at 1:5000, i.e. DOP5, digital terrain model, analogue plans) are processed and transformed it is necessary to perform the 1 Ilma Dinar, dipl. ing. geod., Municipality of Breza – Department of Physical Planning, Environment
Pro-tection, Geodetic and Property Affairs, Ul. Bogumilska 1, BA-71370 Breza, Bosnia and Herzegovina, e-mail: [email protected],
2 doc. dr. sc. Slobodanka Ključanin, Faculty of Civil Engineering, University of Sarajevo, Patriotske lige 30, BA-71000 Sarajevo, Bosnia and Herzegovina, e-mail: [email protected],
3 doc. dr. sc. Vesna Poslončec-Petrić, Faculty of Geodesy, University of Zagreb, Kačićeva 26, HR-10000 Zagreb, Croatia, e-mail: [email protected].
procedure of partial or complete data generalization and to define possible meth-ods for visualization and data distribution.
Generalization is one of the most important steps in creating the maps because it enables definition of selected dataset quantity and geometric quality as well as the form in which those data will be shown on the map. Large amounts of data from
the real estate cadastre database can be shown, especially considering the fact that basic topographic maps are created in large scales (1:5000 and 1:10 000). Accord
-ing to valid cartographic regulations, map content generalization is performed for scales smaller than 1:7000 which, in our case, means that generalization scope is different for OTK5 (partial generalization) and OTK10 (complete generali-zation).
The project presented in this paper was done as a Master’s thesis at the
Univer-sity of Sarajevo’s Faculty of Civil engineering (Dinar 2014), and it initiated the change of the existing model and activities (such as the Manual on data download
from the real estate cadastre database and developing the Digital collection of
cartographic symbols).
2. Cartographic generalization
Cartographic generalization refers to generalizing the map content in accordance
with the map scale and/or purpose (Frančula 2004). The purpose of generalization is to produce a good map, balancing the requirements of accuracy, information
content and legibility. It encompasses the modification of the information in such
way that it can be represented on a smaller surface, retaining the geometrical and descriptive characteristics (Cecconi 2003).
The degree of generalization depends on four basic factors: map scope, minimal size, landscape characteristics and map purpose. Map scope is the most important of the listed factors, as it results in map legibility. The listed examples of general
-izations were based on the specificity of the ODK 1:5000 scope (Fig. 1 and Fig. 2) and ODK 1:10 000 scope (Fig. 3 and Fig. 4). The quality of generalization had to
be within the validity of the exported map.
The generalization process extracts and reduces information about the surround-ing environment or other sources and their visualization in order to
repre-sent specific themes at smaller scales, considering the fact that cartographic specifications and mapped area integrity representation maintenance (ESRI 1996).
Generalization process can be performed manually and automatically. Each of the two methods has its advantages and disadvantages. The process of manual
gener-alization is time-consuming and subjective, and automatic genergener-alization does not provide the best end result (Jezdić and Tutić 2013).
2.1.
Generalization Examples OTK5
The generalization process is performed as a selection process that refers to select-ing specific datasets from available sources that will be used for creatselect-ing the map.
This step involves selection of data to be used for creating the map. The selection represents the difference between simple mapping of all data from selected dataset
and mapping all data available. In addition to that, the omission operator was used because the topographic data model implies elimination of objects that are
too small in size, too short and insignificant to be presented on the final map. In this specific case objects whose size was under 20 square meters for ‘’Residentia
-lObject’’ and ‘’AuxiliaryBuilding’’ classes. Since objects of remaining classes have
the orientation function it is preferable to show them on the map even if their size is smaller than prescribed.
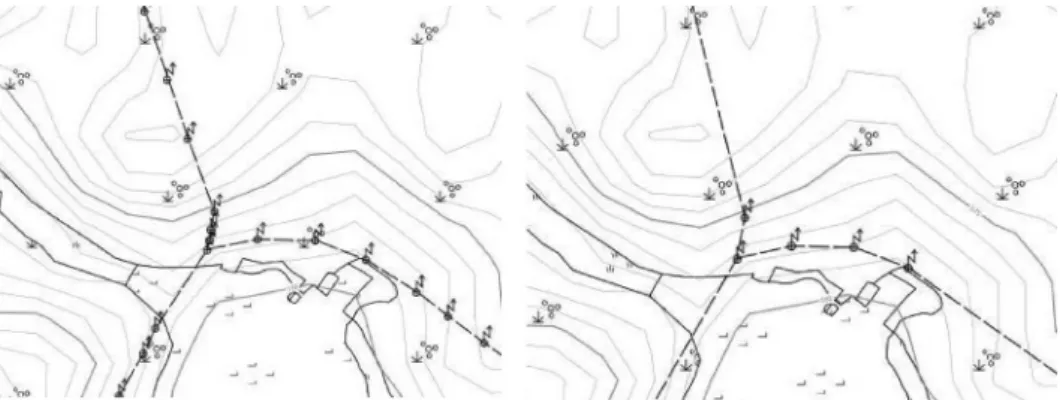
Generalization by simplification was also used – it implies removing unnecessary
details without destroying the basic geometric shape of the object. Such
generali-zation was used for class package ‘’TIS_UtilityNetwork’’ where it was noticed that objects from ‘’ElectricityObject’’ burden the map. Therefore, all objects of this class that do not represent a node are deleted (Fig. 1).
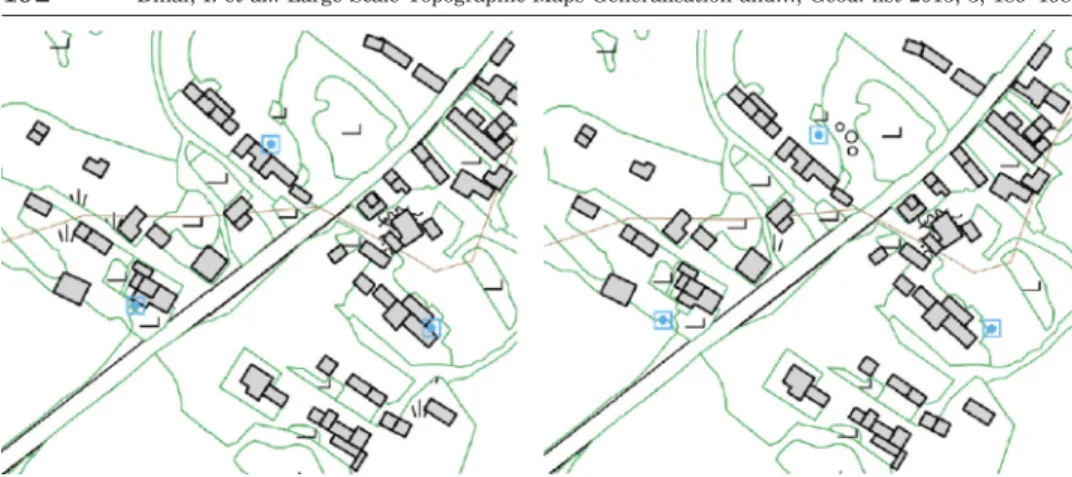
In the visualization, ‘’WaterChambe’’ class is represented with dashed lines; how
-ever, the dashed lines overlapped with objects that represent buildings. Therefore,
symbols for mentioned class were adjusted in order to facilitate the visualization
– the shifting operator that involves removing the differences between objects was used along with shifting the objects of less importance in order to satisfy the
sep-aration threshold and other cartographic specifications (Fig. 2).
Operator ‘’Classification and symbolization’’ was used in ‘’TIS_Relief’’ class where contour lines are closed, of small range and are replaced by the dashed lines and
included in a new class.
2.2.
Generalization Examples OTK10
Same generalization operators were used for OTK10 as for OTK5; how-ever, this scale requires complete generalization, so additional parameters are
included.
Fig. 1. Representation when all objects from ‘’ObjektElektricneEnergije’’ class visualized (left) and objects from ‘’ObjektElektricneEnergije’’ class that represent the crucial points (right).
For representation of buildings in OTK10, in addition to mentioned operator of
omission of objects smaller than 20 square meters, operator simplification was used in order to remove unnecessary details referring to building appearance. In
addition to that, operator grouping that implies combining neighbouring objects
or same-type neighbouring objects into a new objects was used (Fig. 3).
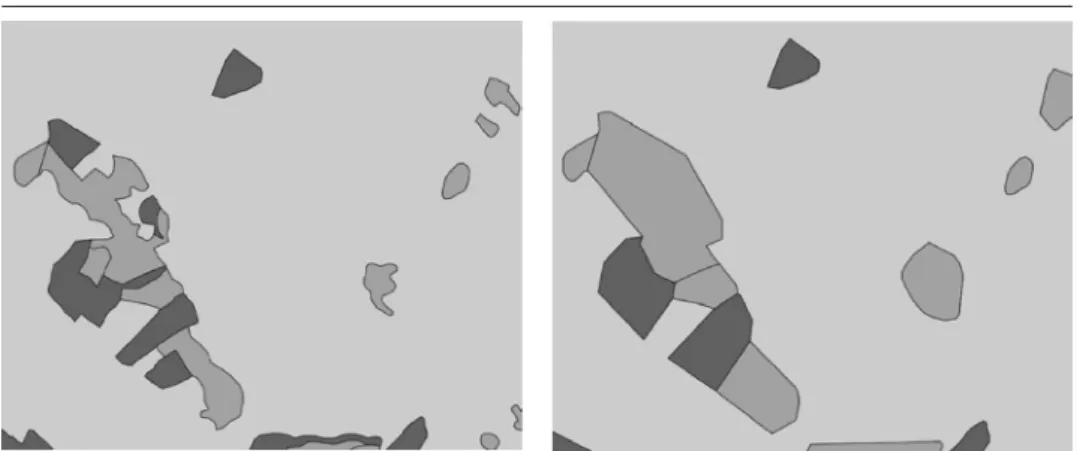
Representation of land for OTK10 is different than for OTK5 – it is necessary
to emphasize that real estate cadastre data model each polygon represents a parcel while in the topographic data model polygons represent areas with
same land use. Therefore, parcels with same purpose were joined. Parcels
from real estate cadastre database were digitalized from surfaces with scales larger than that of OTK10 which lead to great complexity in land use boundaries
at 1:10 000 scale and to the need to use an additional operator – simplification
(Fig. 4).
Fig. 2. Representation of objects from ‘’WaterChamber’’ class (left) and after the shift (right).
3.
Map visualization and distribution
3.1. Basic topographic maps visualization
B&H currently uses OTK 5000 and OTK 10 000 from the former Yugoslavian period (as well as the analogue prints or digital raster prints of the aforemen
-tioned maps). Analogue basic state maps contained three or four colours (Zdjelar 1992):
• Black (settlements, transport network, vegetation, and other textual descripti
-ons except hydrography),
• Blue (hydrography where the elements presented by lines and names were prin
-ted in the shade of blue more dark than water surface),
• Brown (relief shapes, contour lines etc.),
• Green (vegetation; only at 1:10 000 scale).
Since B&H does not have an official document prescribing the methods for digital topographic data visualization, the project referenced the ‘’Collection of car
-tographic symbols for scales 1:500 and 1:2500’’ – regulations applied in Republic of Croatia (DGU 2011). The first step in the process of data visualization is defi
-nition of layer hierarchy (each layer corresponds to specific class package of the topographic model) in the GIS software which enables better objects visibility. Further on, it is necessary to determine whether all objects within the same class are represented by the same method (using only one symbol) or objects’ rep
-resentation is different (categorization).
After data processing is complete, i.e. after two models are compared (real estate cadastre data and topographic data model) and defining the geometry and objects’ representation, it is necessary to determine the method in which the map ele -ments will be shown as well as methods of map distribution. Representation of
topographic data (maps) depends on the type of medium for the visualization process. Therefore, it is possible to show the map on paper, computer screen or a
different medium which enables digital representation.
3.2. Basic topographic maps distribution
Data distribution is mostly performed by publishing and multiplying topographic data in analogue and digital form.
According to a survey from 20094 that was performed for the purpose of research
in the field of multimedia maps application in FB&H, all survey participants stat
-ed that they most often use analogue forms and portable m-edia (CD/DVD/USB) for data exchange. Therefore, access to data needs to be improved in accordance with technology progress. When it comes to maps it is necessary to provide a
wider scope of web maps. Considering the fact that digital data are transferred to
user via portable media (CD/DVD/USB/HD) in different formats and through net
-works (LAN, intranet/internet), methods of improving access to data include using the internet (web sites) available to public. Internet network, as a basis for distri
-bution and representation of different data types, can be considered as most prac
-tical and efficient solution (Ključanin et al. 2014).
Distribution of topographic data, within the project of creating basic topographic maps, is enabled through data export to GML format. Having in mind that the
GML format is used to transfer data it is necessary to define the method for vis-ualization of each class package.
Advantage of creating a topographic database is that it enables the possibility of
distribution via internet (vector maps and raster graphics), i.e. Geoportal of the
Federal Administration for Geodetic and Property Affairs.
3.3. Basic topographic maps distribution (raster graphics)
Since the map was created by means of digital technology and it is stored in
dig-ital record (vector and/or raster graphics), it is necessary to enable the users to view the map (partially or completely) on computer screen and print while pre -serving the traditional appearance5.
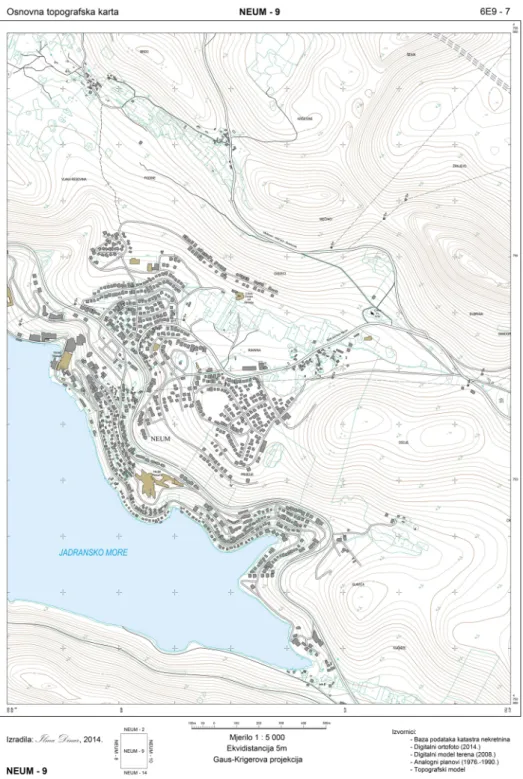
In order to provide users with the traditional appearance of the map with raster
graphics additional treatments in map visualization were necessary – definition of map sheets nomenclature, local sheet labels definition and extra-framework map
content.
During the process of defining the map content a dilemma on what method to use in the process since that issue was not mentioned in any of the existing
regula-tions in FB&H. Therefore, the extra-framework content (as well as inter-frame
-work content) is defined in respect to existing analogue maps. Final map appear
-ance is shown on Fig. 5.
4 The survey can be considered a recent date survey, considering that changes in our society require time to
occur.
5 Traditional map appearance refers to existence of extra-framework map content, intra-framework map con
-tent and general map con-tent. Topographic database and data visualization enable representation of general map framework.
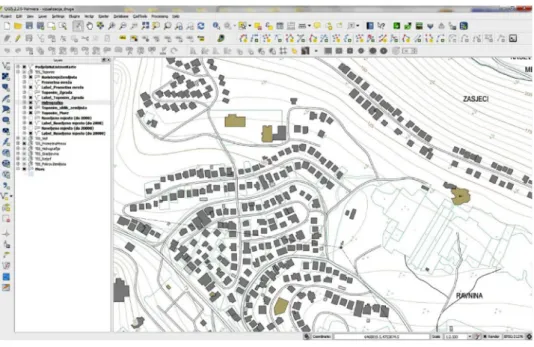
3.4. Vector maps representation on computer screen
Map representation is possible in vector format, as for example desktop view, in software in which data processing and visualization was performed (Fig. 6).
However, such representation is intended for users who possess adequate knowl
-edge, are able to use software and selected dataset and agreed Collection of digital
symbols. In that case the result of map representation is a vector map. The
sug-gested model could be distributed only digitally (online) and the users would be
able to download topographic objects of interest.
4. Conclusion
During the implementation of the project of creating basic topographic maps at
1:5000 and 1:10 000 scales it was observed that generalization level depends on
specific map scale even though generalization of specific datasets is identical for both scales. Greatest differences in the generalization process occurred for data-sets related to land surface and construction objects.
The process of data visualization showed a lack of legal acts and can be served as a guideline for planning the regulations.
Data created based on the topographic data model in this project can be
distrib-uted in a simple way, by means of new technologies and in accordance with user needs for a more simple access to spatial, i.e. topographic data.
Visualization of basic topographic maps performed in the described method results
in maps that do not show significant deviation from maps created in the past; however, it makes the process significantly easier.
This new suggestion in topographic cartography in B&H is supported by the De
-velopment strategy of official cartography in FB&H (Ključanin et al. 2014).
References
Cecconi, A. (2003): Integration of Cartographic Generalization and Multi-Scale Data -bases for Enhanced Web Mapping, PhD Thesis, University of Zurich, Zurich. DGU (2011): Zbirka kartografskih znakova, Državna geodetska uprava, Zagreb, http://www.dgu.hr/assets/uploads/Dokumenti/Zakoni/Zbirka_kartografskih_znakova_
Prilog_Pravilniku_NN1042011-web.pdf.
Dinar, I. (2014): Izrada osnovne topografske karte M 1:5000, diplomski rad, Građevin -ski fakultet, Univerzitet u Sarajevu, Sarajevo.
ESRI (1996): Automation of Map Generalization: The Cutting-Edge Technology, http://downloads.esri.com/support/whitepapers/ao_/mapgen.pdf.
Frančula, N. (2004): Digitalna kartografija, Geodetski fakultet Sveučilišta u Zagrebu, Zagreb.
Jezdić, K., Tutić, D., (2013): WebGen-WPS – Web-servis za kartografsku generalizaciju, Kartografija i Geoinformacije, 12, 19, 160–165.
Ključanin, S., Poslončec-Petrić, V., Ponjavić, M., Karabegović, A., Landek, I., (2014): Strategija razvoja službene kartografije FB&H, rukopis, Geometrika d.o.o., Grude, Bosna i Hercegovina.
Zdjelar, D. (1992): Prilog istraživanju izrade i primjene krupno razmjernih karata sa aspekta stanja i razvoja kartografije u Bosni i Hercegovini, disertacija, Građevin -ski fakultet, Univerzitet u Sarajevu, Sarajevo.
Generalizacija i vizualizacija topografskih karata
krupnih mjerila zasnovana na novoj metodologiji
SAŽETAK. Integriranje prostornih podataka iz različitih izvora rezultira vizualiza-cijom kao posljednjim korakom u izradi digitalnih osnovnih topografskih karata. Izvornici koji su korišteni za vizualizaciju jesu postojeća Baza podataka katastra nekretnina, ortofoto planovi i digitalni model terena, a za potrebe ispisa toponima korišteni su analogni katastarski planovi koji su skenirani i georeferencirani prema propisanim pravilima. Vizualizacija topološki ispitanih geometrijskih primitiva izve-dena je na osnovi ‘’Zbirke kartografskih znakova za mjerila od 1:500 do 1:2500’’ – pravilnika koji se primjenjuje u Republici Hrvatskoj, s obzirom da u Federaciji BiH ne postoji odgovarajući pravilnik. Pored integracije različitih prostornih podataka, prije vizualizacije, nužno je provesti odgovarajuću generalizaciju (ovisno o mjerilu osnovne topografske karte, primjenjuje se djelomična ili potpuna generalizacija). U ovom radu opisan je proces generalizacije i vizualizacije podataka, koji su prikuplje-ni i obrađeprikuplje-ni u skladu s topografskim modelom podataka Uprave za geodetske i imovinsko-pravne poslove Federacije BiH.
Ključne riječi: osnovna topografska karta, topografski model podataka, generalizaci-ja, vizualizacija.
Primljeno / Received: 2015-05-08 Prihvaćeno / Accepted: 2015-07-17