Mackinnon Lawrence
Research Director
Eric Woods
Research Director
Smart Waste
Advanced Collection, Processing, Energy Recovery,
and Disposal Technologies for the Municipal Solid Waste
Value Chain: Global Market Analysis and Forecasts
Published 2Q 2014
Section 1
E
XECUTIVE
S
UMMARY
1.1 The Evolving MSW Management Market
Both a threat to public health and environmental security and a strategic renewable resource, municipal solid waste (MSW) remains an inevitable byproduct of civilization and a prime target for clean technology innovation. Meanwhile, the MSW management industry is entering a period of active development, as the total volume of waste generated globally is expected to grow from 1.5 billion tons in 2014 to 2.2 billion tons by 2023. Two macro trends define the expected MSW management industry advancements over the next 2 to 3 decades:
» Growing waste volume: 97% of waste volume growth is expected to come from Asia Pacific and Africa, primarily in developing economies across these regions.
» Changing waste composition: MSW composition will change as developing countries transition to consumer-oriented economies and become more complex due to increasing volumes of electronic waste (e-waste) and new types of waste entering the waste stream. Although these changes will not occur suddenly, this dynamic evolution in an otherwise stable industry offers a wealth of opportunities. Existing waste hauler stakeholders and new waste management industry market entrants will have fertile ground for commercializing disruptive technologies. Municipal governments tasked with contracting for MSW services will benefit from the maturation of these emerging smart technologies.
While one of the key measures of a society’s advance is the degree to which it can distance itself from its trash, waste is increasingly viewed as a strategic resource. Efforts to divert an increasing percentage for higher-value applications are driven by innovations across the value chain. This focus on waste as a strategic renewable resource for material and energy recovery is at the heart of the smart MSW revolution. The commercialization of emerging smart
technologies that improve MSW management, in particular, offer stakeholders the opportunity to enhance MSW collection, increase diversion and recycling, generate renewable energy, and optimize the environmental performance of landfills.
1.2 The Smart MSW Technology Opportunity
There is no widely recognized bright line distinguishing traditional MSW management technologies from smart MSW management technologies. Essentially, the smart MSW technology market involves the integration of advanced technologies into a strategic solution that enhances sustainability, resource efficiency, and economic benefits. The use of these technologies results in more integrated waste management offerings that move beyond the traditional use of labor, diesel trucks, and open pits to discard waste.
©2014 Navigant Consulting, Inc. Notice: No material in this publication may be reproduced, stored in a retrieval system, or transmitted by any means, in whole or in part, without the express written permission of Navigant Consulting, Inc.
Navigant Research expects that, in the future, these solutions will form an ecosystem of technologies spanning the entire MSW chain of command. This integrated model aims to maximize the renewable benefits of MSW as a strategic resource while minimizing the long-term externalities associated with discarding waste. Smart MSW technologies touch on four separate phases of the traditional MSW management value chain (including representative technologies):
» Smart collection (e.g. radio frequency identification [RFID] tagging, global positioning system [GPS] routing, and pneumatic tubes)
» Smart processing (e.g. advanced material recovery facilities [MRFs] and mechanical biological treatments [MBTs], and refuse-derived fuel [RDF] production facilities)
» Smart energy recovery (e.g., waste-to-energy [WTE], waste-to-fuels [W2F], and landfill gas-to-energy)
» Smart disposal (e.g. sanitary landfilling, bioreactor landfills, and solar integration) Smart MSW technologies are diverse, including examples such as RFID and GPS solutions to streamline collection, optical sorting to enhance automation at processing facilities, gasification of MSW into advanced biofuels, and sensors and software used to remotely monitor landfill performance.
1.3 Smart MSW Technology Market Trends
Although an estimated 43% of the global MSW stream is handled by some aspect of the smart MSW technology market at some point along the existing waste chain of command, the market is in a nascent stage of development. Even in mature waste management markets like North America and Western Europe, opportunities abound for commercializing emerging technologies and extending investments across the entire waste management value chain.
General rules of thumb will help guide waste management strategies in the future, affecting the rate of diffusion of smart MSW technologies:
» The development of advanced infrastructure is and will be expensive for many years for most of the countries that need it the most.
» The required infrastructure, even when the financial resources are available, is delivered much slower than the rapid growth of waste generation.
» The current waste management systems are not capable of jumping from open dumps to high-tech systems.
These rules of thumb suggest that the diffusion of smart MSW solutions will take time, despite strong support for integrating advanced technologies, due to the relative cost to basic
infrastructure upgrades.
©2014 Navigant Consulting, Inc. Notice: No material in this publication may be reproduced, stored in a retrieval system, or transmitted by any means, in whole or in part, without the express written permission of Navigant Consulting, Inc.
Meanwhile, the evolution of MSW management practices is not linear in all cases and encompasses a broad suite of technologies at varying levels of commercialization. Many of these technologies are deployed jointly as a strategic platform to maximize the synergistic benefits each offers. For example, at a minimum, many countries will incorporate at least some aspect of smart MSW management, such as sanitary landfills combined with landfill gas-to-energy (LFGTE) recovery. In some cases, the utilization of smart MSW management strategies and technologies will be far more pervasive than in others. In Western Europe, for example, limited space, high landfill tipping fees, regulations that encourage alternatives to landfilling, available capital, and strong incentives for renewable energy all combine to make the region the most mature smart MSW technology market globally. In the developing world, the speed with which technologies from more mature smart MSW technology markets can be transferred and adopted remains a key question for the waste management industry.
1.4 Market Forecasts
Navigant Research estimates that 644.0 million tons of MSW was managed by smart MSW technologies in 2014. This volume is expected to increase to 938.4 million tons by 2023, representing $42.2 billion in cumulative revenue generated from installed smart MSW
technology over the forecast period. Between 2014 and 2023, annual revenue from smart MSW technology is expected to experience a 12.2% compound annual growth rate (CAGR),
significantly outpacing annual revenue growth from conventional MSW technology (4.0% CAGR).
Chart 1.1 Cumulative Smart MSW Technology Revenue by Region, World Markets: 2014-2023
(Source: Navigant Research)
40% 41% 41% 42% 42% 43% 43% 44% $5,000 $10,000 $15,000 $20,000 $25,000 $30,000 $35,000 $40,000 $45,000 2014 2015 2016 2017 2018 2019 2020 2021 2022 2023 (Sm art M SW Sh are ) ($ M illio ns )
North America Western Europe Eastern Europe Asia Pacific Latin America Middle East
Africa Smart MSW Share
©2014 Navigant Consulting, Inc. Notice: No material in this publication may be reproduced, stored in a retrieval system, or transmitted by any means, in whole or in part, without the express written permission of Navigant Consulting, Inc.
Globally, 43% of MSW generated will be handled by smart MSW technology in 2014. This share is expected to decline slightly as MSW generation volume growth outpaces smart MSW technology investment. North America, Western Europe, and Asia Pacific will generate the greatest share of smart MSW technology revenue globally over the forecast period. The smart energy recovery segment, by far the most mature of the four smart MSW technology segments analyzed in this report, is expected to account for 64% of cumulative new revenue in the smart MSW technology market. This reflects continuing investment in mature technologies like incineration-based WTE and LFGTE and the deployment of emerging conversion platforms that require higher upfront capital.
©2014 Navigant Consulting, Inc. Notice: No material in this publication may be reproduced, stored in a retrieval system, or transmitted by any means, in whole or in part, without the express written permission of Navigant Consulting, Inc.
Section 2
M
ARKET
I
SSUES
2.1 The MSW Opportunity
The municipal solid waste (MSW) opportunity is substantial across all geographies. A truly democratized resource, all societies generate waste, and in turn, must devise strategies for managing it. Although population growth and urbanization are not the only indicators of waste generation, they are critical ones.
Recently surpassing 7 billion people, the world’s population is not only growing in number, but its propensity to consume is also accelerating. By 2030, the global population is forecast to reach 8.6 billion, with growth highest in countries in Asia Pacific, Latin America, and Africa. As a result, the amount of MSW generated throughout the world continues to accelerate despite stabilizing volume growth in many high-income economies. With waste generation rates set to more than double over the next 20 years in low- and middle-income countries, the costs of managing the waste is also expected to see a steep rise. Cost increases will be most severe in low-income countries (more than fivefold increases) followed by middle-income countries (more than fourfold increases), according to World Bank.
Meanwhile, MSW sits at the confluence of three global challenges associated with population growth: energy supply, climate change, and waste generation. All three challenges are compounded by increasing urbanization rates and rising incomes, particularly in developing countries throughout Asia Pacific, Latin America, and Africa. With nearly 2 billion tons of MSW generated in urbanized areas – a volume expected to grow at an annual rate of 4% worldwide over the next decade – opportunities to leverage smart MSW technologies are widespread. 2.1.1 Understanding Waste Streams
There are many types of wastes generated worldwide, including:
» Household
» Commercial
» Industrial
» Construction and demolition
» Agricultural
» Sewage
» Mining and quarrying
©2014 Navigant Consulting, Inc. Notice: No material in this publication may be reproduced, stored in a retrieval system, or transmitted by any means, in whole or in part, without the express written permission of Navigant Consulting, Inc.
Of the various types of waste generated, MSW represents the portion relevant to this report. MSW is primarily composed of waste that is produced by the household, but also includes some commercial and industrial waste similar in nature to household waste and would otherwise be deposited in municipal landfill sites.
Different jurisdictions strictly regulate the materials that are included in MSW, which leads to significant variance among definitions and composition within different countries. Specifically, definitions determine the combustible, renewable, organic, and biological components and the characterization of MSW as biomass or a renewable feedstock. These characterizations have important consequences for determining if waste management strategies like waste-to-energy (WTE) can qualify for any subsidies and financing opportunities.
Although there is general agreement across jurisdictions with respect to the exclusion and inclusion of hazardous and non-hazardous materials in MSW classifications, definitions vary considerably across different countries and international organizations. Some opponents argue that since MSW is partially composed of products produced from fossil fuels, it should not be treated as a renewable resource, but this remains the exception.
2.1.2 Global MSW Generation
On a global scale, calculating the amount of waste generated is challenging because many countries do not track waste generation or disposal statistics. In developing countries, this is partially linked to a lack of formalized municipal waste collection systems. Where this data is collected, inconsistencies in the way countries report statistics – definitions and surveying methods employed by countries vary greatly – can lead to substantial discrepancies among published studies. Accordingly, a range of conflicting estimates is offered.
A recent report published in 2012 by World Bank, What a Waste, is among the most widely cited studies.1 According to this study, the amount of MSW generated is growing faster than
the rate of urbanization. World Bank estimates that roughly 3 billion urban residents generated an average 1.2 billion kg per capita per day (1.3 billion tonnes per year or 1.43 billion tons per year) in 2012. By 2025, this is expected to increase to 4.3 billion urban residents generating about 1.42 kg per capita per day of MSW (2.2 billion tonnes per year or 2.4 billion tons per year). This represents a 900 million tonnes (992 million tons) increase in a little over a decade, a near doubling of the total volume of MSW generated globally today.
1What a Waste: a Global Review of Solid Waste Management, World Bank, 2012.
©2014 Navigant Consulting, Inc. Notice: No material in this publication may be reproduced, stored in a retrieval system, or transmitted by any means, in whole or in part, without the express written permission of Navigant Consulting, Inc.
6
Building on this analysis, Navigant Research projects that the total MSW generated globally in 2014 will be 1.5 billion tons, increasing to 2.2 billion tons by 2023. Substantial growth in the volume of waste generated in Asia Pacific and Africa will be one of the defining trends of the next decade in the global waste management market.
Chart 2.1 MSW Generation Volume Share by Region, World Markets: 2014-2023
(Sources: Navigant Research, World Bank)
2.1.3 Regional MSW Composition
Often composed of carbon-rich matter, MSW is an underutilized resource throughout the world, but it also presents many unique challenges. Specifically, the heterogeneous nature of MSW limits the degree to which cookie-cutter solutions can apply to a large swath of the market. For example, certain types of plastics have more than 3 times the heat content of yard trimmings or organic textiles, but may present more challenges with respect to conversion. Variances in composition may necessitate tailored strategies for handling waste streams. In many cases, MSW handling must account for varying moisture content and materials sizing, which in some cases necessitates the preprocessing of the waste prior to thermal treatment typically involved in the WTE recovery process.
Income levels, economic growth, and changing lifestyles affect MSW composition. In general, most of the MSW generated globally contains high fractions of organics and paper, compared to the lower amounts of plastics, glass, and metals. Poorer households generate higher fractions of organic waste than wealthy ones; the same goes for lower-income nations. There are discrepancies observed between rural and urban households, as well, with rural areas also generating higher percentages of organic waste. High fractions of organics lead to a dense and humid waste that affects not only the collection and transport system, but also its recycling 0% 10% 20% 30% 40% 50% 60% 70% 80% 90% 100% 2014 2015 2016 2017 2018 2019 2020 2021 2022 2023
Africa Middle East
Latin America Asia Pacific Eastern Europe Western Europe North America
©2014 Navigant Consulting, Inc. Notice: No material in this publication may be reproduced, stored in a retrieval system, or transmitted by any means, in whole or in part, without the express written permission of Navigant Consulting, Inc.
potential. In high-income countries, the consumption of processed food and packaged products results in a higher percentage of inorganic materials such as metals, plastics, and glass. Generally, all low- and middle-income countries have a high percentage of compostable organic matter in the urban waste stream, ranging from 40% to 85% of the total. Waste streams in higher-income countries, by contrast, have a higher percentage of inorganics. The relative proportion of MSW components across select countries is depicted in Chart 2.2.
Chart 2.2 MSW Composition by Country, Select Markets: 2012
(Source: World Bank)
2.1.4 MSW, Urbanization, and Rising Levels of Affluence
The long shadow of societal development, waste generation is an unavoidable byproduct of urbanization and rising incomes, which lead to greater use of resources and, inevitably, more waste. While population growth drives a general increase in waste generation (more people equals more waste), urbanization and rising levels of affluence can also accelerate waste generation rates (waste generation per capita), often outpacing a jurisdiction’s ability to safely and sustainably manage the problem. Despite efforts by activists to curb superfluous
consumption, and therefore waste, urbanization and affluence is placing significant pressure on governments around the world to manage rapidly growing volumes of waste. In the face of multiple threats – energy security, environmental degradation, climate change, resource depletion, etc. – integrated waste management approaches are playing an increasingly important role in coordinating a suite of strategies across the waste value chain in accordance with ecological and domestic energy principles.
0% 10% 20% 30% 40% 50% 60% 70% 80% 90% 100% Ind one si a B ra zil N ig er ia C hi na Pol and India Fr anc e Sout h Ko re a U nit ed St at es C an ad a Jap an G er m an y
Others Glass Metal Plastic Paper Organics
©2014 Navigant Consulting, Inc. Notice: No material in this publication may be reproduced, stored in a retrieval system, or transmitted by any means, in whole or in part, without the express written permission of Navigant Consulting, Inc.
2.1.4.1 Urbanization and Waste Generation
Among these trends, urbanization presents the greatest challenge for waste management infrastructure. Over 50% of the global population – roughly 3.2 billion people – currently lives in urban areas or cities. By 2050, this share is expected to grow to 70% of the estimated 9.6 billion people on Earth, resulting in a more than doubling of urban residents globally (6.7 billion people) over the next 30 to 40 years. Assuming relative consumption patterns remain static over this period, this would result in a doubling of the amount of waste that must be collected and managed over that time. With 83% of waste under active management today globally, there is significant growth potential in the waste management industry.
As illustrated in Figure 2.1, the urbanization trend is increasing more rapidly in the developing world, especially in Africa, Asia, and Latin America. Compared to the more developed
economies in North America and Europe, these areas are already lacking pervasive collection, management, and processing infrastructure, making the acceleration of waste generation an even more acute challenge. In particular, WTE offers significant benefits for these countries, which are also facing significant challenges associated with meeting fast-increasing electricity demand as well.
Figure 2.1 Percentage of Population at Mid-Year Residing in Urban Areas by Region: 1950-2030
(Source: United Nations)
©2014 Navigant Consulting, Inc. Notice: No material in this publication may be reproduced, stored in a retrieval system, or transmitted by any means, in whole or in part, without the express written permission of Navigant Consulting, Inc.
2.1.4.2 The Rise of the Global Middle Class
Coupled with urbanization, rising level of affluence acts as an accelerant on waste generation in developing economies. Improvement in relative living standards within countries, which goes hand-in-hand with increased purchasing power, drives increases in the rate of consumption. In most developing economies, waste generation rates range between 0.5 kg and 1.5 kg per capita per day. In developed economies, this rate is typically closer to 2 kg to 3 kg per capita per day.
The gross national income (GNI) of countries based on purchasing power parity per capita is often used as a measure for comparing the relative standards of living across different countries. As shown in Chart 2.3, this measure shows a high degree of correlation with waste generation rates per capita across economies in various stages of development.
Chart 2.3 Waste Generation per Capita to Gross National Income Ratio, World Markets: 2014
(Sources: Navigant Research, World Bank)
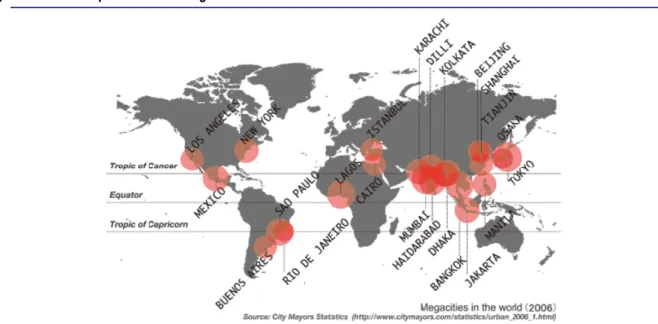
2.1.4.3 Megacities: A Super-Sized Challenge
While all urban centers throughout the world grapple with solid waste management challenges, the situation is most acute in the world’s rapidly emerging megacities. Generally defined as having over 10 million inhabitants, with space at a premium and shantytowns on the rise, megacities are quickly morphing into megaregions or megacorridors. By 2015, there will be 21 projected megacities globally, with over half in Asia Pacific. By 2030, this number is expected to increase to more than 35 megacities with almost 1 billion inhabitants. By 2050, 7 out of 10 people will live in megacities, offering the benefits of concentrated living but also some of the biggest public works challenges in human history. While megacities will struggle to keep pace
United States Canada Germany United Kingdom Poland China India Brazil Mexico Nigeria Indonesia Turkey South Korea Russia Japan 0.5 1.0 1.5 2.0 2.5 3.0 $- $10,000 $20,000 $30,000 $40,000 $50,000 $60,000 (W ast e p er C ap ita -kg )
(Gross National Income per Capita, PPP - $)
©2014 Navigant Consulting, Inc. Notice: No material in this publication may be reproduced, stored in a retrieval system, or transmitted by any means, in whole or in part, without the express written permission of Navigant Consulting, Inc.
with providing the necessities of urban living with explosive population growth, MSW management provides opportunities to promote sustainable growth, including environmental stewardship, low carbon energy, and material recycling. These areas will be laboratories for many waste management-related innovation and investment strategies.
Figure 2.2 Map of World’s Megacities: 2006
(Source: City Mayors Foundation)
©2014 Navigant Consulting, Inc. Notice: No material in this publication may be reproduced, stored in a retrieval system, or transmitted by any means, in whole or in part, without the express written permission of Navigant Consulting, Inc.
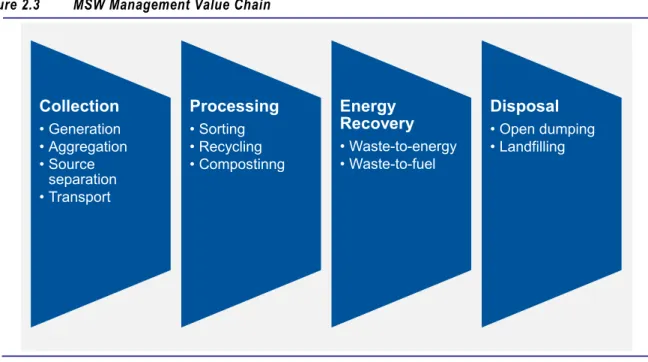
2.2 Defining the Smart MSW Management Value Chain
The MSW value chain – sometimes referred to as the waste chain of command – extends from the upstream source of trash, typically a home, business, or other entity, to downstream final disposal in landfills or other means of final treatment. Navigant Research segments this value chain into four primary categories of technologies and activities examined in this report (outlined in Figure 2.3).
Figure 2.3 MSW Management Value Chain
(Source: Navigant Research)
In this study, the smart MSW technology value chain is organized across the same four categories as the conventional waste management value chain, but includes many more stakeholders and technology options that increase efficiency, energy and material recovery, and landfill diversion.
As a whole, the smart MSW market involves a diverse set of stakeholders, with vertically integrated companies among the most visible. While numerous traditional stakeholders are embracing various aspects of the smart MSW value chain, many small and medium enterprises (SMEs) offer innovative solutions that enhance the overall efficacy of waste management efforts by improving collection rates, increasing diversion, or mitigating the reliance on landfills. Key stakeholder groups are described briefly below:
» Integrated waste management players: Provide services ranging from the collection of MSW to final disposal. These private or publicly traded stakeholders are more prevalent in developed economies where municipalities are more likely to contract out the management of waste streams. Regionally, the integrated waste management market is highly
consolidated. Collection • Generation • Aggregation • Source separation • Transport Processing • Sorting • Recycling • Compostinng Energy Recovery • Waste-to-energy • Waste-to-fuel Disposal • Open dumping • Landfilling
©2014 Navigant Consulting, Inc. Notice: No material in this publication may be reproduced, stored in a retrieval system, or transmitted by any means, in whole or in part, without the express written permission of Navigant Consulting, Inc.
» Specialized waste management companies: Provide specific MSW management services along the value chain, typically relying on proprietary technology and processes to maintain market share. These companies are often privately owned
» Technology vendors and solutions providers: Offer products for the waste management industry, in some cases exclusively, as part of a broader suite of product offerings to industrial markets. These players can be software vendors and IT solutions providers, or providers of control technologies, process equipment, RFID solutions, and hardware for processing solid waste. There are few leading players in this space, as most companies provide highly specialized products.
While multiple stakeholders are involved in the collection and aggregation of MSW to final disposal or treatment, the relative maturity of various stages along the value chain varies significantly across countries. As described below, broad generalizations may be made about waste management practices across low-, middle-, and high-income countries. Developed economies are the primary target of growing investments in automation and IT capabilities, owing to efforts by integrated waste haulers to reduce operating costs in the face of stagnating waste generation rates and mitigate dependence on landfills due to more stringent regulations. Energy recovery projects are common across all countries, though Kyoto Protocol-financed Clean Development Mechanism (CDM) efforts are the primary driver of the adoption of landfill gas-to-energy (LFGTE) projects in developing economies.
Chart 2.4 Typical MSW Disposal Methods by Country Type, Representative Markets: 2012
(Sources: Navigant Research, World Bank)
0% 10% 20% 30% 40% 50% 60% 70% 80% 90% 100%
United States (High
Income) Poland (Upper MiddleIncome) Jordan (Lower MiddleIncome) Cambodia (Low Income)
Other WTE Recycled Compost Landfills Open Dumps
©2014 Navigant Consulting, Inc. Notice: No material in this publication may be reproduced, stored in a retrieval system, or transmitted by any means, in whole or in part, without the express written permission of Navigant Consulting, Inc.
2.2.1 Low-Income Country Value Chain
Low-income countries spend a predominant share of resources on upstream and midstream waste collection efforts and infrastructure, with only a fraction going toward downstream treatment and disposal. Despite these efforts, a large proportion of waste is left uncollected and is disposed in informal pits near and intermingled with population centers.
2.2.2 Low- and Upper-Middle-Income Country Value Chain
In developing and transitional countries – typically classified as middle-income countries – the largest share of investment is earmarked for improving the delivery of solid waste management services, with basic services delivered across a fraction of the population base. Meanwhile, a smaller, disproportionate share of resources is allocated toward the reduction and segregation of materials at the upstream source (e.g., recycling), as well as toward downstream processing and disposal. In some largely populated developing economies, like Brazil and India, waste picker networks have helped improve recycling rates, but frustrate efforts to transition toward more robust segregation of waste streams and diversion practices. Additionally, poor
accountability, owing to weak regulatory frameworks and unregulated markets for recyclables, has frustrated top-down efforts to modernize the waste management value chain.
2.2.3 High-Income Country Value Chain
In developed economies, investment is targeted primarily toward mitigating the dependence on landfills through diversion or waste mitigation, especially where space constraints either drive higher tipping fees or necessitate alternative disposal strategies. High-income countries have taken up recycling as an integral part of their waste (and resource) management systems. They have invested heavily in both physical infrastructure and communications strategies to improve their processing and disposal capabilities.
2.3 Market Drivers
While the drivers of solid waste management are diverse, at its core, waste management is a utility service embedded in the fabric of modern society. No matter how effective waste mitigation efforts may be, waste is an inevitable byproduct of civilization. Waste poses significant health and environmental safety risks. The effective management of waste includes mitigating the negative health and environmental externalities while also extracting value from waste in the form of raw materials or energy.
2.3.1 Public Health and Environmental Security
In most jurisdictions, mitigating the public health impact remains the primary motivation of solid waste management programs. Left untreated, accumulated waste can become a breeding ground for insects, vermin, and scavenging animals, which have been linked to the spread of air- and water-borne diseases. Surveys conducted by UN-Habitat show that in areas where waste is not collected frequently, the incidence of diarrhea is twice as high and acute respiratory infections are 6 times higher than in areas where collection is frequent.
©2014 Navigant Consulting, Inc. Notice: No material in this publication may be reproduced, stored in a retrieval system, or transmitted by any means, in whole or in part, without the express written permission of Navigant Consulting, Inc.
The mitigation of environmental impacts also drives waste management investment. While the waste management sector makes a relatively minor contribution to greenhouse gas (GHG) emissions – estimated at approximately 3% to 5% of total anthropogenic emissions globally – according to the United Nations Environment Programme, the waste sector is in a unique position to move from being a minor source of global emissions to becoming a major saver of emissions. Methane emissions from landfill represent the largest source of GHG emissions from the waste sector, contributing around 700 MtCO2e globally.
2.3.2 Urbanization and Sprawl
By its very definition, urbanization is a necessary prerequisite for MSW to exist in the first place. Different from agricultural waste, urban settlements produce a unique blend of waste components that necessitate collection and disposal or some degree of treatment. However, while MSW is an inevitable byproduct of urbanization, the growth of urban areas – both in population and geographic area – can be impeded by the accumulation of trash. Many of the world’s most famous cities face some form of geographic constraints, whether hemmed in by mountains or coastline, or in some cases, when urban growth rings are established to prevent sprawl and protect valuable agricultural areas in close proximity to urban areas. Informal heaps of trash and landfills occupy valuable real estate in or around the urban center. These informal trash heaps impede efforts to improve quality of life in densely populated areas in many fast-growing economies like China, India, and Nigeria. Landfills are a key concern for densely populated developed economies across Europe, Japan, and the U.S. Northeast. By addressing concerns around informal dumping and expanding landfills, smart waste management can reclaim areas overrun by trash and mitigate the dependence on urban landfills.
2.3.3 MSW as a Strategic Resource
The effective management of carbon – whether to reduce dependence on petroleum resources or mitigate the amount of carbon in the atmosphere to combat climate change – has forced a broad-scale effort to exploit renewable resources. Composed of plastics, organics, and other carbon-rich material, MSW is an ideal renewable energy resource because it is generated near areas of high demand for energy and coastal areas facing unique threats from climate change (studies show that 14% of the world population is under threat from sea level rise). Reliance on MSW mitigates dependence on imported energy resources as well, enhancing efforts to improve energy security.
While MSW conversion to energy results in new emissions, it allows for a second bite at the apple, so to speak. In other words, carbon material has already been converted into a product that was consumed and discarded. The conversion of that material into heat, gas, or liquid allows that resource to be consumed again as a feedstock for energy conversion. MSW left to decompose in landfills also produces methane gas, a GHG more than 20 times more potent than CO2. The capture of methane or conversion of MSW into gas (either synthetic gas
[syngas], a.k.a biogas) allows this gas to be consumed as a gas or liquid energy source.
©2014 Navigant Consulting, Inc. Notice: No material in this publication may be reproduced, stored in a retrieval system, or transmitted by any means, in whole or in part, without the express written permission of Navigant Consulting, Inc.
2.3.3.1 A Negative Cost Feedstock
MSW is particularly attractive as a feedstock for energy inputs because it is available at negative cost (i.e., can be a revenue source for facilities utilizing MSW as an input feedstock). In areas where MSW is managed by a formalized infrastructure, a tipping fee is paid to cover the cost of landfilling a given volume of trash. Likewise, facilities that utilize MSW as a feedstock can receive a similar tipping fee in lieu of payment to a landfill operator. In areas where tipping fees are particularly high – Western Europe, the U.S. Northeast, and Japan – these fees can provide a valuable revenue source for facility operators, helping to defray the high upfront costs associated with the construction and operation of a WTE conversion facility or biorefinery converting MSW to liquid fuels. Within the energy industry, this configuration has advantages over traditional energy conversion facilities (e.g., coal-power generation plants, natural gas generation plants, petrorefineries, etc.) that must build the cost of their feedstock into their pricing structure.
2.3.3.2 The Rise of Landfill Mining
Urban mining involves the reclamation and recycling of raw materials, minerals, and scrap metal from end-of-life (EOL) products in urban areas (old electronic equipment, buildings, and waste). Similarly, the value of MSW as a resource has manifested in efforts to mine trash from landfills in select areas. Although a rare occurrence outside of recycling initiatives aimed at discarded electronic waste (e-waste), this trend is expected to increase in the future, as incumbent resources are increasingly depleted and advanced MSW conversion technologies gain traction in the market. Urban mining also allows crowded metropolitan areas to reclaim landfill areas for future development to accommodate population growth and urban expansion, especially in areas where urban sprawl has enveloped traditional landfills.
Nevertheless, urban mining is still in its infancy. Currently, the economics have yet to materialize into a compelling business case in most areas of the world. According to major waste haulers, though, the trend is likely to gain traction within a decade.
2.4 Market Challenges
Despite the strong drivers for MSW management and technology innovation, many barriers persist that prevent more widespread commercialization. MSW is a particularly challenging feedstock to work with due to its heterogeneity and variation in composition across
geographies. Smart MSW technology is capital-intensive due to the infrastructure requirements for many projects. As such, the availability of working capital will be a key determinant in how well waste management operators make the jump to more sophisticated, integrated service offerings.
2.4.1 Waste Composition
Due to its heterogeneous nature and variance across income levels, geographies, and lifestyles, waste presents many challenges with respect to processing and energy recovery. Some materials found in MSW have higher heat content than others. For example, certain types of plastics have more than 3 times the heat content of yard trimmings or organic textiles. ©2014 Navigant Consulting, Inc. Notice: No material in this publication may be reproduced, stored in a retrieval system,
or transmitted by any means, in whole or in part, without the express written permission of Navigant Consulting, Inc.
In general, combustible non-biogenic materials are characterized by higher heat contents per unit weight than combustible biogenic materials. Thus, the ratio of biogenic to non-biogenic material volumes can have a considerable effect on the heat content of the waste stream. MSW utilization is impeded by its varying moisture content and materials sizing, which in some cases necessitates the pre-processing of the waste prior to thermal treatment. Increasingly, source separation of waste – the separation of homogenous materials from the MSW – is gaining in importance throughout the world. In some cases, the biogenic portions of MSW may also be separated for biological treatment to maximize the recoverable energy and post-processed materials. Collecting and recycling waste close to its source of generation reduces the remaining amount of waste to be handled further and alleviates the municipal burden. 2.4.2 Out-of-Sight, Out-of-Mind
One of the primary challenges to smart MSW technology adoption is the status quo, which in most cases is the relative ease and low cost of landfilling. From a society’s perspective, modern landfill management eliminates many of the immediate public health threats associated with waste. For waste haulers, landfilling is a relatively inexpensive solution that translates into tidy profits in the form of tipping fees. Where land is cheap and abundant, it is nearly
impossible to upset this balance, enabling waste to be removed and disposed of indefinitely. In the United States, this dynamic is in full display. In most cases across the country, the default option is to ship waste off to a remote landfill. Away from the densely populated areas along the East and West Coasts, low tipping fees and relatively inexpensive land translate into low-cost waste management, which mitigates the penetration of smart MSW solutions. Along the more densely populated coasts, where land is available at a premium, higher tipping fees and diminishing landfill capacity are upsetting the status quo. In these situations, the general public and policymakers are more likely to contemplate smart MSW alternatives to traditional landfilling.
2.4.3 Not in My Backyard
A corollary to the out of sight, out of mind dynamic described above, in many regions globally, the public remains deeply opposed to the siting of MSW processing facilities near urban centers. The perception around traditional WTE combustion facilities, especially in places like the United States, is that they spew harmful chemicals and contaminants into the environment. Much of the opposition to incineration and the thermal treatment of MSW dates back to the time when the air emissions of incinerators were not controlled, leading to significant levels of untreated flue gas escaping into the atmosphere. Not surprisingly, not in my backyard (NIMBY) has proven to be one of the strongest barriers to the development of WTE, modern material recovery facilities (MRFs), and other smart MSW solutions.
Faced with limited land availability and incinerating at least 70% of its MSW, Japan has been successful at ratcheting up restrictions on emissions to drive technological advances in the treatment of incinerator emissions. The Japanese public remains widely supportive of
gasification facilities. Public opposition to smart waste processing infrastructure in Scandinavia ©2014 Navigant Consulting, Inc. Notice: No material in this publication may be reproduced, stored in a retrieval system,
or transmitted by any means, in whole or in part, without the express written permission of Navigant Consulting, Inc.
is also insignificant, and the barriers to develop WTE are lower than in other countries. In these cases, governmental efforts focused on educating municipalities and the broader public has proven to be effective. The Swedish government in particular has been successful at involving the local population and minimizing the potential for public backlash to the construction of WTE facilities.
The negative perceptions around WTE and other waste processing infrastructure have started to be addressed through innovative architectural design. While there are a handful of facilities incorporating architectural elements to better blend in with the urban landscape, concept designs have expanded thinking around how to appease public opposition through outside-the-box renderings. In Denmark, the international architectural firm Bjarke Ingels Group is developing a project that incorporates a facade to mask the industrial core of the facility while doubling as a ski slope for recreational purposes. Dubbed Amagerforbraending, the project will replace an adjacent 40-year-old power plant and represents the single largest environmental initiative in Denmark. With a budget of $640 million, the project will be completed in 2015. Figure 2.4 Artist’s Rendering of Amagerforbraending Facility
(Source: Bjarke Ingels Group)
2.4.4 Cost
Cost remains a significant barrier to the advancement in smart waste practices and
infrastructure. Generally, developing economies lack the capital to collect and manage waste at a basic level, let alone invest in smart waste. This is partly due to the prevalence of municipal stakeholders driving investment in the waste management industry. These entities are often faced with rapidly expanding populations and multiple infrastructure and service demands with inadequate means to collect revenue from its citizenry. Private investment in these economies is mostly focused on building and managing sanitary landfills and landfill gas (LFG) recovery projects. While the Kyoto Protocol was still in force, many (if not most) projects in the latter category were funded through the CDM, established under Article 12 of the
Protocol.
©2014 Navigant Consulting, Inc. Notice: No material in this publication may be reproduced, stored in a retrieval system, or transmitted by any means, in whole or in part, without the express written permission of Navigant Consulting, Inc.
Investment in smart waste within developed economies is spearheaded primarily by private stakeholders. Private companies focused on waste hauling, for example, are actively investing in IT and automation enabling technologies to reduce operating costs. Infrastructure projects such as MRFs, WTE facilities, and gasification projects are often built in partnership with or in response to solicitations initiated by municipalities. Given the relative cost of resource and energy recovery to landfilling, regulations and incentives are key contributors to investments in these projects.
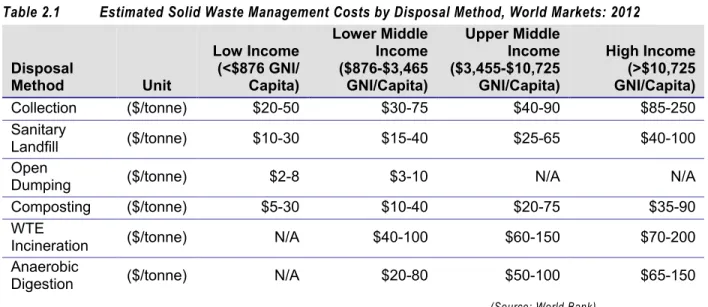
World Bank recently published the following cost metrics for various waste management applications. As can be seen in Table 2.1, there is significant variance even within country income classifications.
Table 2.1 Estimated Solid Waste Management Costs by Disposal Method, World Markets: 2012
Disposal Method Unit Low Income (<$876 GNI/ Capita) Lower Middle Income ($876-$3,465 GNI/Capita) Upper Middle Income ($3,455-$10,725 GNI/Capita) High Income (>$10,725 GNI/Capita) Collection ($/tonne) $20-50 $30-75 $40-90 $85-250 Sanitary Landfill ($/tonne) $10-30 $15-40 $25-65 $40-100 Open
Dumping ($/tonne) $2-8 $3-10 N/A N/A Composting ($/tonne) $5-30 $10-40 $20-75 $35-90 WTE
Incineration ($/tonne) N/A $40-100 $60-150 $70-200 Anaerobic
Digestion ($/tonne) N/A $20-80 $50-100 $65-150
(Source: World Bank)
While there is no general cost metric that dictates which waste management solutions should be deployed in given locations and circumstances, there are general rules of thumb that help guide waste management strategies:
» The development of advanced infrastructure is and will be expensive for many years for most of the countries that need it the most.
» The required infrastructure, even when the financial resources are available, is delivered much slower than the rapid growth of waste generation.
» The current waste management systems are not capable of jumping from open dumps to high-tech systems.
These rules of thumb suggest that the diffusion of smart MSW solutions will take time, despite strong support for integrating advanced technologies due to the relative cost to basic
infrastructure upgrades.
©2014 Navigant Consulting, Inc. Notice: No material in this publication may be reproduced, stored in a retrieval system, or transmitted by any means, in whole or in part, without the express written permission of Navigant Consulting, Inc.
2.4.5 Policy Uncertainty
Regulatory uncertainty is often cited among waste industry stakeholders as a key obstacle to increased investment in smart MSW infrastructure development. For example, industry stakeholders seek long-term environmental and renewable energy policies that put WTE or liquid fuels derived from waste on par with competing technologies. Irrespective of the current market climate, investors have limited tolerance for investments that carry a high degree of risk. Due to the challenging economics associated with advanced waste recovery projects, a
changing regulatory and policy landscape may limit investor appetite, thereby making it more difficult to access financing. Policy risk may also drive up the cost of capital and make it harder for more expensive infrastructure projects to prove economic viability.
2.4.5.1 Climate Change and GHG Regulation
The failure of international consensus to materialize around a binding climate change
agreement has resulted in haphazard and narrow national efforts to regulate GHGs, narrowing the availability of incentives that offer price for MSW energy recovery projects. As a result, many renewable energy project developers, as well as the financing community, have viewed carbon pricing as icing on the cake for projects like LFG recovery and WTE. In developing countries, however, CDM-related financing has played a crucial role in getting LFG recovery projects built.
2.4.5.2 Evolving Waste Management Policies
Developed countries like the United States and member states within the European Union (EU) are in the beginning stages of implementing robust integrated waste management policies. As developing countries manage the collection and handling of waste in a more coordinated way, they are likely to follow suit. Because integrated waste management requires the coordination of laws and regulations affecting a range of stakeholders, the evolving policy landscape will create many uncertainties in the market and have knock-on consequences for competing solutions. For example, the success of recycling and composting programs will affect the composition and volume of waste streams reaching WTE facilities.
2.4.6 Shale Gas
According to the International Energy Agency’s Are We Entering a Golden Age of Gas? report published in mid-2011, a rapid increase in natural gas production is expected by 2035, with unconventional sources accounting for a quarter of total production. Gas is forecast to meet one-quarter of global energy demand by 2035, with demand growing 2% annually, compared with just 1.2% for total energy. Total electricity demand will increase 70% by 2035,
underpinned by a near doubling of gas-fired generation.
The emergence of shale gas in North America in particular has stifled investment in new energy recovery projects due to the relative cost of developing natural gas-fueled generation and waste-fueled generation (i.e., LFGTE, anaerobic digestion, and incineration). Growth in shale gas production is also likely to have a longer-term dampening effect on electricity rates in the
©2014 Navigant Consulting, Inc. Notice: No material in this publication may be reproduced, stored in a retrieval system, or transmitted by any means, in whole or in part, without the express written permission of Navigant Consulting, Inc.
United States, which will stifle investment in new MSW energy recovery projects across the country.
Syngas derived from MSW, a nascent segment within the smart MSW technology market, will be affected by shale gas developments, as well. A low-Btu gas consisting mostly of carbon monoxide and hydrogen, syngas is combustible and can be used as a fuel for internal combustion engines (ICEs), such as in a diesel engine, while mimicking the properties of propane. Current gasifier technologies, however, are not financially competitive on a commercial scale.
2.5 An Emerging Policy Framework
No one policy will define the smart MSW technology market. Managing waste is a complex task that requires the coordination of changes in consumption and waste production patterns, appropriate technology, organizational capacity, and cooperation among a wide range of stakeholders. Incentives and regulations around how waste is managed will play a central role in driving investment in waste management and in further developing the smart MSW
technology landscape. Policies that discourage reliance on landfilling appear to have the most profound impact, as evidenced by progress in Western Europe, but energy recovery-focused policies show the greatest potential for encouraging the growth of smart MSW technologies. 2.5.1 The Waste Management Hierarchy
The waste management hierarchy (also described as the waste management pyramid) has gained traction globally as a communication tool used by governments and advocacy organizations to encourage sustainability and responsible stewardship of waste resources. Figure 2.5 illustrates a prioritization of waste management strategies starting from the most favored strategy (avoidance or prevention) to the least favored strategy (landfilling and incineration without energy recovery).
Figure 2.5 Waste Management Hierarchy
(Source: European Commission)
©2014 Navigant Consulting, Inc. Notice: No material in this publication may be reproduced, stored in a retrieval system, or transmitted by any means, in whole or in part, without the express written permission of Navigant Consulting, Inc.
The proper application of the waste hierarchy has several purported benefits: » Prevents emissions of GHGs » Reduces pollutants » Saves energy » Conserves resources » Creates jobs
» Stimulates the development of green technologies
The United States and the EU have both adopted policies based on the waste management hierarchy that prioritizes objectives for waste diversion from landfills. In the EU, the waste management hierarchy provides a blueprint for stringent regulations targeting the waste stream, ultimately culminating in zero landfill initiatives. In the United States, where waste management regulations are generally less stringent, the hierarchy serves as an aspirational objective, but has yet to be formally translated into a broadly applicable regulatory regime.
In both cases, recycling and waste diversion (or landfill avoidance) are the principal means by which policymakers minimize the environmental and land use impacts of waste. Typically, legislation will require that a specific percentage of waste be diverted from landfills. This was the case in California, which passed one of the most aggressive laws in 1989, requiring cities and counties to divert 25% of waste by 1995 and 50% by 2000. As a result, the landfilling rate in California dropped from 90% in 1989 to 42% by 2007.
2.5.2 Zero Waste Initiatives
Zero waste initiatives are gaining traction as a policy tool for driving compliance with the waste management hierarchy. While it is impossible to eliminate waste entirely, zero waste goals are effective drivers of innovation across the waste management value chain. Zero waste initiatives are most common in jurisdictions where the following three factors are in place:
» Limited landfill capacity
» Self-directed manufacturer interest in avoidance of use of virgin material input to reduce costs
» Diversion of organics to reduce the amount of methane generation from landfills
Some jurisdictions have enacted legislative mandates aimed at achieving zero waste. These mandates are more stringent than aspirational goals set by a number of communities around the world. While most jurisdictions prioritize reduction and recycling programs, in places like Japan where space is at a premium, the adoption of thermal treatment strategies for waste help reduce the volume of waste that ultimately is landfilled. Landfill directives in the EU make it increasingly difficult to site new landfills and indirectly discourage waste disposal due to increases in tipping fees.
©2014 Navigant Consulting, Inc. Notice: No material in this publication may be reproduced, stored in a retrieval system, or transmitted by any means, in whole or in part, without the express written permission of Navigant Consulting, Inc.
In some cases, zero waste initiatives can inhibit alternative approaches to waste recovery. The most hardline proponents of zero waste have prevented proposals for MRF and WTE facilities, arguing that such facilities frustrate efforts to reduce waste generation as prioritized by the waste management hierarchy.
2.5.3 Incentives
Incentives are the carrots that encourage greater utilization of waste as a resource and discourage reliance on landfilling and other last resort disposal practices. They are available primarily in higher-income countries with established waste management regimes. Among those, countries with more landfilling constraints and more stringent regulations around disposal (e.g., the EU and Japan) tend to be more inclined to rely on incentives to divert MSW away from or reduce the volume of MSW disposed in landfills.
2.5.3.1 Landfill Taxes
A landfill tax or levy is a form of tax that is applied in some countries to increase the cost of landfill. Landfill taxes are typically levied in addition to the overall cost of landfill and form a proportion of the tipping fee. The goal of landfill taxes can be generally divided into three categories:
» Raise general revenue
» Generate funds for inspection programs or long-term mitigation of environmental impacts related to disposal
» Inhibit disposal by raising the cost in comparison to preferable alternatives (similar to an excise, or sin, tax)
In zero-waste jurisdictions, or where space is at a premium, this latter goal is a key driver of smart waste investment. New Zealand, the United Kingdom, and California all have landfill taxes in place to discourage reliance on landfilling compared to other disposal alternatives.
2.5.3.2 Pay-as-You-Throw
Pay-as-you-throw (PAYT) is a usage pricing model for disposing of MSW in which users are charged a rate based on how much waste they discard for collection to the municipality or local waste hauler. Prices are determined by the weight or size of waste discarded. Units are typically identified using different types of bags, tags, containers, or radio frequency identification (RFID).
Three primary PAYT models are typically implemented:
» Full unit pricing: Users pay for all the garbage they want collected in advance by purchasing a tag, custom bag, or selected size container.
» Partial unit pricing: The local authority or municipality decides on a maximum number of bags or containers of garbage, with collection paid by taxes. Additional bags or containers are available for purchase should the user exceed the permitted amount.
©2014 Navigant Consulting, Inc. Notice: No material in this publication may be reproduced, stored in a retrieval system, or transmitted by any means, in whole or in part, without the express written permission of Navigant Consulting, Inc.
» Variable rate pricing: Users can choose to rent a container of varying sizes, with the price corresponding to the amount of waste generated.
PAYT programs have been linked to improved diversion rates, reduction in the total volume of solid waste landfilled, waste management cost reduction, and in some cases, increased revenue for waste haulers. In successfully implemented programs, a 17% to 23% reduction in MSW has been achieved based on historical examples. Data from Europe shows that the source separation of certain material fractions can rise by over 100% after the introduction of PAYT, even when the respective collection systems for source-separated waste are already in place.
Although PAYT programs have been around for several decades, a spectrum of technological approaches to unit pricing, such as advances in RFID tagging and greater integration of data analytics, has contributed to an increase in the number of countries implementing programs. High investment and maintenance costs remain potential obstacles to the introduction of PAYT. Currently, an estimated 25% to 30% of the U.S. population is served by PAYT programs, compared to over 30% in Japan. Germany, the Netherlands, Sweden, Denmark, Austria, and Finland have been aggressive adopters of PAYT programs, which reflects a broader trend across Europe.
2.5.4 Energy Recovery
MSW’s primary attraction as a feedstock for energy recovery is its wide availability as a feedstock in close proximity to population centers where most energy is consumed globally. Moreover, MSW flips the traditional energy producer business model on its head by turning feedstock – traditionally one of the key operational cost drivers – into a revenue source. Energy recovery facility operators are typically paid a tipping fee to remove waste on behalf municipalities.
MSW is generally considered a renewable resource because it is sustainable and non-depletable. Despite this general designation, zero-waste advocates assert that MSW should not be treated as a renewable resource since portions of MSW consist of non-renewable elements. Under this view, to determine the percentage of energy output from MSW conversion that qualifies as renewable, there must be a measurement of the percentage of the feedstock coming from biological sources (e.g., food, paper, fabric, wood, or leather) and from fossil fuel sources – namely plastics. Due to the technical challenges this entails, policies generally count the whole volume of MSW as renewable. Accordingly, incentives for energy recovery from MSW are typically embedded in biomass-related initiatives focused on the production of power generation, renewable heat, or liquid fuels for transportation applications.
Generally, the cost of energy recovery from waste necessitates incentives to compete with incumbent energy sources. For power markets, typically this includes feed-in tariffs or net metering. For liquid fuel markets, renewable identification number (RIN) credits in the United States and other favorable tax treatments have incentivized the upgrading of waste-derived biogas or syngas into fuel products like ethanol, renewable diesel, and biomethane. Other
©2014 Navigant Consulting, Inc. Notice: No material in this publication may be reproduced, stored in a retrieval system, or transmitted by any means, in whole or in part, without the express written permission of Navigant Consulting, Inc.
incentives focused on driving investment in infrastructure projects utilizing waste as a feedstock include:
» Direct capital investment subsidies, grants, or rebates
» Tax credits
» Energy production payments or credits
» Public financing
2.5.4.1 Renewable Power and Thermal Targets
Renewable energy targets set either aspirational or mandated goals for the integration of renewable energy from biomass and waste in national electricity and thermal production portfolios. These targets are an important mechanism for directing long-term policy around MSW and reducing market risk for investors and project developers. A sampling of international mandates across individual countries is outlined in Table 2.2.
Table 2.2 Waste Power and Thermal Policy Targets by Country, World Markets: 2014
Country Renewable Targets Biomass Power & Thermal Targets
Australia 20% by 2020 N/A Brazil 16% by 2020 N/A China 3% by 2020 30 GW by 2020 Germany 50% by 2030 65% by 2040 80% by 2050 14% by 2020 (renewable heating) Indonesia N/A 810 MW by 2025 Japan 1.6% by 2014 N/A
Norway Additional 30 TWh/year by 2020 14 TWh annual production by 2020 Philippines 40% by 2020 76 MW by 2010 94 MW by 2015 267 MW by 2030 Sweden Additional 25 TWh/year by 2020 N/A
United Kingdom 15% by 2020 N/A
28 Member States
of the EU (EU-28) 20% by 2020 N/A
United States 80% by 2035 (aspirational) Renewable Portfolio Standard Contained in state-level
(Source: Navigant Research)
©2014 Navigant Consulting, Inc. Notice: No material in this publication may be reproduced, stored in a retrieval system, or transmitted by any means, in whole or in part, without the express written permission of Navigant Consulting, Inc.
2.5.4.2 Next-Generation Fuels
Increasingly, biofuels are becoming big policy and big business as countries around the world look to decrease petroleum dependence, reduce GHG emissions in the transportation sector, and support agricultural interests. Among potential feedstocks, MSW is considered to be one of the ultimate feedstocks for advanced biofuels.
Biofuels demand is primarily driven by obligatory consumption and supply mandates, which form the backbone of biofuels policies worldwide. Voluntary consumption and supply targets further stimulate investment and signal a commitment to expanding biofuels use on all
continents. While consumption mandates target finished fuel products like ethanol or biodiesel, supply-oriented mandates are more fuel-agnostic and seek to carve out a market for advanced biofuels derived from non-food feedstocks like MSW. Supply-oriented targets currently call for 96 billion gallons of global biofuels production by 2023, representing a 61 billion gallon increase over project fiscal year 2014 production.
The United States’ Renewable Fuel Standard (RFS), which is administered by the
Environmental Protection Agency, is currently the most ambitious biofuels production mandate in the world. The RFS calls for 36 billion gallons of biofuels to be produced by 2022, up from 11.1 billion gallons in 2009. The rule offers four separate categories in which fuel pathways can qualify, caps ethanol production from corn starch at 15 billion gallons, and introduces the first ever GHG regulatory system in the U.S. transportation fuel industry.
The EU has taken a slightly different approach under its Renewable Energy Directive (RED), calling for 10% of transportation fuels to come from alternative sources. Biofuels are expected to account for the bulk of this quota, but member states are given the authority to enact rules for compliance. Many member states are phasing out blending mandates and associated incentives in favor of building advanced biofuels production to meet RED targets. The RED also contains an unparalleled and comprehensive list of requirements to guarantee that only biofuels produced in a sustainable manner are allowed in the EU energy mix. All told, the U.S. RFS and the EU’s RED call for 50 billion gallons of biofuels to be produced by 2023,
representing 52% of the volume from all supply mandates globally. The bulk of this production is expected to come from advanced biofuels.
©2014 Navigant Consulting, Inc. Notice: No material in this publication may be reproduced, stored in a retrieval system, or transmitted by any means, in whole or in part, without the express written permission of Navigant Consulting, Inc.
China and India are expected to introduce supply mandates by 2020. China is leaning toward a 10% supply mandate beginning in 2020. India is aiming to implement a 20% biofuels supply mandate starting in 2017. With Thailand’s existing 20% mandate, supply targets across the Asia Pacific region call for 46 billion gallons of biofuels production by 2023.
Chart 2.5 Volume of Biofuels Supply Targets by Key Markets, World Markets: 2014-2023
(Source: Navigant Research)
While generating power from MSW is well-established in the EU, in the United States and, increasingly, in emerging markets like China and Brazil, conversion to liquid fuels is currently at the cusp of early commercialization. As of 2Q 2014, 12 named projects are in the global pipeline that aim to produce the spectrum of alternative fuels from MSW feedstock. This pipeline of projects represents an estimated 200 MGY of new production capacity – or less than 1% of the theoretical potential for biofuels production from global waste (~35 BGY). The realization of this capacity would represent a doubling of current production of biofuels worldwide, with waste-to-fuels (W2F) contributing a growing percentage of the volume of advanced biofuels. 20,000 40,000 60,000 80,000 100,000 120,000 2014 2015 2016 2017 2018 2019 2020 2021 2022 2023 (M G Y) United States European Union China India Thailand Rest of World
©2014 Navigant Consulting, Inc. Notice: No material in this publication may be reproduced, stored in a retrieval system, or transmitted by any means, in whole or in part, without the express written permission of Navigant Consulting, Inc.
Section 3
T
ECHNOLOGY
I
SSUES
3.1 MSW Innovations
With tightening regulations targeting the generation and management of waste and competition for hauling contracts increasing, technological innovations are gaining more traction in the market. While the industry has historically been slow to adopt new technologies, with a sharper focus on reducing operational costs and utilizing waste as a strategic resource, waste
companies have increasingly gone on the offensive to maintain market share and grow revenue. In mature technology markets, waste haulers have sought to own solutions outright. In
emerging technology categories, waste haulers are investing directly in emerging early-stage companies with novel technologies and increasingly incorporating third-party solutions. Specifically, technological innovation in the waste industry is targeting improvements in efficiency through greater levels of automation, integration of IT, greater utilization of data analytics, and the recovery of valuable materials and energy. For waste haulers, efforts are focused on reducing costs. For new entrants, waste offers a valuable feedstock for a variety of high-value applications. As illustrated in Figure 3.1, smart MSW technologies touch on the four separate phases of the traditional MSW management value chain previously discussed
(including representative technologies). Figure 3.1 Smart MSW Technology Landscape
(Source: Navigant Research)
•Incineration WTE •Gasification WTE •Gasification W2F •LFGTE & AD •Sanitary landfilling •Bioreactors •Solar integration •Advanced MRFs •Advanced MBTs •RDF facilities •Pneumatic tubes •RFID tagging •GPS routing •Fuel switching Smart
Collection ProcessingSmart
Smart Energy Recovery Smart
Disposal
©2014 Navigant Consulting, Inc. Notice: No material in this publication may be reproduced, stored in a retrieval system, or transmitted by any means, in whole or in part, without the express written permission of Navigant Consulting, Inc.