Published by Canadian Center of Science and Education
Validity and Reliability of Mathematics Learning Strategy Instruments
among Middle School Students in Jordan
Belal Rabab’h1 & Arsaythamby Veloo11 School of Education and Modern Languages, University Utara Malaysia, Malaysia (UUM), Malaysia
Correspondence: Belal Rabab’h, School of Education and Modern Language, University Utara Malaysia, Sintok, Kedah, Malaysia. E-mail: [email protected]
Received: September 2, 2014 Accepted: September 23, 2014 Online Published: December 2, 2014 doi:10.5539/ass.v11n1p39 URL: http://dx.doi.org/10.5539/ass.v11n1p39
Abstract
This study aimed to determine the validity and reliability of Mathematics Learning Strategy (MLS) for Jordanian students, and to identify the relationship between factors of MLS instrument. The MLS was used to measure individual behavior based on five factors of mathematics (attitude, motivation, self-regulation, self-efficacy and anxiety). The previous study used 83 items to assess the MLS. Finding from Factor analysis indicated that all five factors items of MLS instrument ranged from 66.29% to 69.35% of the total variance indicating that all factors are related and thus represent a valid measure of MLS. The reliability of each factor was justified in terms of its internal consistency by means of Cronbach Alpha. Pearson correlation coefficient shows positive, strong correlation between five factors. Findings of this study confirmed the validity and reliability of the final MLS instrument with 65 items, and indicated that it is a useful instrument to evaluate the MLS among middle school students in Jordan. Thus, the instrument can be used by teachers, counselors and principals in understanding student MLS. With such understanding, teachers can easily engage in effective mathematics teaching.
Keywords: validity, reliability, mathematics learning strategy
1. Introduction
Jordanian middle school students are noted to perform poorly in mathematics. Based on large-scale comparative international surveys (TIMSS), 8th grade Jordanian students continue to display poor performance in mathematics (Mullis, Martin, Foy, & Arora, 2012). This issue calls for a thorough examination of the factors that affect math achievement among the middle schools of the country as this stage is characterized by the youth’s contemplation and negotiation of future trajectories (Hammouri, 2004). Mathematics achievement in this scholastic phase could be related to a complex and dynamic interaction between cognitive and affective factors (Volet, 1997). The former factors have been increasingly considered in the past few years as significant factors that impact mathematics success and persistence (Singh, Granville, & Dika, 2002). In addition, mathematics achievement refers to a function of interconnected factors including mathematics attitudes, mathematics motivation, mathematics self-regulation, mathematics self-efficacy, and mathematics anxiety that can in turn, impact the road towards post-secondary and occupational chances. The mentioned factors are also stated to impact long-term achievement and career aspirations in the field of mathematics (Reynolds & Walberg, 1992). Hence, it is important to understand these factors role in mathematic achievement as the researchers have been attempting to in the past few years.
In the context of Jordan, math educators have been concerned of these factors as notably, affective factors have been largely overlooked in the Jordanian research scene (Hammouri, 2004). Therefore, the present study examines the factors influence on mathematics achievement among Jordanian students.
The main reason behind the requirement of a valid and reliable measure of the sources of MLS is the fact that MLS helps students to learn more mathematics. MLS plays a critical role in the academic and career choices of students. As such, it is important for teachers and principals to be cognizant of the factors that help create and nurture the MLS of their students. This information is invaluable in helping teachers tailor their instructional strategies and counseling practices in ways most supportive both of their students’ MLS and, subsequently, of their achievement.
The previous research on MLS in school settings investigations of the sources have been conducted in the domain of mathematics. And most sources have been undertaken from high school and college students, and these factors were examined separately. For this reason, the researcher creates a measure of sources of MLS to be used in the domain of mathematics among middle school students in Jordan.
2. Literature Review
Bandura (1986) brought forward the Social-Cognitive Theory and introduced factors in the learning psychology field which explained various learning phenomena. Social cognitive theory is attributed to a model of emergent interactive agency. It postulates that individuals are neither autonomous agents nor mechanical conveyers of animating environmental influences but they create causal contribution to their own motivation and action encapsulated in a system of triadic reciprocal causation (p. 175). This is the basis of Bandura’s (1986) conception of reciprocal determinism which is the underlying notion behind his model of triadic reciprocal causation. According to his study in 1989, social cognitive theory postulates that individuals evaluate their own experiences and thought processes by self-reflecting and this form of self-reflection is used by individuals to evaluate and change their environments and social systems. This is the reason why social cognitive theory has been employed to various areas of psychosocial function including attitude, anxiety, self concept, self-regulation and motivation (Pajares & Graham, 1999; Landry, 2003). These evaluations encapsulate perceptions of self-efficacy.
2.1 Mathematics Attitude
In the early 1970s, Fennema and Sherman developed the Mathematics Attitude Scale to measure student’s attitude towards mathematics. The scale comprises of four subscales namely a confidence scale, a usefulness scale, a scale measuring mathematics as a male domain and a teacher perception scale. Each individual scale comprises 12 items, with six items catered to the measurement of a positive attitude while the remaining six measures adverse attitude.
Similarly, Tapia, Marsh and George (2004) created a new instrument in an attempt to gauge students’ attitudes toward mathematics and to identify the underlying dimensions of the instrument through the responses of 545 students. Data represented the entire grade levels and the secondary mathematics curriculum. The results showed a reliability coefficient alpha of 0.97. The analysis through the use of varimax rotation led to four factors namely self confidence, value of mathematics, enjoyment of mathematics and motivation. The ATMI initially had 49 items but nine items were deleted to maximize the alpha value. The remaining 40 items entailed the instrument completion time to range from 10-20 minutes.
Similarly, other studies (e.g. Aiken, 1974, 1979; Aiken & Dreger, 1961) estimated student’s attitude towards mathematics with the help of three developed surveys that were described as simple and invaluable for researchers as well as teachers (Adwerr-Bomah, Muller, & Kahn, 1986). The surveys were later validated among 287 first-year Australian university students in Watson’s (1983) study and also in Adwere-Boamah et al.’s (1986) study involving 2,538 high school students. In these studies, the factors including fear, enjoyment and mathematics attitude were examined. The pioneering study by Aiken (1979) was initially developed to study 11-15 year old Iranian high school students in an attempt to measure the four dimensions of attitude (motivation, enjoyment, importance and freedom from fear). It is however notable that the no study has validated the survey among adult students.
Later studies that made use of the Aiken Mathematics Attitude scale include Taylor (1997) who employed the survey among 430 adult students to determine whether or not it represents the four dimensions of attitude or the two dimensions as in the prior surveys. The outcome of factor analysis showed only two dimensions with high reliability namely enjoyment and value as opposed to four factors (i.e. enjoyment, motivation, importance and freedom from fear). In the present study, the researcher used Aiken’s (1974) instrument to measure mathematics attitudes in Jordanian middle school students.
2.2 Mathematics Motivation
Motivation has been extensively acknowledged as important in the field of learning. Nevertheless, because of its multidimensional and complex nature, it is challenging to conduct a synthesis of the research findings dedicated to motivation throughout studies. Increasing debates that revolve around the impact of intrinsic and extrinsic motivation in learning and their interaction have been conducted since the introduction of the terms.
In another related study, Zhu and Leung (2011) made use of an eighth grade questionnaire instrument developed by the Trends in International Mathematics and Science Studies (2003). Specifically, they looked into the relationship between intrinsic motivation and extrinsic motivation and their combined influence on the academic
performance of students enrolled in East Asian education systems in comparison to those enrolled in Australia, England, The Netherlands and the U.S. The questionnaire contained seven items that catered towards the intrinsic and extrinsic students’ motivation in learning the subject. The items were then analyzed through principal component factor analysis and the results revealed two dimensions (i.e. extrinsic and intrinsic) with significantly high reliability.
In a more recent study, Chen (2011) employed the same instrument, where the questionnaire contained 8 items, 4 of which were intrinsic and 4 extrinsic. He revealed that all items within each construct primarily measured the same thing and met the entire assumptions of the structural equation modeling indicating that intrinsic and extrinsic motivations were significantly correlated. The researcher in the present study used the measurement of motivation items adopted from Foy and Olson (2009) gauged through a five-point rating scale, ranging from “strongly disagree” to “strongly agree.”
2.3 Mathematics Self-regulation
The learning and study strategies inventory (LASSI) was first proposed by Weistein, Palmer and Schulte (1987). LASSI is a 10-scale and 80-item instrument that explores the awareness of high school students concerning the utilization of the strategies related with will, skill, and self-regulation during learning. The scales are categorized into four broad categories namely concentration, self-testing, study aids, and time management and they gauge the management, self-regulation and control of students of their learning process through time management, confirmation of learning demands from assignments and tests, and using review sessions, tutors and features in textbooks. More importantly, the related internal consistency of the scales in terms of Cronbach Alpha is quite impressive; concentration was found to be (α = 0.84), self-testing was (α = 0.75), study aids was (α = 0.68) and lastly time management was (α = 0.86).
In relation to the above study, Melancon (2002) ran the responses to the LASSI items under factor analysis and noted 18 factors possessing high Eigenvalues (>1.0), which he attributed to the fact that LASSI is not capable of measuring the 10 scales established in the manual. While this conclusion is reasonable, it has low probability of being real because according to Weinstein, Zimmerman and Palmer (1988), selection of items and subscale development may be conducted through the use of experts as opposed to factor analysis. This was supported by Entwistle, Meyer and Tait (1991, p. 257) who stated that factor analysis used for scale validation of this caliber is unjustified as it is important to retain the group of items clarity.
In the present study the researcher used a subscale of LASSI instrument by Weinstein, Palmer and Schulte (1987) to measure mathematics self-regulation for eighth grade students in Jordan with four dimensions namely, Concentration, Self Testing, Study Aids and Time Management.
2.4 Mathematics Self-efficacy
Several methods have been utilized for the assessment of the sources items construct validity. For instance, Matsui, Matsui and Ohnishi, (1990) made use of factor analysis to investigate 15 source items and imposed a three-factor solution that represented vicarious experience, social persuasions, and physiological arousal that had a relatively good model fit.
In this regard, confirmatory factor analysis was utilized to determine the latent constructs underlying the sources items by Lent, Lopez, Brown and Gore (1996) after which they brought forward four latent structure models. The two-factor model contained experience and vicarious experience, the three factor model contained experience and mastery, social persuasion with separate factors of personal experience, vicarious experience, and physiological arousal and four-factor model contained the sources structure as recommended by Bandura (1986). The five-factor model allowed vicarious experience items to load on two factors namely peers modeling and adults modeling and the result indicated that in the level of college students, the four-factor model had the appropriate data fit whereas in among high school students, the last model displayed the most suitable fit. Also, Mathematics self-efficacy instrument was developed by Morris and Lusby (2007) which comprised five items requesting students reply to questions such as – to what extent they are convinced of their own ability to handle learning situation in mathematics in an effective manner and in solving difficulties. The researcher in the present study used Morris and Lusby (2007) instrument with five items to measure mathematics self-efficacy among Jordanian middle school students.
2.5 Mathematics Anxiety
Richardson and Suinn (1972) developed the Mathematics anxiety rating scale, or MARS for short. MARS is a 98-item tool that diagnoses and recommends treatments for mathematics anxiety. The tool originally had a single general factor but factor analysis by Rounds and Hendel (1980) revealed that the tool actually comprised two
factors; the mathematic anxiety scale comprised of items concerning learning (e.g. studying, test taking, etc) and numerical anxiety scale comprised of items that pertain to the day-to-day utilization of mathematical components and calculations. The scale was shortened to 24 items by Plake and Parker (1982) for efficiency. They attempted to achieve a dependable and valid scale with only a fourth of the initial items. They were left with two factors with similar reliability and validity that they later labeled as Mathematics Learning Anxiety and Mathematical Evaluation Anxiety.
Betz (1978) top pioneering study considered mathematics anxiety measure from both impacts (positive and negative) and proposed Mathematics Anxiety Scale (MAS), which he created with the help of Mathematics Attitudes Scale brought forward by Fennema and Sherman (1976). The stability and internal consistency of MAS was later confirmed by Pajares and Urdan (1996) and Dew, Galassi and Galassi (1983), with the latter highlighting the Cronbach’s Alpha of MAS as 0.72, with test reliability of 0.87, when used on undergraduates. Pajares and Urdan (1996) noted that in MAS’s two factors structure, item 6 and 1 failed to load as expected among middle school, high school and college samples and therefore, they concluded that MAS possesses some construct validity issues.
Betz’s (1978) model was utilized as a basis for Bai et al.’s (2009) Mathematics Anxiety Scale-Revised model or MAS-R for short. MAS-R contained 14 items, (7 positively and 7 negatively worded). Later the psychometric properties of both worded items were identified in subscales by Bai (2011). Both the validation of MAS-R (Bai et al., 2009), and cross-validation (Bai et al., 2011) confirmed MAS-R’s validity in light of both construct validity and consistency. Accordingly, the present study employed revised MAS containing 14 items for the measurement of mathematics anxiety in the Jordanian students’ level.
2.6 Objective of the Study
1. To identify the validity and reliability of Mathematics Learning Strategy instrument on middle school students in Jordan.
2. To identify the relationship between factors of Mathematics Learning Strategy instrument, which are attitude, motivation, self-regulation, self-efficacy and anxiety.
3. Methodology
3.1 Sample
The present study is carried out in middle schools in Jordan, specifically in Al-koura District governorate, North of Jordan. The research population selected for the present study included 2257 8th grade students (1101 (49%) males and 1156 (51%) females) representing the whole schools in the region (37). The sample size of the present study comprised 360 schools students from 8th grade, 178 (49%) male students and 182 (51%) female students. This ensured that the number represents the whole population.
3.2 Translations
The MLS items were originally constructed in English, but because the language of the subject is Arabic, it was translated to Arabic to make it easier for the students to understand. The MLS items were translated into Arabic using a back translation technique in order to achieve the measurement equivalences in both languages (Brislin, 1970). The researcher gave the instrument to a native linguistic teacher to translate them from English to Arabic language after which the Arabic version was translated back into English by another bilingual expert in order to remove or solve any differences.
3.3 Instruments
Data for the study was collected by one instrument divided into five parts (1-5). Thirty-eight items were used to measure MLS factors. Students were asked to indicate the extent to which they agreed with statements on a 5-point Likert scale. Choice 1 (strongly disagree), 2 (disagree), 3 (moderately agree), 4 (agree) and 5 (strongly disagree). These items collected information on five parts: mathematics attitude, mathematics motivation, mathematics self-regulation, math’s self-efficacy and mathematics anxiety.
Part one of the instrument for the present study contained 24-item mathematics attitude scale (Aiken, 1976). This instrument comprises two subscales, which assess students’ enjoyment of mathematics and their perceptions of its value as a subject area. Value (V) are designed to measure students beliefs on the usefulness, relevance and worth of mathematics in their life now and in the future, while enjoyments (E) are designed to measure the degree to which students enjoy working mathematics and mathematics classes, and to ask students about their enjoyment in mathematics as a subject.
Part two contained the 8-item mathematics motivation. The mathematics motivation scale consists of two subscales namely intrinsic and extrinsic motivation (Foy & Olson, 2009). According to Chen (2011), Intrinsic Motivation (IM) relates to students’ interest concerning a topic or activity which is performed through the process of pursuit and has high impact upon student learning. On the other hand, Extrinsic Motivation (EM) is described as environmental factors.
Part three presented 32-item mathematics self-regulation scale (Weinsten, Palmer, & Schulte, 1987). The self-regulation of mathematics scale comprises four subscales (self-testing, concentration, study aids and time management) that gauge the way students regulate and control themselves and their learning process by concentration, time management, confirmation of learning demands and strategy supports.
Part four comprised of 5-item mathematics self-efficacy scale (Morris & Lusby, 2007). Mathematics self-efficacy items asked students to what extent they believe in their own ability to handle learning situation in mathematics effectively and overcoming difficulties.
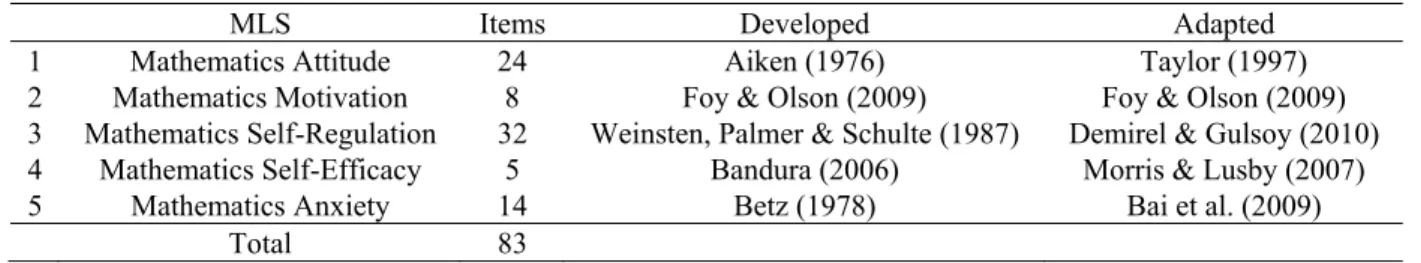
Part five was composed of 14-item Mathematics Anxiety Scale-Revised (Bai, Wang, Pan, & Frey, 2009). Mathematics Anxiety scale items asked students to what extent they feel helpless and under emotional stress when dealing with mathematics. Table1 shows the number of items for each factor used in this study.
Table 1. Mathematics Learning Strategy factors and related items
MLS Items Developed Adapted
1 Mathematics Attitude 24 Aiken (1976) Taylor (1997) 2 Mathematics Motivation 8 Foy & Olson (2009) Foy & Olson (2009) 3 Mathematics Self-Regulation 32 Weinsten, Palmer & Schulte (1987) Demirel & Gulsoy (2010) 4 Mathematics Self-Efficacy 5 Bandura (2006) Morris & Lusby (2007) 5 Mathematics Anxiety 14 Betz (1978) Bai et al. (2009)
Total 83
3.4 Data Analysis
Data on the research protocols were coded and scored according into instructions provided by the author. Negative items on MLS instrument were reverse-scored prior analyses. SPSS version 19 was used to analyze the construct validity. Specifically, Bartlett’s Test of Sphericity, Kaiser-Meyer-Olkin (KMO), Cronbach’s alpha and Pearson’s coefficient correlation were employed between factors.
4. Findings and Discussion
The findings of the study are presented below according to the objectives of the investigation outlined above and the type of data collected.
4.1 Factor Analysis
Factor analysis assisted was used to determine the questionnaire’s construct validity and to determine whether or not a multiple dimension or a single dimension underlies the items in the questionnaire. It also determined whether or not the items are associated with the identified factors, and which of them should be deleted from the measure on account of irrelevance as recommended by Green et al. (2000). Following factor analysis, the questionnaire’s scaled items were rearranged and regrouped based on the factor loadings as revealed by the factor extraction and rotation outcome.
4.1.1 Mathematics Attitude
Mathematics attitude instrument consisting of a total of 24 items were used to measure the Mathematics Attitude factor. Table 2 provides the results of the factor analysis on Attitude items.
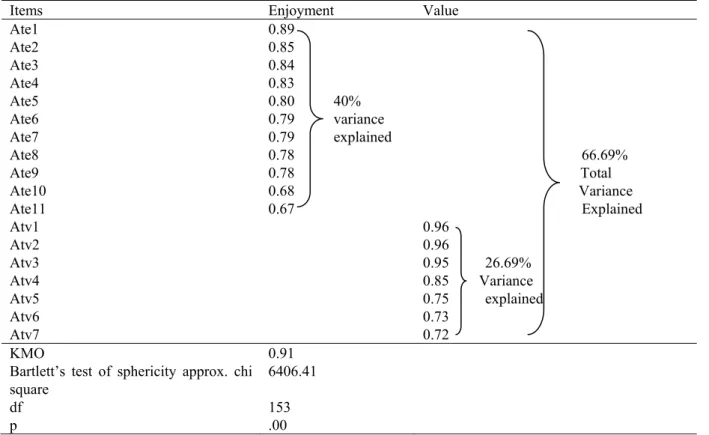
Table 2 presents that the KMO value for attitude towards management is 0.91 and a significant Bartlett’s sphericity of (p<.05) indicating that factor analysis is appropriate. The results showed that enjoyment explained 40.0% of total variance (7.20 Eigenvalue) with the items factor loadings ranging from 0.67-0.89, and value explained 26.69% of the total variance (4.80 Eigenvalue) with the items ranging from 0.72-0.96. The results indicated support in favor of using mathematics attitudes to measure mathematics achievement and factor analysis was deemed suitable to be employed on the items of mathematics attitude with eleven items focused on enjoyment, and seven on value.
Table 2. Factor loadings for the Mathematics Attitude factor
Items Enjoyment Value
Ate1 0.89 Ate2 0.85 Ate3 0.84 Ate4 0.83 Ate5 0.80 40% Ate6 0.79 variance Ate7 0.79 explained Ate8 0.78 66.69% Ate9 0.78 Total Ate10 0.68 Variance Ate11 0.67 Explained Atv1 0.96 Atv2 0.96 Atv3 0.95 26.69% Atv4 0.85 Variance Atv5 0.75 explained Atv6 0.73 Atv7 0.72 KMO 0.91 Bartlett’s test of sphericity approx. chi
square
6406.41
df 153
p .00
The factor analysis in the present study identified two dimensions underlying mathematics attitude. This result is consistent with Taylor’s (1998) study, which indicated that two dimensions underlying mathematics attitude instrument (i.e. enjoyment and value).
4.1.2 Mathematics Motivation
A total of eight items were used to measure mathematics motivation. Table 3 provides the results of the factor analysis on motivation items.
Table 3. Factor loadings for Mathematics Motivation
Items Intrinsic Extrinsic
Moti1 0.83 Moti2 0.82 39.1%
Moti3 0.82 Variance 69.35% Moti4 0.79 explained Total Mote1 0.90 30.25% variance Mote2 0.85 Variance explained
Mote3 0.81 explained
KMO 0.73 Bartlett’s test of sphericity approx. chi square 877.58
Df 21 P .00 Table 3 displays the overall KMO as 0.73, a value that exceeds 0.50 (minimum requirement) and the Bartlet’s sphericity is significant at (p<0.05). The results indicated that the Eigenvalues of Intrinsic and Extrinsic Motivation is higher one and explained 39.10% of the total variance; specifically, the former explained 39.10% of the total variance (Eigenvalue of 2.74) with items factor loadings ranging from 0.79-0.83, and the latter explained 30.25% of the total variance (Eigenvalue 2.12) with items factor loadings ranging from 0.81-0.90. The evaluated items were deemed capable to measure mathematics motivation.
The factor analysis results in the present study identified two dimensions underlying mathematics motivation. This result is consistent with Zhu and Leung (2011) and Chen (2011) studies, which indicated that there are two dimensions underlying mathematics motivation instrument (intrinsic and extrinsic).
4.1.3 Mathematics Self-regulation
Mathematics self-regulation was measured by thirty items as displayed in Table 4 along with the outcome of the principle component extraction method and Promax rotated analysis.
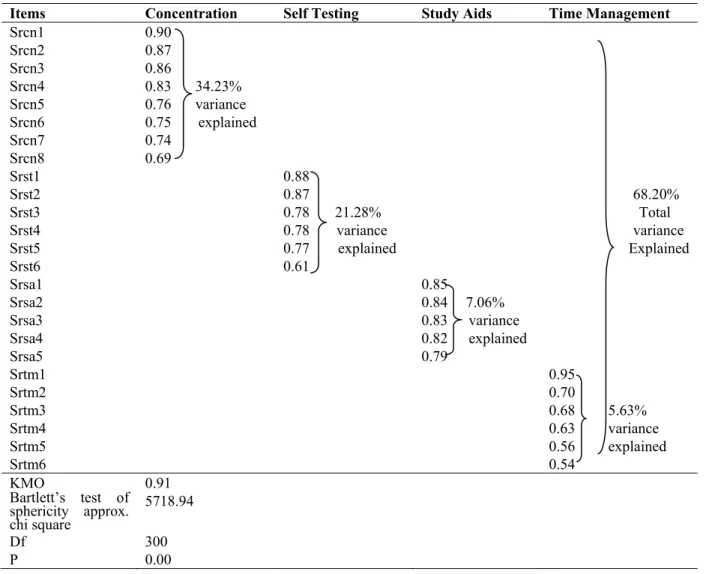
Table 4 presents that the overall KMO for Mathematics self-regulation is 0.91 with a significant Bartlett’s sphericity (p<.05). The Eigen values of concentration, self-testing, study aids and time management explained accounted for 68.20% of the total variance explained. Specifically, concentration accounting for 34.23% of total variance (Eigenvalue of 8.56) with items loadings that ranged from 0.69-0.90, self-testing accounted for 21.28% of the total variance (Eigenvalue of 5.32) and item loadings ranging from 0.61-0.88. As for study aids, it explained 7.06% of the total variance (Eigenvalue of 1.76) with items loadings ranging from 0.79-0.85. Finally, time management explained 5.63% of the total variance explained (Eigenvalue of 1.41) with items loadings Table 4. Factor loadings for the Mathematics Self-Regulation factor
Items Concentration Self Testing Study Aids Time Management
Srcn1 0.90 Srcn2 0.87 Srcn3 0.86 Srcn4 0.83 34.23% Srcn5 0.76 variance Srcn6 0.75 explained Srcn7 0.74 Srcn8 0.69 Srst1 0.88 Srst2 0.87 68.20% Srst3 0.78 21.28% Total Srst4 0.78 variance variance Srst5 0.77 explained Explained Srst6 0.61 Srsa1 0.85 Srsa2 0.84 7.06% Srsa3 0.83 variance Srsa4 0.82 explained Srsa5 0.79 Srtm1 0.95 Srtm2 0.70 Srtm3 0.68 5.63% Srtm4 0.63 variance Srtm5 0.56 explained Srtm6 0.54 KMO 0.91 Bartlett’s test of sphericity approx. chi square 5718.94 Df 300 P 0.00
The factor analysis result indicate that, there are four dimensions underlying mathematics self-regulation namely, Concentration, Self Testing, Study Aids and Time Management. The previous study conducted to measure LASSI instrument included ten scales, while the current study used four scales related to mathematics self-regulation. The result from Melancon (2002) indicated that there are 18 factors with Eigenvalues greater than 1.0.
4.1.4 Mathematics Self-efficacy
A total of five items were utilized to assess mathematics Self-Efficacy. Table 6 provides the results of the factor analyses of Self-Efficacy in math.
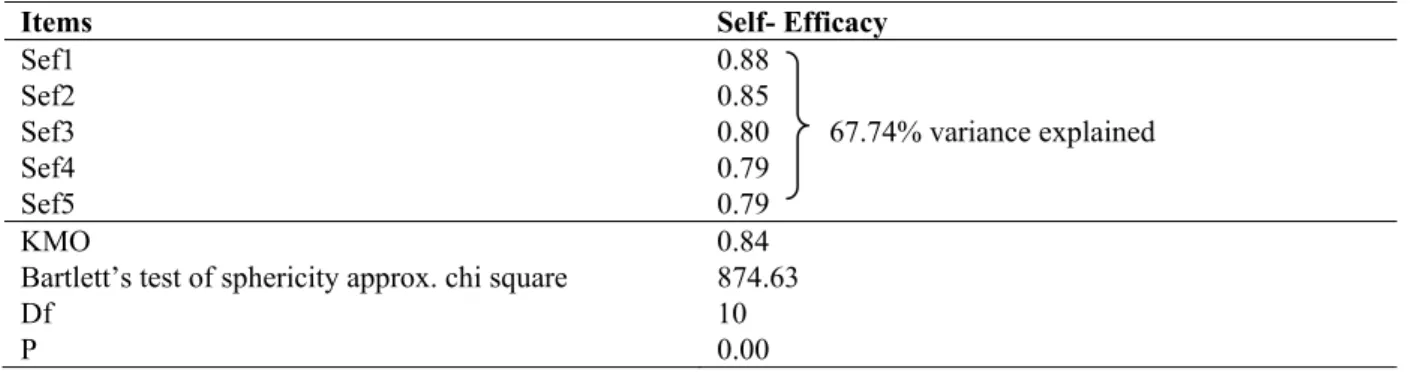
Table 5 shows the KMO of self-efficacy to be 0.84 with an acceptable Bartlett’s sphericity (p<.05). Promax rotated analysis reveals that self-efficacy explained 67.74% of the total variance (Eigenvalue of 3.39) with loadings ranging from 0.79-0.88.
The factor analysis result indicates that there is one dimension underlying mathematics self-efficacy with five items. In a related study, Morris and Lusby (2007) failed to establish construct validity for mathematics self-efficacy. On other hand, Matsui et al. (1990) in their study found three dimensions underlying mathematics self-efficacy representing vicarious experience, social persuasions, and physiological arousal.
Table 5. Factor loadings for Mathematics Self-Efficacy
Items Self- Efficacy
Sef1 0.88 Sef2 0.85 Sef3 0.80 67.74% variance explained
Sef4 0.79 Sef5 0.79 KMO 0.84 Bartlett’s test of sphericity approx. chi square 874.63
Df 10 P 0.00 4.1.5 Mathematics Anxiety
The Anxiety factor consists of fourteen items, which reflect the student’s anxiety towards mathematics. The results of Promax rotated analysis is given in table 6.
For mathematics anxiety, as evident from Table 6, the overall KMO is 0.95 (over 0.50) and a significant Bartlett’s sphericity. The construct explained 66.29% of the total variance (Eigenvalue of 6.63) and items loadings ranging from 0.73-0.88.
Table 6. Factor loadings for Mathematics anxiety
Items Anxiety
Anx1 0.89 Anx2 0.88 Anx3 0.88 Anx4 0.87 Anx5 0.83 66.29% variance explained
Anx6 0.78 Anx7 0.77 Anx8 0.75 Anx9 0.75 Anx10 0.73 KMO 0.95 Bartlett’s test of sphericity approx. chi square 2615.22
Df 45 P 0.00 The findings of the factor analyses in the present study indicated that there is one dimension underlying mathematics anxiety with 10-items. These findings contradict with the finding reported by Bai et al, (2009) study, which indicated that, there are two dimensions underlying mathematic anxiety.
Table 7. Factor analysis results
MLS factors No. Items KMO No. Items deleted Total variance explained Mathematics attitude 24 0.91 6 66.69% Mathematics motivation 8 0.73 1 69.35% Mathematics self-regulation 32 0.91 7 68.20% Mathematics self-efficacy 5 0.84 - 67.74% Mathematics anxiety 14 0.95 4 66.29% MLS 83 18 4.2 Reliability Analysis
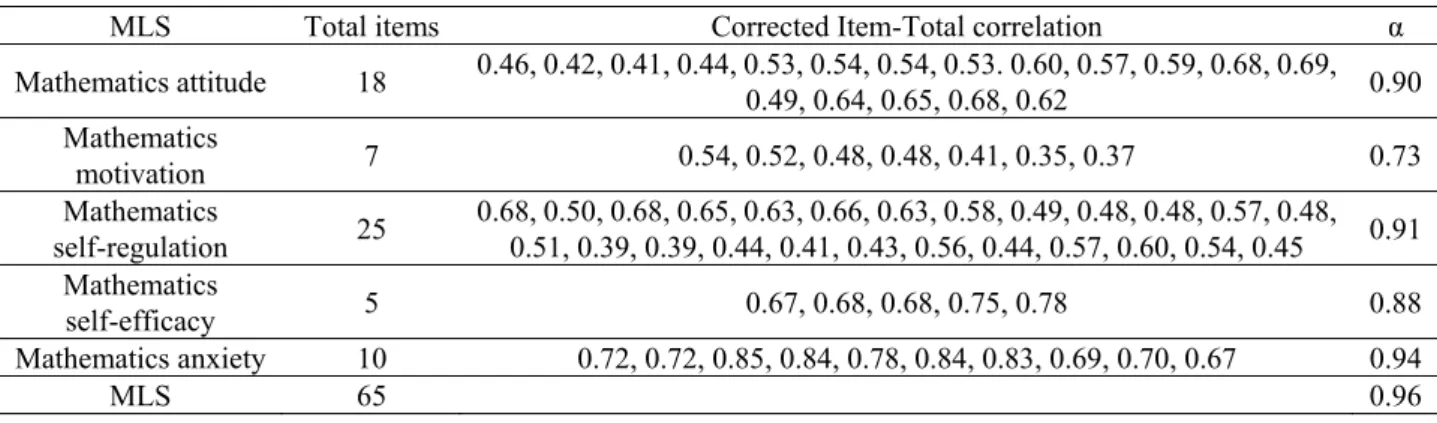
Reliability is defined as the stability and consistency of the instrument used and it is one of the indicators of goodness of measure (Sekaran, 2003). Cronbach Alpha coefficient is used to determine the internal consistency of scaled items via the investigation of the average inter-item correlation. The Cronbach’s alpha coefficients calculation reveals whether the items are correlated and which items should be deleted or modified. In this regard, Nunnally (1994) stated that all Cronbach Alpha coefficients over 0.60 deemed acceptable. In this study Cronbach’s Alpha was the approach used to assess reliability of MLS instrument factors.
The Mathematics Attitude scale consisted of 18 items and its Cronbach’s alpha value is 0.90 (see Table 8), which is deemed to be an acceptable reliability. In addition, the total correlation ranged from acceptable and highly correlated values of 0.41-0.69.
With regards to mathematics motivation it consisted of seven items and Cronbach’s alpha value is 0.73 as evident from the table, with the correlation of items ranging from acceptable values of 0.35-0.54. This finding is consistent with Taylor’s (1997) study, which indicated that the two dimensions of mathematics attitude were extracted with high reliability.
Mathematics motivation scale consisted of seven items. The findings indicated that the Cronbach's alpha value for mathematics motivation is 0.73, indicating an acceptable reliability level for this factor. The corrected item total correlation ranged from 0.35 to 0.54, which are considered as acceptable. This result is consistent with Zhu and Leung’s (2011) results, which indicated that the two dimensions (intrinsic motivation and extrinsic motivation) were extracted with high reliability.
Mathematics Self-regulation scale consisted of 25 items. Table 8 presents mathematics self-regulation Cronbach’s alpha value to be an acceptable value of 0.91, with the total correlation ranging from 0.39-0.68. These finding is consistent with those reported by Weinstein, Palmer and Schutle (1987), which showed that each dimensions of self-regulation has a high reliability.
Mathematics Self-efficacy factor has five items. Table 8 shows that the self-efficacy Cronbach’s alpha value is 0.88, which indicates its acceptable reliability. It also shows that the corrected item total correlation differed from highly correlated values of 0.67-0.78.
For mathematics anxiety, Cronbach’s alpha value is 0.94, which is an acceptable reliability and the corrected item total correlation differed from acceptable values of 0.67-0.85. This result is consistent with that of Pajares and Urdan’s (1996), which indicated that the mathematics anxiety has acceptable stability and internal consistency.
Table 8. Reliability analysis for Mathematics Learning Strategy instrument factor
MLS Total items Corrected Item-Total correlation α Mathematics attitude 18 0.46, 0.42, 0.41, 0.44, 0.53, 0.54, 0.54, 0.53. 0.60, 0.57, 0.59, 0.68, 0.69, 0.49, 0.64, 0.65, 0.68, 0.62 0.90 Mathematics motivation 7 0.54, 0.52, 0.48, 0.48, 0.41, 0.35, 0.37 0.73 Mathematics self-regulation 25 0.68, 0.50, 0.68, 0.65, 0.63, 0.66, 0.63, 0.58, 0.49, 0.48, 0.48, 0.57, 0.48, 0.51, 0.39, 0.39, 0.44, 0.41, 0.43, 0.56, 0.44, 0.57, 0.60, 0.54, 0.45 0.91 Mathematics self-efficacy 5 0.67, 0.68, 0.68, 0.75, 0.78 0.88 Mathematics anxiety 10 0.72, 0.72, 0.85, 0.84, 0.78, 0.84, 0.83, 0.69, 0.70, 0.67 0.94 MLS 65 0.96
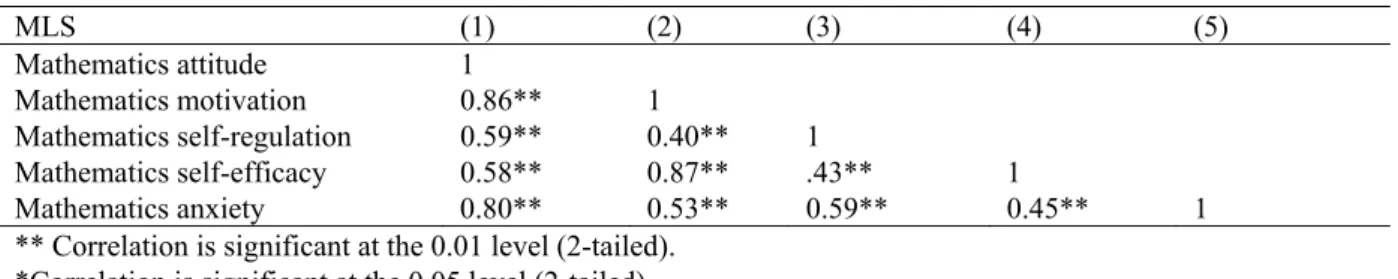
4.3 Correlation Analysis
Correlation analysis is a statistical method used to describe the strength and direction of the linear relationship between two factors (Pallant, 2001). The relationship between MLS factors was investigated using Pearson correlation coefficient. According to Table 9, there is a positive, strong correlation between MLS factors. The strongest correlation is between mathematics motivation and mathematics self-efficacy (r = 0.87, p < 0.01), and correlation between mathematics attitude and mathematics motivation (r = 0.86, p < 0.01). On the other hand, the lowest correlation is between mathematics motivation and mathematic self-regulation (r = 0.40, p < 0.01) and correlation between mathematics self-regulation and mathematics self-efficacy (r = 0.43, p < 0.01). Overall, MLS factors have a positive, strong correlation between each other. Table 9 summarizes the relationship between MLS factors.
Table 9. Correlation Matrix Result for the MLS factors.
MLS (1) (2) (3) (4) (5) Mathematics attitude 1 Mathematics motivation 0.86** 1 Mathematics self-regulation 0.59** 0.40** 1 Mathematics self-efficacy 0.58** 0.87** .43** 1 Mathematics anxiety 0.80** 0.53** 0.59** 0.45** 1 ** Correlation is significant at the 0.01 level (2-tailed).
*Correlation is significant at the 0.05 level (2-tailed).
5. Conclusion
This instrument validated by items and factors, where 65 items remained from the initial 83 items. It takes 20 to 25 minutes to respond to it according to researcher’s observation. The findings provided evidence of good psychometric properties for the Arabic version of the MLS instrument. The reliability for all factors scales were sufficient and exploratory factor analysis indicated that the five factors were sufficiently reliable and valid, which provided additional support to the factorial validity of the scales found in the earlier studies. The findings regarding the relationship between MLS factors showed a strong relationship between these factors. This character is in line with the social cognitive theory, which stated that there’s a reciprocal relationship between MLS factors. MLS factor plays an important role in evaluating and maximizing MLS. This finding concerning the MLS provides information on how to improve and develop student’s ability to understand mathematical concepts.
References
Adwere-Boamah, J., Muller, D., & Kahn, H. (1986). Factorial validity of the Aiken-Dreger mathematics attitude scale for urban school students. Educational and psychological measurement, 46(1), 233-236. http://dx.doi.org/10.1177/0013164486461027
Aiken, L. (1974). Two scales of attitude toward mathematics. Journal for Research in Mathematics Education, 5(2), 67-71. http://dx.doi.org/10.2307/748616
Aiken, L. R. (1979). Attitudes toward mathematics and science in Iranian middle schools. School Science and Mathematics, 79(3), 229-234. http://dx.doi.org/10.1111/j.1949-8594.1979.tb09490.x
Aiken Jr, L. R., & Dreger, R. M. (1961). The effect of attitudes on performance in mathematics. Journal of Educational Psychology, 52(1), 19. http://dx.doi.org/10.1037/h0041309
Bai, H. (2011). Cross-validating a bi-dimensional mathematics anxiety scale. Assessment, 18(1), 115-122. http://dx.doi.org/10.1177/1073191110364312
Bai, H., Wang, L., Pan, W., & Frey, M. (2009). Measuring mathematics anxiety: Psychometric analysis of a bi-dimensional affective scale. Journal of Instructional Psychology, 36(3), 185-193.
Bandura, A. (1986). Social Foundations of Thought and Action: A Social Cognitive Theory. Englewood Cliffs, NJ: Prentice-Hall.
Betz, N. E. (1978). Prevalence, distribution, and correlates of math anxiety in college students. Journal of Counseling Psychology, 25(5), 441-448. http://dx.doi.org/10.1037/0022-0167.25.5.441
185-216. http://dx.doi.org/10.1177/135910457000100301
Chen, J. (2011). An Evaluation of the Relationship between Classroom Practices and Mathematics Motivation from Student and Teacher Perspectives. ProQuest LLC. 789 East Eisenhower Parkway, PO Box 1346, Ann Arbor, MI 48106.
Demirel, M., & Gulsoy, D. (2010). Opinions of English language prospective teachers on the use of learning and study strategies. InternationalJournal on New Trends in Education and Their Implications, 1(4), Article 8 Entwistle, N., Meyer, J., & Tait, H. (1991). Student failure: Disintegrated patterns of study strategies and
perceptions of learning environment. Higher Education, 21(2), 249-261. http://dx.doi.org/10.1007/BF00 137077
Fennema, E., & Sherman, J. A. (1976). Fennema-Sherman mathematics attitudes scales: Instruments designed to measure attitudes toward the learning of mathematics by females and males. Journal for Research in Mathematics Education, 7(5), 324-326. http://dx.doi.org/10.2307/748467
Foy, P., & Olson, J. F. (Eds). (2009). TIMSS 2007 International Database and User Guide. Chestnut Hill, MA: Retrieved from http://timss.bc.edu/timss2007/idb_ug.html
Green, S. B., Salkind, N. J., & Akey, T. M. (2000). Using SPSS for windows: Analysing and Understanding data
(2nd ed.). Upper Saddle River, New Jersey: Prentice Hall.
Hammouri, H. (2004). Attitudinal and motivational variables related to mathematics achievement in Jordan: Findings from the Third International Mathematics and Science Study (TIMSS). Educational Research,
46(3), 241-257. http://dx.doi.org/10.1080/0013188042000277313
Landry, C. C. (2003). Self-efficacy, motivation, and outcome expectation correlates of college students' intention certainty.(Order No. 3085684, Louisiana State University and Agricultural & Mechanical College).
ProQuest Dissertations and Theses (p. 206). Retrieved from http://eserv.uum.edu.my/docview/
305322223?accountid=42599. (305322223).
Lent, R. W., Lopez, F. G., Brown, S. D., & Gore, P. A. (1996). Latent structure of the sources of mathematics self-efficacy. Journal of Vocational Behavior, 49(3), 292-308. http://dx.doi.org/10.1006/jvbe.1996.0045 Lusby, B. (2007). Increasing Student’s Self-efficacy in Mathematics. Rising Tide, 5, 1-13. Retrieved from
http://www.smcm.edu/educationstudies/pdf/rising-tide/volume-5/lusby.pdf
Matsui, T., Matsui, K., & Ohnishi, R. (1990). Mechanisms underlying math selfefficacy learning of college students. Journal of Vocational Behavior, 37(2), 223-238. http://dx.doi.org/10.1016/0001-8791(90)90042-Z Melancon, J. G. (2002). Reliability, structure, and correlates of learning and study strategies inventory scores.
Educational and Psychological Measurement, 62(6), 1020-1027. http://dx.doi.org/10.1177/001316440 2238088
Mullis, I. V., Martin, M. O., Foy, P., & Arora, A. (2012). TIMSS 2011 International Results in Mathematics. International Association for the Evaluation of Educational Achievement. Herengracht 487, Amsterdam, 1017 BT, The Netherlands.
Nunnaly, J. C., & Bernstein, I. H. (1994). Psychometric theory (3rd ed.). New York: McGraw-Hill.
Pajares, F., & Graham, L. (1999). Self-efficacy, motivation constructs, and mathematics performance of entering middle school students. Contemporary Educational Psychology, 24(2), 124-139. http://dx.doi.org/10.1006/ ceps.1998.0991
Pajares, F., & Urdan, T. (1996). Exploratory factor analysis of the Mathematics Anxiety Scale. Measurement and Evaluation in Counseling and Development, 29(1), 35-47.
Pallant, J. (2001). SPSS survival manual: A step by step guide to data analysis using SPSS for windows (version 10). Buckingham: Open University Press.
Plake, B. S., & Parker, C. S. (1982). The development and validation of a revised version of the mathematics anxiety rating scale. Educational and Psychological Measurement, 42(2), 551-557. http://dx.doi.org/10.1177/001316448204200218
Reynolds, A. J., & Walberg, H. J. (1992). A structural model of science achievement and attitude: An extension to high school. Journal of Educational Psychology, 84(3), 371-382. http://dx.doi.org/10.1037/0022-0663. 84.3.371
of Counseling Psychology, 19(6), 551-554. http://dx.doi.org/10.1037/h0033456
Rounds, J. B., & Hendel, D. D. (1980). Measurement and dimensionality of mathematics anxiety. Journal of Counseling Psychology, 27(2), 138-149. http://dx.doi.org/10.1037/0022-0167.27.2.138
Sekaran, U. (2003). Research methods for business: A skill building approach. New York: John Wiley & Sons. Singh, K., Granville, M., & Dika, S. (2002). Mathematics and science achievement: Effects of motivation,
interest, and academic engagement. Journal of Educational Research, 95(6), 323-332. http://dx.doi.org/10.1080/00220670209596607
Tapia, M., Marsh, I. I., & George, E. (2004). An instrument to measure mathematics attitudes. Academic Exchange Quarterly, 8(2), 16-21.
Taylor, J. A. (1997). Factorial validity of scores on the Aiken Attitude to Mathematics Scales for adult pretertiary students. Educational and psychological measurement, 57(1), 125-130. http://dx.doi.org/10.1177/ 0013164497057001009
Volet, S. E. (1997). Cognitive and affective variables in academic learning: The significance of direction and effort in students’ goals. Learning and Instruction, 7(3), 235-254. http://dx.doi.org/10.1016/S0959- 4752(96)00027-8
Weinstein, C. E., Schulte, C., & Palmer, D. H. (1987). LASSI user's manual. Clearwater, FL: Hemisphere. Weinstein, C. E., Zimmerman, S. A., & Palmer, D. R. (1988). Assessing learning strategies: The design and
development of the LASSI. In C. E. Weinstein, E. T. Goetz, & P. A. Alexander (Eds.), Learning and study strategies (pp. 25-40). New York: Academic Press. http://dx.doi.org/10.1016/B978-0-12-742460-6.50009-8 Zhu, Y., & Leung, F. K. (2011). Motivation and achievement: Is there an East Asian model?. International
Journal of Science and Mathematics Education, 9(5), 1189-1212. http://dx.doi.org/10.1007/s10763- 010-9255-y
Copyrights
Copyright for this article is retained by the author(s), with first publication rights granted to the journal.
This is an open-access article distributed under the terms and conditions of the Creative Commons Attribution license (http://creativecommons.org/licenses/by/3.0/).