Performance and Security
Carrie Gates, Michael Collins, Michael Duggan, Andrew Kompanek and Mark Thomas
–
Carnegie Mellon University
ABSTRACT
Analysis of network traffic is becoming increasingly important, not just for determining network characteristics and anticipating requirements, but also for security analysis. Several tool sets have been developed to perform analysis of flow-level network traffic, however none have had security as the primary goal of the analysis, nor has performance been a key consideration.
In this paper we present a suite of tools for network traffic collection and analysis based on Cisco NetFlow. The two primary design considerations were performance and the ability to build richer models of traffic for security analysis. Thus the data structures and code have been optimized for use on very large networks with a large number of flows. Data filter rates are approximately 80 million records in less than 1.5 minutes on a Sun 4800.
Introduction
Cisco NetFlow [11] is becoming an increasingly popular method for analyzing network traffic, and sev-eral tools (e.g., [3, 8, 1]) have been developed to take advantage of this flow information. However, most of these tools have been developed within the context of academic settings, where performance was not critical. The SiLK Suite1 was developed to provide analysis
tools for very large installations, such as large corpo-rations, government organizations, and backbone ser-vice providers. These sites often transfer large vol-umes of data, much of it extraneous (e.g., worm traf-fic, scanning activity).
In addition to having performance as a key ele-ment of the SiLK Suite, the tool set was developed with security analysis as a primary goal. This has facilitated the development of a new suite of tools that allow information filtering in a manner unavailable in other tool sets. This suite of tools has been field tested at a large ISP, and is now in operational use at this site. For example, the tool set is able to process approxi-mately 80 million records in less than a minute and a half on a Sun 4800.
This paper provides an introduction to the SiLK Suite tool set, describing both the collection system and the analysis tools. It provides examples of how to use the analysis tools and the types of analyses that can be performed. SiLK is then compared to related tools.
The SiLK Suite can be down-loaded from http:// silktools.sourceforge.net/ [5].
Overview of the SiLK Suite
The SiLK Suite consists of two primary compo-nents: the collection system and the analysis tool set.
1SiLK stands for System for Internet Level Knowledge,
with the SLK capitalized in memory of Suresh L. Konda, who was the founder of the project.
The collection system converts Cisco NetFlow Ver-sion 5 PDUs into a compressed binary format. The tools work on these compressed records, allowing a user to filter data in a variety of ways and to use a series of command line tools for data summarization.
SiLK was originally designed to address a prob-lem inherent in traffic analysis: traditional payload-based analysis can make accurate judgments with a relatively small amount of data, but traffic analysis requires larger volumes of data to assess trends and large scale behaviors. Coupled with the volume of data seen on our client network, the amount of traffic summaries received was on the order of tens of Giga-bytes a day.
In order to manage this volume of traffic, SiLK adopted three strategies: the footprint of individual records was reduced to the minimum necessary to store security-relevant information and nothing more, files were split into several common pre-defined cate-gories to reduce the amount of time to look for spe-cific traffic, and the SiLK Suite was made gzip-trans-parent. SiLK reads gzipped or unzipped files transpar-ently, which yields a substantial performance bonus (in our experience, gunzipping a file in memory is cheaper than loading the unzipped file).
Collection System
The collection system has been designed to mini-mize the amount of disk space required to store data, while still supplying the data required for security analysis of network traffic. The collection system takes Cisco NetFlow Version 5 PDUs and converts them to a ‘‘packed’’ format. The packed records are stored in a hierarchy based on the router class (e.g., ingoing, outgoing) where this information is specified by the type of record (e.g., in, inweb, out and outweb), and date and time, with hourly files available at the leaves. A separate file is maintained for the flow
records from each router. Only flows that have been routed are recorded – flows representing traffic that was dropped by the router due to an access control list (ACL) violation are not saved.2 A NetFlow record
consists of 48 bytes. We reduce this record size to achieve disk storage savings via three approaches:
•
do not store the fields that are not required•
reduce the number of bits used to store someinformation
•
remove the storage of fields where the file hier-archy can indicate the same informationThe first approach results in the removal of eight fields from the NetFlow record. In particular, informa-tion about the network path is not maintained. This results in the removal of the following fields: input interface number, output interface number, the source AS number, the destination AS number, the source mask, the destination mask, and the next hop IP num-ber. In addition, the type of service information is not kept. This results in a savings of 19 bytes per record.3
Additional space savings comes from a reduction in the number of bits used to store various information.
For example, time information is only stored with accuracy to within one second, rather than the millisecond precision provided by NetFlow. In addi-tion, the packed record only uses 12 bits to store the start time of the flow, and 11 bits to store the elapsed time of the flow. The header for the packed data file contains the start time for all of the records in the file. As each file contains only one hour of flow data, the start time only needs to be the number of seconds since the start of the file. The end time is actually the number of seconds elapsed since the start of the flow. By default, NetFlow flushes a continuous flow after 30 minutes, and so the elapsed time requires one fewer bit than the start time (based on this default). If a site is using a different configuration (in particular, flush-ing less frequently than 30 minutes), then the code will need to be modified to accommodate this difference.
Other bit savings come from storing the average bytes per packet, rather than the absolute number of bytes. There are 14 bits dedicated to the number of bytes per packet, and an additional six bits to represent the fractional portion of the value. Additionally, only 20 bits are used to represent the number of packets in a flow. If this value overflows, then an overflow bit is set. Therefore we only have accuracy in this field up to approximately one million packets. After this, we use a multiplier to achieve greater values, but at the cost of accuracy. It is important to note that implicit in this design is the concept that flows with small pay-loads are more important or interesting than larger
2We currently do process flows that encounter ACL
viola-tions on one of our client sites, where these records are saved in a different directory in the file hierarchy, however this code is not yet available in the open source release.
3Future versions might incorporate some of these values,
however the open source version currently does not save this information.
ones, and hence we are not concerned with the exact values for larger flows. However, the overflow bit has been designed to still provide information (by acting as a multiplier), rather than being used as an error flag. As noted above, some information has been removed from the data record and is maintained by the structure of the underlying file system. For example, the directory hierarchy specifies the type of record as the second level in the hierarchy, where the type of record can be either web or non-web. For many large networks, the majority of traffic consists of web-based traffic. By splitting out web traffic into a separate loca-tion, the number of bits required to store port informa-tion for web records can be reduced. That is, the ephemeral port information is maintained (16 bits), while only two bits are used to represent the web port in use (where the web port can only be one of 80, 443 or 8080). A third bit is used to indicate if the web port is the source port or destination port. In addition, since all web traffic uses the TCP protocol, there is no need to store the protocol information. In total, these changes result in a savings of 21 bits, which is a sav-ings of 2-bytes per record in disk storage. For a site that sees ten million web flows per hour (incoming or outgoing), there is a savings of nearly 500 MB per day. Using all these techniques results in a flow stored as source IP address, destination IP address, source port, destination port, protocol, flag combina-tion, start time, elapsed time, number of packets, and the bytes per flow (which is converted to number of bytes by the analysis tools). The packed record only requires 22 bytes of on-disk storage, while the original NetFlow PDU requires 48 bytes. For the web data, this is reduced even further to 20 bytes per record. For sites that experience large volumes of traffic, this can result in significant savings in disk space.
Analysis Tools
Data Manipulation
The SiLK Suite currently provides 13 tools and seven associated utilities. Libraries are provided for reading the packed records, which performs file bing (using fglob library calls, which is how file glob-bing will be referred to for short) based on information provided through a standard set of arguments. These arguments specify the start and end date/time, the type of data (e.g., incoming or outgoing, web or non-web), and the sensor (router). These flags can be provided to the tools that read the packed records, and are used to specify exactly what files are read. This allows for enhanced performance by reducing the amount of traf-fic that needs to be searched, as only the relevant por-tions of data are examined. (In other tools, all traffic is maintained as flat files, where the analytical tools require the user to specify the input data file. The directory hierarchy employed by SiLK, however, is incorporated into the analysis tools, allowing the ana-lyst to focus on the behaviour of interest, rather than
needing to find the appropriate file. Additionally, the hierarchy allows the tools to more quickly locate small files containing the information for the time and sen-sor of interest.) The tools default to using incoming traffic, both non-web and web, for all sensors. Addi-tionally, if only a day is provided for the start date, then the default is to process the entire day. If an hour is provided, then the default is to process only that hour. To process some other amount of time (e.g., two hours), the end date flag is required. If no start date is provided, the tools default to using the data available so far for the current day.
The primary tool is rwfilter.4This tool reads the
packed data and can filter based on various options. These options include filtering based on the start or end time of the flow, the duration of the flow, the source or destination ports, the protocol, the number of bytes or packets, or the flag combination (for TCP). Perhaps one of the most useful options that can be provided for filtering is the source and destination addresses, which can be provided as single addresses, ranges of addresses, or as a set of unrelated IPs (called an ipset and described more fully below). Alterna-tively, all IPs that are NOT in the set provided can also be used. In addition to the base command line func-tionality, rwfilter has the ability to incorporate a user-compiled dynamic library. This library can be used to filter records based upon criteria that are too compli-cated to express on the command line, to perform ‘‘canned’’ queries more quickly than the command line would allow, and to perform stateful operations on large sets of flow records. For example, a user can define their own set of important services (e.g., dns/tcp, dns/udp, web, other tcp, etc.), using the dynamic library to count the number of flows for each of these services, and printing the results at the end of therwfiltercommand.
The rwfilter tool provides two output options:
--passand--fail. The--passoption allows all data meet-ing the specified filtermeet-ing options to be saved to a file (or, alternatively, stdout can be specified here, if the results are to be piped through another command), while the --failoption saves all those records that did NOT meet the filtering criteria. Both options can be used at the same time, allowing a user to chainrwfilter
commands, where data that meets a condition can be saved in a file via--pass, while those records that fail the condition can be piped into another rwfilter com-mand via--fail=stdout. The data files that are generated byrwfilterare in a binary format similar to that gener-ated by the packing system, and which can also be read by the rw commands, which allows commands to easily be chained together. (Records output from rwfil-terno longer have the contextual information provided by the file hierarchy and therefore fully expand fields
4We use rw as a short-hand for raw. This is a historical
con-vention, and refers to the type of packed files we are using and the type of data we are receiving.
such as start time. The result is a homogeneous stream of 32-byte records.)
A major functionality provided by this tool set is a binary representation of IP addresses, called an ipset. The ipset data structure is effectively a dynamically expanding checklist: the core of the structure is a list pointing to 65,536 8 KB bitmaps, where each bit indi-cates the presence of an IP address. Under normal cir-cumstances, only a small number of the bitmaps are allocated, and most ipsets end up being less than a megabyte in size. However, the structure is very fast (any address is looked up in two memory loads) and consequently allows a user to query arbitrary sets of IP addresses as fast as any other query in SiLK.
An ipset can be built from an ASCII list of dot-ted-quad IP addresses using thebuildsetcommand. It is also possible to use the results from an rwfilter com-mand to generate an ipset by piping the output from
rwfiltertorwset. Therwsetcommand reads in data in the packed format and generates an ipset of either the source IP addresses or destination IP addresses, as specified by a command line option.
The ipset files that result from buildset or rwset
can be read using the readset command, which can print the IP addresses in the set, a count of the IP addresses, or various statistical information. Ipsets can also be combined using standard set functions such as intersect (setintersect) or union (rwset-union).
Ipsets allow a user to filter data on IP addresses that need not have anything in common (e.g., does not need to be in a range). For example, a site can main-tain a ‘‘bad list’’ of IP addresses (addresses that are known to be malicious) as an ipset. This set can then be used to filter incoming traffic for any activity from these IPs, or to filter outgoing traffic to see if there is any communication to these IPs. If a second bad list needed to be added to the first, then the two could be merged using rwset-union. Similarly, to see what addresses the two lists had in common, setintersect
could be used.
In order to view the records returned byrwfilteror similar utilities (e.g., rwsort, which is described below), the commandrwcut must be used. This com-mand reads in any packed data file, and prints the fields in the packed record, along with the sensor ID and the end time of the flow. The fields to be printed can be specified with the--fieldoption, where the fields are numbered from one to 12. (Numbers were used to save the user from needing to type each required field in full, e.g.,--field=sip,dip,sport,dport,stime. Additionally, once the user has memorized which numbers map to which fields, it allows them to easily specify ranges, e.g.,--field=1-4,9.) The number of records to print can also be specified with the--num-recsoption.
All of the tools work on packed data, as this is the most efficient. Given the large number of records that need to be handled quickly, Unix-like utilities,
such as rwuniq and rwsort were developed that use packed data. The rwuniq tool will return the unique entries for the specified field, along with a count, and so is equivalent to the Unix commanduniq -c. In addi-tion,rwuniq allows the user to set a threshold, so that only those entries that occur more often than the threshold are returned. The rwsort tool sorts packed data on the specified fields (allowing the user to spec-ify a primary key and secondary key), outputting the results in a packed data format. Operations using these tools on packed data perform more than twice as fast as the same operations on plain text using traditional UNIX tools.
Currently,rwsort is limited to 50 million records. If the input contains more than 50 million records, sort proceeds based on just the first 50 million records. This limit was provided based on memory restrictions, and can be changed easily by modifying the source code. This design decision was made based on the assumption of 2 GB of RAM being available, and with the desire to provide the user with a consistent mem-ory limit, rather than one that might change based on machine or machine usage.
Data Summarization
Other tools are intended to assist in traffic analy-sis by providing summarizations appropriate for graphing, and various statistical reports. For example,
rwcount provides the number of bytes, packets and flows seen in the packed data provided, broken into user-specified time intervals (e.g., five minutes, one hour). This allows a user to glance at a report and determine if there was any sudden spike in activity. The toolrwtotalallows even finer granularity based on user-specified criteria. For example, a user can per-form anrwfilterto extract all traffic going to a particu-lar /24 address space, then pipe this to rwtotal and group the results (number of bytes, packets and flows) by the last octet of the destination address. This pro-vides a count of all the traffic going to each IP address in a /24 network. Other than specifying various parts of the source or destination address (e.g., last 8 bits, last 16 bits), the user can also print results based on protocol, source port, destination port, number of packets or number of bytes.
The toolrwaddrcountis similar torwtotal, however it is based on IP addresses instead of time intervals. It can take as input the results from anrwfilterquery, and will return the total number of bytes, packets and flows for each source IP address, along with the time stamps for the first and last flows observed. The infor-mation provided can be further refined through com-mand line options specifying the minimum and maxi-mum flows, packets or bytes observed.
The tool rwstatscomputes a variety of statistics, based on the traffic flows provided to it. The number of flows, and the percent of the input that these flows represent, are provided for the groups specified by the
user. TopNlists (e.g., sort the results by the number of flow records, and then only return the firstN, such as 10, from the list – thereby presenting the results with the most traffic) can be provided by either source or destination IP address, where the user specifies the value forN. In this manner, the user can view the top 10 (for example) sources that generated the most num-ber of flows to the monitored network, or the top 20 destinations that generated the most flows to outside addresses. This feature can also be used based on ports, rather than IP addresses. Additionally, the bot-tomN (those groups with the least number of flows) can also be specified. If preferred, the user can look at combinations of items, such as the top source-destina-tion IP address combinasource-destina-tions or source-destinasource-destina-tion port pairs. Additional statistics, such as the minimum, maximum, quartile, and interval statistics for bytes, packets and bytes/packet can be determined based on protocol (e.g., TCP, UDP).
In addition to the 13 tools provided by the SiLK Suite, there are also seven utilities. The utilities differ from the tools as they were provided to assist in some analysis tasks, based on user feedback. In contrast, the tools were designed to perform the actual analysis. The utilities are:
1. num2dot: This utility converts IP addresses from a 32-bit integer to dotted quad notation. It expects output from rwcut (where the rwcut IP format had been specified to be 32-bit integers, rather than the default of dotted-quad), with the fields to be converted specified on the com-mand line. This tool is useful if output that con-tains IP information in both 32-bit integer and dotted-quad notation is desired. One example of where this would be useful is if the resulting flows needed to be imported into a spreadsheet. Usingrwcut with --field=1,9,1-8 --integer-ips gen-erates rwcut output with IP numbers as 32-bit values. num2dot can then convert fields three and four to dotted-quad notation, leaving the first field (source IP address) as a 32-bit inte-ger, allowing easy sorting in the spreadsheet, yet still providing the dotted-quad value for the user (the third field would now contain the dot-ted-quad version of the source IP, while the fourth field contained the destination IP in dot-ted-quad).
2. rwappend: This utility appends new flow records to an existing packed file.
3. rwcat: This utility will concatenate packed files into a single stream.
4. rwfileinfo: This utility reads the header informa-tion of a packed file and prints it to the screen. This information includes items such as the number of records in the file and the command line that generated the file.
5. rwfglob: This utility can be used to determine what files will be processed given a set of fglob
options (e.g., start date, incoming or outgoing, etc.).
6. mapsid: This utility determines the sensor name or number, and can convert between the two representations.
7. rwswapbytes: This utility can be used to change the endianness of a packed file.
IP Address| Bytes|Packets|Records| Start Time| End Time
241.21.21.24| 3855940| 87635| 65732|06/29/2004 17:00:00|06/29/2004 17:48:13 241.27.240.226| 5267496| 109792| 74773|06/29/2004 17:00:02|06/29/2004 17:49:40
Figure 1: The results from rwaddrcount. Security Analysis
These tools can easily be scripted to deliver regu-lar reports. For example, one of the client sites using these tools produces top 10 lists on a nightly bases. The top 10 IP addresses that have seen the most flows, or bytes, or packets can easily be determined through a combination ofrwfilter andrwaddrcount. Similar statis-tics can easily be generated for ports based onrwtotal.
The following sections demonstrate some of the capabilities of the tool set to detect various types of activity. All IP addresses have been obfuscated. All internal addresses are represented as 10.x.x.x, while all external addresses are represented as 241.x.x.x. Access to the data may be made available by special request to the authors.
Scanning Activity
Adversaries often perform a scan of a network as the prelude to an attack. In particular, ‘‘script kiddies’’ (unskilled attackers) will often deploy an exploit across all of the machines in a network [7]. This type of activity will appear as a SYN scan (in the case of a TCP-based exploit), where there might be some fur-ther communication with internal systems that respond to the scanner with a SYN-ACK. The SiLK tool set can be used to find scanners of this type, and to deter-mine if particular machines should be investigated for compromise.
For example, to look for ‘‘fast’’ scanners (that is, scanners who have contacted a large number of machines in a short amount of time), we can do the following:
rwfilter --start=2004/6/29:17 \ --syn=1 --ack=0 --fin=0 \ --proto=6 --pass=stdout | \ rwaddrcount --print-recs \
--rec-min=65000
The rwfilter command here uses incoming traffic (both web and non-web) by default. It processes one hour of data (17:00-18:00 GMT on June 29, 2004), looking for all flows where the SYN flag was set, and the ACK and FIN flags were not set. The other flags (RST, URG and PSH) can take any value. Only the TCP protocol is used (--proto=6, using the standard protocol numbers as defined by the Internet Assigned
Numbers Authority (IANA) [4]). The results from the
rwfiltercommand are passed through stdout to the rwad-drcountcommand. This command prints all the source IPs that had more than 65000 flows, along with the number of bytes, packets and flows, with start and end times (see Figure 1). There were two sources that met these criteria.
The source IP that had the most records (and who therefore presumably scanned the most targets) was 241.27.240.226, with 74,773 flows (a little over one /16 network, if each flow is to a different destination IP), while 241.21.21.24 had 65,732 flows. We therefore elect to examine the traffic from both source IPs in detail. Some of the information that we would like to know include how many unique destination IP addresses did each source target, and what ports they targeted.
To answer the first question regarding the num-ber of destinations, we can extract all of the flows for each source via anrwfiltercall. In this case we will save the results to disk so that we do not need to continu-ally process an entire hour of data. We also drop the restriction on the flag combinations so that we see all of the TCP flows from this source. The command used for the first source IP address is:
rwfilter --start=2004/6/29:17 \ --saddr=241.27.240.226 \ --proto=6 \
--pass=rwdatafile
The process is the same for the second IP address. The resulting file contains 75,199 records (obtained by usingrwfileinfo, or by adding the option--print-statto the
rwfiltercommand). To determine the number of unique destination IP addresses in this file, we can use the command:
rwuniq --field=2 --no-title \ rwdatafile | wc
which performs the equivalent ofsort | uniq -cusing the destination IP field (field = 2), with the titles for the fields turned off. The result was 75,199 lines, which indicates that there were that many unique IP addresses – indicating only one flow per destination IP address. However, given that there were more records observed when the flag restriction was dropped, there was likely some further communication between some of the additional destination IP addresses.
To determine the ports that were targeted, we can perform the same query as above, but replace the field value with 4 (for destination port). The result from this query (rwuniq --field=4 rwdatafile) is:
dPort count 80 75199
This shows that all of the flows were to destina-tion port 80 (web). Similarly, running the same
commands for source IP address 241.21.21.24 also showed a scan of port 80.
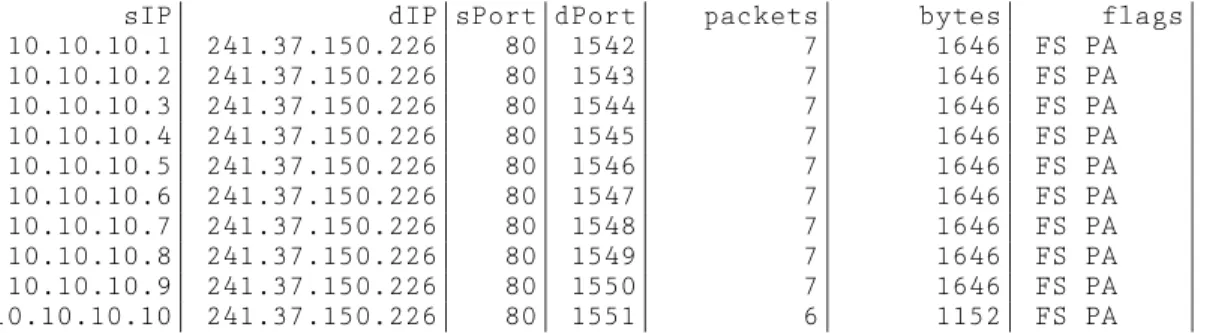
sIP| dIP|sPort|dPort| packets| bytes| flags|
10.10.10.1| 241.37.150.226| 80| 1542| 7| 1646| FS PA | 10.10.10.2| 241.37.150.226| 80| 1543| 7| 1646| FS PA | 10.10.10.3| 241.37.150.226| 80| 1544| 7| 1646| FS PA | 10.10.10.4| 241.37.150.226| 80| 1545| 7| 1646| FS PA | 10.10.10.5| 241.37.150.226| 80| 1546| 7| 1646| FS PA | 10.10.10.6| 241.37.150.226| 80| 1547| 7| 1646| FS PA | 10.10.10.7| 241.37.150.226| 80| 1548| 7| 1646| FS PA | 10.10.10.8| 241.37.150.226| 80| 1549| 7| 1646| FS PA | 10.10.10.9| 241.37.150.226| 80| 1550| 7| 1646| FS PA | 10.10.10.10| 241.37.150.226| 80| 1551| 6| 1152| FS PA |
Figure 2: Output from filtering on a particular destination IP. We are interested in determining if there were
any responses to these two scans. To determine this, we first create an ipset from these two IPs. We can do this by creating a file that contains the two IP addresses and then runningbuildset. Alternatively, we can do the following:
rwfilter --start=2004/6/29:17 \ --syn=1 --ack=0 --fin=0 \ --proto=6 --pass=stdout | \ rwaddrcount --print-ip \
--rec-min=65000 --no-title | \ buildset stdin ip.set
With only two IP addresses, it is quicker to just create a temporary file, however if there had been a large number of IP addresses, than the latter approach is preferable.
We can then use the ipset that we have created as a filter on the outgoing data to determine what com-munication there was from the internal network to these two scanning IP addresses. The command we would use is:
rwfilter --type=out,outweb \
--start=2004/6/29:17 --proto=6 \ --dipset=ip.set --pass=rwdata.out
The result was a file consisting of 17,542 records. This indicates a very large number of responses! However, we are only interested in positive responses, or records where there was no RST returned to the source. The
rwdata.outfile can be further filtered on the flag combi-nations, to examine only those flows that contained no RST using the command:
rwfilter --rst=0 rwdata.out \ --pass=rwdata.out.noRST
Unfortunately, this still resulted in 16,865 records. We therefore take a quick look at the data to see if we can determine anything interesting. We do this by first sorting on the source IP address (the internal respond-ing host), followed by displayrespond-ing the results:
rwsort --field=1 rwdata.out.noRST \ | rwcut --field=1,2,3,4,6,7,8 \ | less
A sample from the result set is given in Figure 2. This shows that the scanner was proceeding in order through the IP space. In this instance, the source had
actually stumbled onto a honey-pot, which is why there was a response from each IP address in that par-ticular subnet. In general, if an unusually high number of the same service is seen on the same subnet (e.g., 16000 web servers on a /16) where the subnet is a gen-eral network (that is, not a server farm, for example), then it might indicate a honey pot or a firewall (as some firewalls can be configured to respond in this manner). This hypothesis is further supported by each server responding with exactly seven packets and 1646 bytes, implying that they are returning the same content (or at least content that is exactly the same size!). In our case, it turns out that the majority of responses to the scan were due to this honeypot. Worm Attacks
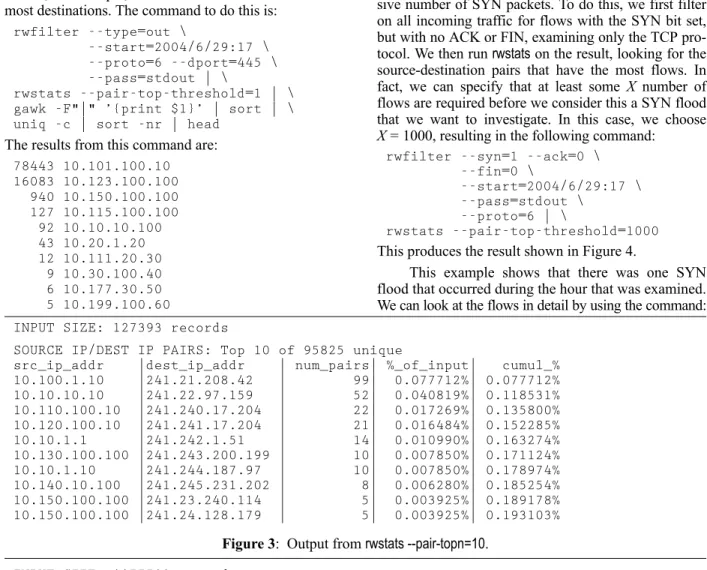
Recently, two prominent worms (Korgo [9] and Sasser [10]) have been released that scan port 445. When a vulnerable machine is found, each of the worms exploits the vulnerability, but then diverge to perform different activities on the infected machine. As we care less about external machines scanning our network for vulnerabilities than we do about internal machines that have been infected, we turn our attention to examining outgoing network traffic. We know that infected machines scan for vulnerabilities on port 445, so we can narrow our search by examining only flows with destination port 445. Since we are looking for machines that perform scanning of this port, by defini-tion there will be a large number of unique destinadefini-tion IP addresses contacted by a single source. We there-fore want to find all internal machines that are contact-ing large numbers of external machines on port 445. (Note that just a large number of flows is not necessar-ily indicative of an infection, but that a large number of unique destination IP addresses is more indicative.) To extract the information we want, we first per-form anrwfilter, and then pipe these results through a call torwstats: rwfilter --type=out \ --start=2004/6/29:17 \ --proto=6 --dport=445 \ --pass=stdout | \ rwstats --pair-topn=10
As we are now examining outgoing traffic, we need to specify that the type is out instead of the default of incoming. We do not need to examine
outweb, as port 445 is not one of the web ports. Again we look at only one hour of data, extracting all traffic to destination port 445 using the TCP protocol. The output from this command is piped intorwstats, which produces the top ten source-destination IP pairs based on the number of records. The output from this com-mand is give in Figure 3.
INPUT SIZE: 127393 records
SOURCE IP/DEST IP PAIRS: Top 10 of 95825 unique
src_ip_addr |dest_ip_addr | num_pairs| %_of_input| cumul_% 10.100.1.10 |241.21.208.42 | 99| 0.077712%| 0.077712% 10.10.10.10 |241.22.97.159 | 52| 0.040819%| 0.118531% 10.110.100.10 |241.240.17.204 | 22| 0.017269%| 0.135800% 10.120.100.10 |241.241.17.204 | 21| 0.016484%| 0.152285% 10.10.1.1 |241.242.1.51 | 14| 0.010990%| 0.163274% 10.130.100.100 |241.243.200.199 | 10| 0.007850%| 0.171124% 10.10.1.10 |241.244.187.97 | 10| 0.007850%| 0.178974% 10.140.10.100 |241.245.231.202 | 8| 0.006280%| 0.185254% 10.150.100.100 |241.23.240.114 | 5| 0.003925%| 0.189178% 10.150.100.100 |241.24.128.179 | 5| 0.003925%| 0.193103%
Figure 3: Output fromrwstats --pair-topn=10.
INPUT SIZE: 4477703 records
SOURCE IP/DEST IP PAIRS: Top 30 of 3953344 unique
src_ip_addr |dest_ip_addr | num_pairs| %_of_input| cumul_% 241.240.220.58 |10.100.100.100 | 20893| 0.466601%| 0.466601%
Figure 4: Output fromrwstats --pair-top-threshold=1000. This is not exactly the output that we want, since
we want the sources that have contacted the most desti-nations, not the source-destination pairs that have the most flow records. To get this information, we can specify a threshold on the number of flows that a source-destination pair must have before printing it to the screen. By specifying a threshold of one, we extract all pairs. However, this still only provides a list of all pairs, along with information about each pair such as the number of flow records. We can take this informa-tion and pipe it through some standard unix utilities to extract, for example, the ten sources who contacted the most destinations. The command to do this is:
rwfilter --type=out \
--start=2004/6/29:17 \ --proto=6 --dport=445 \ --pass=stdout | \
rwstats --pair-top-threshold=1 | \ gawk -F"|" ’{print $1}’ | sort | \ uniq -c | sort -nr | head
The results from this command are:
78443 10.101.100.10 16083 10.123.100.100 940 10.150.100.100 127 10.115.100.100 92 10.10.10.100 43 10.20.1.20 12 10.111.20.30 9 10.30.100.40 6 10.177.30.50 5 10.199.100.60
This shows that four IP addresses contacted more than 100 unique destinations in a single hour, which is an unusually high number of destinations. (It has been observed by Williamson that workstations usually contact no more than ten destination IP addresses per hour [13].) These four machines therefore warrant additional investigation as they might be infected with Sasser or Korgo (or some other worm or virus). The only IP address that shows up in both top ten lists – that of number of connections to unique destination IP addresses and that of number of flows between it and some other source – is 10.150.100.100.
SYN Flooding
Another security concern is denial of service attacks. One of the common network-based denial of service attacks is SYN flooding. We can use commands similar to those used to detect worms to detect if a SYN flood has occurred. In this case, we want to detect all source-destination IP pairs that have seen an exces-sive number of SYN packets. To do this, we first filter on all incoming traffic for flows with the SYN bit set, but with no ACK or FIN, examining only the TCP pro-tocol. We then runrwstatson the result, looking for the source-destination pairs that have the most flows. In fact, we can specify that at least some X number of flows are required before we consider this a SYN flood that we want to investigate. In this case, we choose
X= 1000, resulting in the following command:
rwfilter --syn=1 --ack=0 \ --fin=0 \
--start=2004/6/29:17 \ --pass=stdout \
--proto=6 | \
rwstats --pair-top-threshold=1000
This produces the result shown in Figure 4.
This example shows that there was one SYN flood that occurred during the hour that was examined. We can look at the flows in detail by using the command:
rwfilter --saddr=241.240.220.58 \ --daddr=10.100.100.100 \ --start=2004/6/29:17 \ --pass=stdout | \ rwsort --field=9 | \ rwcut --field=3-8 | less
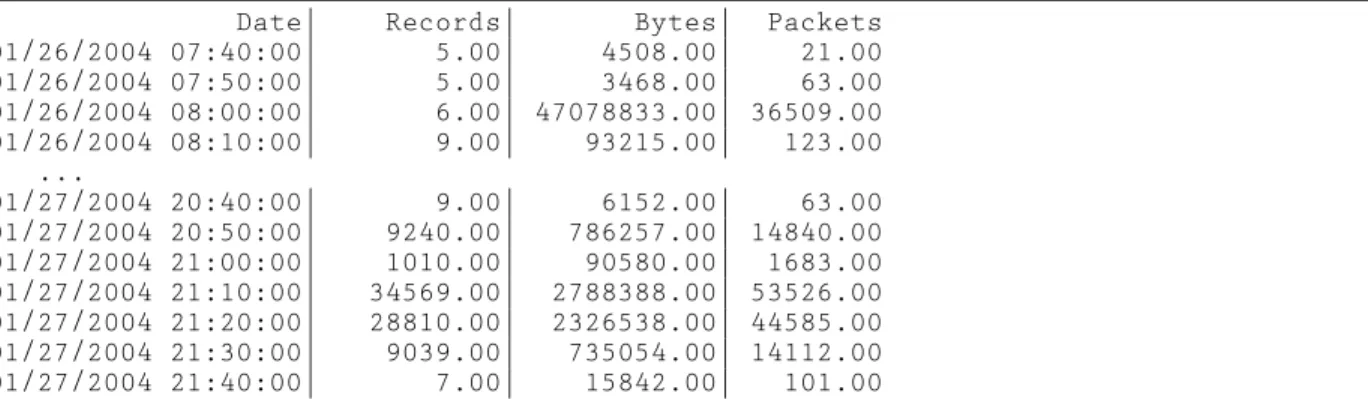
Date| Records| Bytes| Packets 01/26/2004 07:40:00| 5.00| 4508.00| 21.00 01/26/2004 07:50:00| 5.00| 3468.00| 63.00 01/26/2004 08:00:00| 6.00| 47078833.00| 36509.00 01/26/2004 08:10:00| 9.00| 93215.00| 123.00 ... 01/27/2004 20:40:00| 9.00| 6152.00| 63.00 01/27/2004 20:50:00| 9240.00| 786257.00| 14840.00 01/27/2004 21:00:00| 1010.00| 90580.00| 1683.00 01/27/2004 21:10:00| 34569.00| 2788388.00| 53526.00 01/27/2004 21:20:00| 28810.00| 2326538.00| 44585.00 01/27/2004 21:30:00| 9039.00| 735054.00| 14112.00 01/27/2004 21:40:00| 7.00| 15842.00| 101.00
Figure 5: Output from filtering on destination port 3127 and then looking at the number of bytes, packets and flows in 10 minute intervals.
rwfilter --stime=2004/1/26:08:00:00- 2004/1/26:08:10:00 dport.3127 \ --pass=stdout | rwcut
Figure 6: Filtering on ten minute interval. This command filters on the particular source and
desti-nation IP address of interest for the one hour, followed by sorting the records based on the start time for the flow. A sample of the results from this command are:
sPort|dPort|pro| packets| bytes| flags|
54237|17299| 6| 1| 60| S | 54232|38318| 6| 1| 60| S | 54235|62020| 6| 1| 60| S | 54238|46925| 6| 1| 60| S | 54239|23970| 6| 1| 60| S | 54240| 3568| 6| 1| 60| S | 54233|43740| 6| 1| 60| S | 54228|14472| 6| 1| 60| S | 54241|17440| 6| 1| 60| S |
This is an unusual set of traffic in that it appears that the attacker was flooding a particular machine, rather than a specific service. It is also unusual for the TCP SYN packet to contain 60 bytes. Further, it appears that the DoS was directed against only high-numbered ports.
To determine if there was any variation in the protocol, packets, bytes or flags, we run:
rwfilter --saddr=241.240.220.58 \ --daddr=10.100.100.100 \ --start=2004/6/29:17 \ --pass=stdout | \ rwuniq --field=6
In this case, we are looking at how many different num-bers of packets (field=6) appear in the set of flows. By varying the field value, we can also examine bytes, flags, and protocol. In this case we found that all of the flows were 1-packet TCP SYN flows consisting of 60 bytes. By choosing field=4 for destination port, and then piping the result throughsortandwc, we found that
13915 unique ports were targeted, with no port being hit more than three times.
Infected Machines
Another example usage comes from tracking the MyDoom worm in late January, 2004. This worm spread via an email attachment that created a backdoor on ports 3127-3198. After the release of this worm, scanning for this backdoor increased significantly. To see the number of flows caused by this scanning in 10-minute intervals (indicated by --bin-size=600, for 600 seconds) over the 26-27 January 2004, we use the commands: rwfilter --start-date=2004/1/26:00 \ --end-date=2004/1/27:23 \ --dport=3127 --proto=6 \ -−type=in --pass=stdout | \ rwcount --bin-size=600
Note that we use only the incoming non-web data, and not the web data. This is because port 3127 can be chosen as an ephemeral port for web connec-tions, which is benign traffic that we want to exclude. The rwfilter command processed 354,559,695 records, generating output that consisted of only 104,376 records to be processed by rwcount. In this case, we use the default binning ofrwcount, which is to put the flow in the bin based on its start time, regardless of the elapsed time of the flow. For example, if a flow con-sisted of 10,000 bytes over 20 minutes, then all 10,000 bytes would be counted in the first 10-minute bin (based on start time), rather than 5000 bytes in the first 10-minute bin, and 5000 bytes in the second 10-minute bin. One of the options provided with
rwcountwill split the bytes and packets evenly over the time period covered by the record. This could result in fractional value (and hence we provide two digits after the decimal place for precision in the output). A snap-shot of some of the result is provided in Figure 5.
Tw o interesting events occur in this data. The first is a sudden jump in the number of bytes transferred,
even though the number of flows remained constant. Drilling down to investigate further, we filter on the 10 minute interval and then print the resulting records; see Figure 6. There was one flow in this time period that accounted for the majority of bytes, which was a trans-fer from port 119, which contains the network news protocol, but also the Happy99 trojan [12]. However, by going to the source IP address, we find that it is a news server, and so this traffic is likely legitimate.
The second interesting event is the sudden jump in the number of records, which likely represents scan-ning activity against our network. We can determine which source IP addresses had the most flows associ-ated with them by using the command in Figure 7. This command prints all IP addresses that had more than 10 flows in the one hour time period. There were only two IP addresses that met this criterion, one of which had 12 flows, and the second of which had 82,639. It is therefore likely that this second IP was performing a scan of our network.
It is interesting to determine if there was any traffic that was returned to the scanning IP address. To do this, we filter all outgoing traffic on the scanning IP address as a destination (here, we represent this IP as 241.2.3.4); see Figure 8. If there had been multiple scanning IP addresses, we could perform the same operation by creating an ipset first and then filtering on this set. We now have a file that contains all of the return traffic to the (potential) scanner(s).
rwfilter --stime=2004/1/27:20:40:00- 2004/1/27:21:40:00 dport.3127 \ --pass=stdout | rwaddrcount --print-rec --rec-min=10
Figure 7: Finding IP addresses with most flows.
rwfilter --start-date=2004/1/27:20 --end-date=2004/1/27:21 --class=out --type=in --daddr=241.2.3.4 --pass=response.scanners
Figure 8: Filter by scanning IP address. Examining this file more closely, we find 2658
flows. We are particularly interested in flows that do not consist of only a RST-ACK. To determine if any flows meet this criteria, we can filter on all flows that contain just a RST-ACK, and then look at those flows that fail this filter:
rwfilter --rst=1 --ack=1 \ --urg=0 --psh=0 \ --syn=0 --fin=0 \
--proto=6 response.scanners \ --fail=stdout | \
rwcut --fields=1-8 | less
There are only 10 records that fail this query. Fortu-nately, all 10 records were ICMP error messages, and so we can conclude that no internal machines had the trojan running.
Comparison to Related Work
The work that is the most closely related to this work is that of OSU FlowTools, developed by Fullmer and Romig [3]. The OSU FlowTools is a great toolkit,
and we had initially investigated using it. However, it was not capable of processing the amount of data we had in the time required, nor did it compress informa-tion sufficiently to minimize disk space. While Flow-Tools has continued to be developed over the past two years (with the latest release appearing to be Decem-ber 2003), increasing the efficiency of processing flows or storing to diskspace has not been a priority. Indeed, for the majority of networks, OSU FlowTools is more than sufficient. However, our needs corre-spond to providing analysis tools for a large ISP, where long-term trending as well as short-term secu-rity analysis were requirements. We therefore devel-oped our own flow packing system with performance and disk space minimization as design goals. To main-tain information on 1.5 billion flows requires approxi-mately 30 Gb of disk space. Additional space savings can be obtained through compression. (Saving this information as raw NetFlow records requires approxi-mately 67 GB.) These flows can be processed (via
rwfilter) in 21 minutes on a Sun 4800.
Many of the basic tools we provide are the same as in the OSU FlowTools, such as the ability to filter flows on ports or addresses, or to perform some level of statistical analysis. However, OSU FlowTools relies on Unix utilities for items such as sorting and uniq’ing, while we have developed utilities that per-form these operations on the raw data. By using these customized utilities, the performance increases signifi-cantly. For example, we can sort 45,433,086 records in five minutes, instead of 11.5 minutes required to sort the ASCII output.
One of the capabilities that we do provide, that appears to be missing in OSU FlowTools, is that of ipsets. This provides a user with the ability to generate any arbitrary list of IP addresses (such as a list of known scanners, or known hostile hosts, or key inter-nal servers) and use this list in an efficient manner as a filter option. This functionality has proven to be par-ticularly useful for security analysis. For example, ear-lier we showed how to use ipsets to store a list of scanning IP addresses, which we can then use to filter outgoing data to search for SYN-ACK responses to these scans, which might indicate potential compro-mises. Assume that there were 1000 scanners in whom we were interested (rather than just the two in the example). OSU FlowTools would require the user to create an acl file with the IP addresses of interest in it in order to achieve the desired filtering. In contrast, we can generate the ipset of interest from the first rwfilter, and use this to then filter the outgoing data. Again, our
approach has been optimized for performance (using a tree rather than a linear list), so that there is no reduc-tion in filtering speed as the number of IPs in the ipset increases. Another example would be a ‘‘bad list,’’ containing the IP addresses of external hosts who are known to have exhibited malicious activity in the past. The bad list can be represented as an ipset, and then the incoming data can be filtered on the bad list IPs as sources. Similarly the outgoing data can be filtered with the bad list as destinations. If we receive a bad list from another site that we wish to merge with our own, we need only do an rwset-unionto combine the two sets into one.
In addition, we provide the ability to extend the filtering capabilities of rwfilter through the use of dynamic libraries. Using this approach, administrators can program their own queries for cases where their query is too complex for the current filtering options. One example of where a dynamic library is useful is in examining flow traffic for particular patterns of activ-ity. For example, one sign of a successful buffer over-flow is that a source first contacted a serverSon port
P, and that this was then followed with a subsequent communication from the source to serverSbut on port
R(e.g., the first flow represents 241.9.9.9→10.8.8.8:80, and the second flow is 241.9.9.9 → 10.8.8.8:5483). Every time a flow showed a connection with more than one 40-byte packet to port 80 on some destina-tion, then the information could be stored in a hash ta-ble with the source and destination IPs as the key. This hash table would be checked each time a flow was encountered that did not meet the above condition. If such a match was found, then the entry in the hash ta-ble would be marked. Once all records were pro-cessed, all marked entries in the hash table could be printed. To the best of our knowledge, none of the other flow tools provide this capability.
Another useful capability that is provided by the SiLK Suite is rwfileinfo, which allows a user to deter-mine information about a packed file. What is particu-larly useful about this command is that it will return the arguments that were provided torwfilterin order to generate the data file.
Conclusions and Future Work
We have presented a new suite of tools for sav-ing and analyzsav-ing NetFlow data. The tools provided were built with network security analysis in mind, and can be easily extended by a knowledgeable C pro-grammer through both the creation of new tools and the incorporation of dynamic libraries. The tools were specifically designed for use on very large and very busy networks, and so had fast execution and minimal disk space usage as design requirements.
We have completed the collection system and provided basic analysis tools. We now intend to sup-plement these capabilities by providing tools that
allow traffic descriptions. One example of this is bags, which will be provided in an upcoming open source release. Bags are similar to ipsets, except that rather than using a single bit to indicate if an IP address has been seen, it provides a 32-bit counter that counts the number of flows seen to/from each IP address. This allows a user to ask questions such as ‘‘What IP addresses saw only one flow in the past hour?’’ and ‘‘How many IP addresses saw more than 10,000 flows in the past day?’’ Tools such as these will allow an administrator to characterize their network in cases where they might not otherwise have the authority or insight to do so (e.g., such as in the cases of large ISPs). Bags will be extended in a future release to be even more generic, counting any type of ‘‘volume’’ characteristic (e.g., flows, bytes, packets).
In addition, we intend to provide the ability to perform stateful queries. For example, we are working on anrwmatchtool, which will match flows from two sets of data based on a specific attribute. For example, we could filter all incoming flows to a particular port (e.g., TCP 135) into one file, generating the ipset for the sources at the same time. We could then use this ipset to filter all outgoing traffic to an ephemeral port (> 1024), and save the resulting data.rwmatch would use the two output files, and match on the IP addresses (destination in one direction matching with source in the other direction). This would provide an aggregated flow record indicating the traffic in both directions in a single record. This would allow an administrator to see all relevant data at once (e.g., the number of bytes and packets in each direction, for example), rather than needing to manually eyeball two different data files.
The current tool suite has already been in opera-tional use at a large site for over a year and is currently used by several different organizations. Additionally, extensions have been coded that have been used in secu-rity publications. Two papers have been written that make use of this tool set, with some custom-coded extensions. McHugh [6] provides a good explanation of how to use the functionality of IP sets, along with the bags extension, for security analysis. Collins and Reiter [2] have used the SiLK tool set in performing an analy-sis of denial of service (DoS) traffic-filtering approaches.
Acknowledgments
The authors would like to acknowledge the help-ful suggestions from Marc Kellner, Jim McCurley, Tom Longstaff, Tim Shimeall and John McHugh from the CERT Network Situational Awareness Group, as well as the many analysts at the client site. We would also like to thank our shepherd, David Hoffman, for his helpful and constructive suggestions.
Author Information
Carrie Gates has five years of system administra-tion experience, starting at a small not-for-profit
organization and finishing with three years as the Sys-tem Manager for the Computer Science Faculty at Dalhousie University. She left this position in 2001 to pursue a Ph.D., specializing in network security. She is currently a Visiting Scientist with the CERT Net-work Situational Awareness program at Carnegie Mel-lon University, where she is completing her disserta-tion research. She can be reached at [email protected] .
Michael Collins is a full-time employee of CERT/NETSA where he focuses on network traffic analysis and the study of large systems. Before work-ing for CERT, he worked for several years in the n-dim group, studying engineering design and system reliability. He graduated with a B.S. in Physics from CMU in 1997, and a MS in Electrical Engineering in 2001. He is a candidate for a Ph.D. in Electrical Engi-neering. He can be reached at [email protected] .
Michael Duggan graduated with a Bachelors degree in Electrical and Computer Engineering from Carnegie Mellon University in 1996, after which he worked as a software developer. He joined the CERT Network Situational Awareness program in 2003, where he worked on the SiLK Suite of tools, concen-trating on the collection system.
Andrew Kompanek is a member of the Network Situational Awareness Team at the Software Engineer-ing Institute at Carnegie Mellon University. Prior to joining the SEI, he was a member of the research staff in the School of Computer Science at Carnegie Mellon, a principal at a startup, and a partner in a software devel-opment consultancy. He can be reached at [email protected] . Mark Thomas is a programmer and analyst for the Network Situational Awareness team, part of the Networked Systems Survivability Program at the Soft-ware Engineering Institute (SEI). Mark holds a Ph.D. and a MS in Chemical Engineering from Carnegie Mellon University and a BS in Chemical Engineering from West Virginia Institute of Technology.
References
[1] CAIDA,cflowd: Traffic Flow Analysis Tool, http:// www.caida.org/tools/measurement/cflowd , 2004. [2] Collins, Michael and Michael Reiter, ‘‘An empir-ical analysis of target-resident DoS filters,’’ Pro-ceedings of the 2004 IEEE Symposium on Secu-rity and Privacy, pages 103-114, May 9-12, 2004.
[3] Fullmer, Mark and Steve Romig, ‘‘The OSU flow-tools package and Cisco Netflow logs,’’
Proceedings of the 14th Systems Administration Conference (LISA 2000), pages 291-303, Usenix Organization, December 3-8, 2000.
[4] Internet Assigned Numbers Authority (IANA),
Protocol numbers, http://www.iana.org/ assignments/protocol-numbers , 2004.
[5] Kompanek, Drew and Mark Thomas, SiLK Analysis Suite, http://sourceforge.net/projects/ silktools/ , 2003.
[6] McHugh, John, ‘‘Sets, Bags and Rock and Roll,’’
Proceedings of the Ninth European Symposium on Research in Computer Security, September 13-15, 2004.
[7] ‘‘The Honeynet Project,’’ Know Your Enemy, Addison-Wesley, 2002.
[8] QoSient, LLC,Argus: Network Audit Record Generation and Utilization System, http://www. qosient.com/argus/ , 2004.
[9] Symantec,W32.Korgo.F, http://securityresponse. symantec.com/avcenter/venc/data/w32.korgo.f. html , 2004.
[10] Symantec,W32.Sasser.B.Worm, http://security response.symantec.com/avcenter/venc/data/w32. sasser.b.worm.html , 2004.
[11] Cisco Systems,Cisco CNS NetFlow Collection Engine, http://www.cisco.com/en/US/products/sw/ netmgtsw/ps1964/products_user_guide_chapter 09186a00801ed569.html , 2004.
[12] Treachery Unlimited,Port Lookup Search Results, http://www.treachery.net/tools/ports/lookup.cgi , 2004.
[13] Williamson, Matthew M., ‘‘Throttling Viruses: Restricting Propagation to Defeat Malicious Mobile Code,’’ 18th Annual Computer Security Applications Conference, December 9-13, 2002.