Requirements
Engineering,
IS Planning &
Researched Solutions
NORTH AMERICA • EUROPE • AUSTRALIA/ASIA
Http://www.re4innovation.com
WHITE
PAPER
W
IDE
A
UDIENCE
R
EQUIREMENTS
E
NGINEERING
By Tuure Tuunanen and Ken PeffersI
NTRODUCTIONMore and more managers are faced with a dilemma in the development of systems and products: the intended users and customers are widely dispersed, have little connection with the firm, and are unfamiliar with the expected technology. It is critically important to understand the users’ preferences and values for system and product
functionality because external users are free to ignore the system if it doesn’t meet their expectations, but making sure that it does is difficult, expensive and chancy.
We developed the wide area requirements engineering (WARE) method (Tuunanen et al. 2004) to address the problems that we identified to be highly relevant when trying to understand what wide audience end-users’ needs and requirements are for information systems products or services. Typical contemporary examples of wide audience end-users related products are systems to market services to dispersed new
customers, products intended for users outside the firm who are likely to be unfamiliar with the firm, its products or the technology, and systems to be used by the employees of customers and vendors.
Wide audience end-users differ from other end-users in one or more of the
following ways (Tuunanen 2005; Tuunanen et al. 2004). First, the number of users can be very large and they can be widely dispersed physically and geographically, even in other continents and cultures (the “reach” problem). Second, developers’ lack of control over end-users and poor incentives to participate in development efforts may result in unreliable data about what users really prefer (the “whatever” problem). Finally, end-users may have little prior experience with the technology (the “I have no idea” problem). These all are further highlighted by the fact that many of end-users do not even know how to express their wishes (Watson et al. 1993).
To describe the WARE method and to demonstrate its efficacy, we tell the story of our use of it to develop the requirements for the Medianetti e-Ad Traffic and Ad Information System, Version 2.0 (META-IS) at Helsingin Sanomat.
A
PPLYINGWARE
TOU
NDERSTANDU
SERR
EQUIREMENTS FOR THE E-A
DT
RAFFICS
YSTEMHelsingin Sanomat (Helsinki) is the one of the biggest daily newspapers in the Nordic countries with a daily circulation of 430 thousand and more than one million daily readers. The newspaper claims that it is Finland’s leading advertising media, with more than 400 thousand ads printed yearly. We were engaged by their business development team to develop the functional requirements for version two of the META-IS. The system allows customers to purchase and design display advertising for the daily newspaper, its
Nyt Weekly Supplement and the associated Monthly Magazine, as well as to Oikotie its classified on-line service. It is targeted to serve five customer segments, including regular and infrequent small scale advertisers, medium scale advertisers, large scale advertisers, and the media and ad agencies, as well as internal organization users. Our task was to develop requirements for the second version of the system. The firm had almost
completed development of the first release when they approached us, however, version one had not yet been released at the time of our study so no users had actually seen it.
Potential users for the system are thought to include tens of thousands of individuals. This presented us with an opportunity to address the needs of a system designed for use by wide audience end users (WAEUs). The potential users for the
system have diverse needs, many are outside the organization, and many, especially those characterized as infrequent advertisers, may have little historical relationship with the firm, the products, or the technology. For these users, a substantial portion of the value of the firm’s product might be embedded in the system, particularly if the system becomes their primary interface with the firm, which the firm considered a desirable potential outcome.
Data gathering and Modeling
We began the data gathering process by identifying project participants. We wanted to interview about 30 people for this project because earlier requirements engineering research suggested that a sample of that size is sufficient to gather 90% or more of the potential ideas about a concept from a population (Griffin et al. 1993). We also wanted our sample to be representative of the five customer segments for the system that were identified by the firm and to include potential “lead users,” i.e., users who are
likely to be willing to quickly embrace new features and systems (Rogers 1976; von Hippel 1986).
The project steering committee for META-IS Version 2.0 had done some
preliminary analysis as part of the project feasibility study. They were able to provide us with a list of seven key areas in which they anticipated focusing revisions for Version 2.0. This list is shown in table 1. We used this list to provide stimuli in our interviews with participants.
Table 1 Stimuli list provided by the client 1. Customer portfolio
2. Request for free space 3. Campaign planning 4. Solution configuration 5. Filing ads
6. Preparing picture ads 7. Advertising Archive
We interviewed each of the participants individually and in-person. Participants were presented with a list of the stimuli and asked to rank order them in terms of their importance to them. Then, one at a time, for the two highest ranked stimuli, the
interviewer asked the participant to describe a feature that would be important to him/her. He then asked “why would that be important to you?” to elicit consequences that the participant expected from the feature. He continued with a series of “why would that be important?” questions to elicit a chain of consequences the participant expected to result from the feature and values or objectives that were furthered by the feature. To elicit more concrete system attributes, he asked the participant a series of questions about “what would there be about the system that would make you think that it would do that?” This data was recorded in the notes as a series of chains. An example chain is shown in table 2.
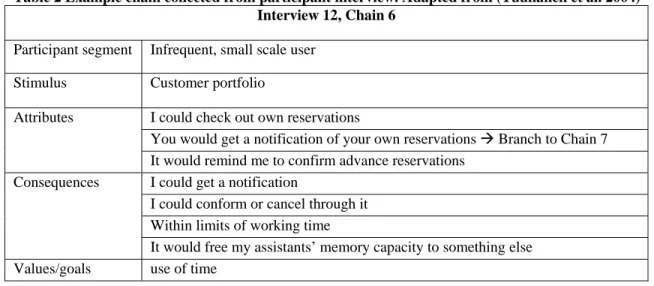
Table 2 Example chain collected from participant interview. Adapted from (Tuunanen et al. 2004) Interview 12, Chain 6
Participant segment Infrequent, small scale user Stimulus Customer portfolio
I could check out own reservations
You would get a notification of your own reservations Æ Branch to Chain 7 Attributes
It would remind me to confirm advance reservations I could get a notification
I could conform or cancel through it Within limits of working time Consequences
It would free my assistants’ memory capacity to something else Values/goals use of time
The 30 interviews resulted in the collection of 244 individual chains of data, an average of 8.13 per participant, containing 2566 individual statements. The quantity of data collected per participant compares favorably to that of other studies using laddering for strategic IS planning, e.g., approximately twice as many chains and statements per person as in (Peffers et al. 2003b).
Model Aggregation and Presentation
244 chains containing 2566 distinct statements would be difficult, if not impossible, for decision makers and designers to interpret directly. It was important to aggregate this data to produce a meaningful, but smaller, set of rich, unified aggregated models that managers and designers could grasp. To accomplish this we devised a method to cluster the chains qualitatively into themes.
The objective was to create the top layer aggregated representation of participant models, CSC maps (Peffers et al. 2003a; Peffers et al. 2003b; Peffers et al. 2002). In an all day session, two analysts discussed the 244 chains and agreed that five conceptual themes could capture all of the chains. The found themes represent different kinds of user
needs. The two analysts worked independently to sort the 244 chains into the themes and then went through the chains together to resolve differences by consensus. Later, a third analyst independently created themes and sorted the chains.
Next we created CSC maps by transforming the chains clustered into each theme into a network map. These maps contained features (attributes) and reasons why
customers saw them necessary or interesting (consequences) and finally goals or values driving the customers. Next, the analysts examined the chains in each of the themes to determine, interpretively, what subthemes could be found in them. These were recognized by consensus. Finally, they developed graphical network models through rounds of sketches.
These graphical network models were implemented as the top level in a three dimensional electronic spreadsheet-based presentation tool that included links to allow the user to drill down from an each model to the chains from which it was constructed and further down to listen to the original data collection, i.e., recorded segments of the original participant statements.
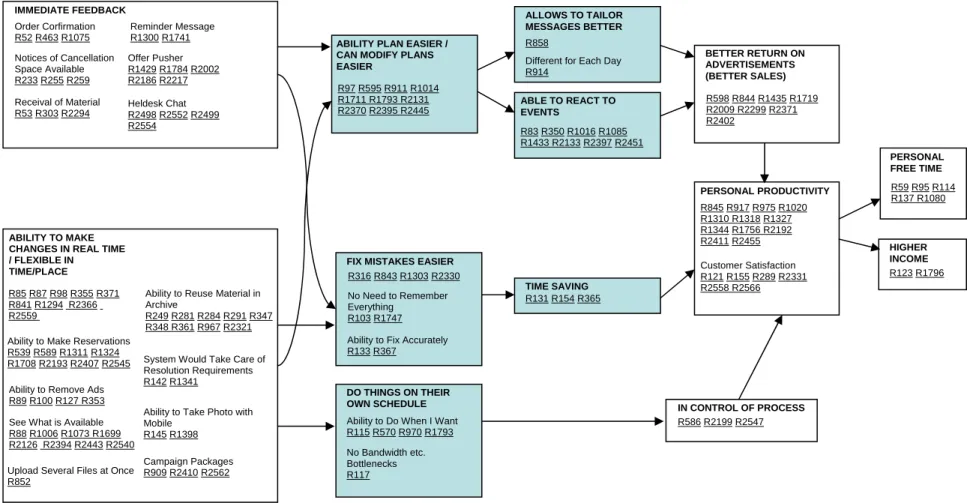
One such model is shown in figure 1. It describes the Agility of Real Time theme. On the left, the drawing refers to system attributes suggested by participants. Attribute consequences are shown in the center. Linked participant goals and values are shown on the right. The themes are subdivided into two levels of subthemes, for example, in the “agility of real time” theme, “immediate feedback” is a higher level subtheme and “order confirmation” is a second level subtheme or “feature.” The first level subthemes are linked by lines to indicate links among attributes, consequences, and values that were found in the original chains collected from participants.
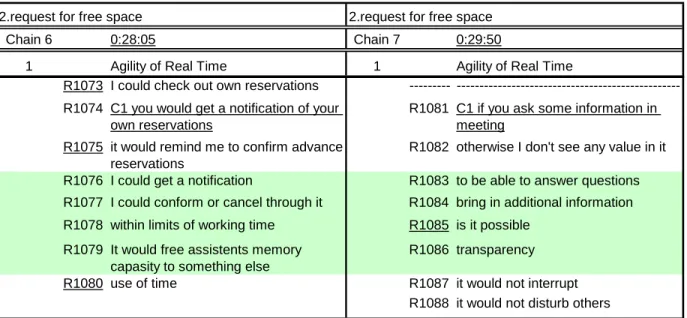
Each subtheme is annotated with links, e.g., “R52,” to selected key statements shown in the context of their original chains. This is the second level in the presentation tool. Figure 2 shows an example of one chain from the Agility of Real Time theme. From this chain a user can click on selected key statements to hear digital audio recordings of original participant statements, from the data collection interview, the tool’s third level.
The high level network models, individual chains, and audio recordings were implemented together in an electronic spreadsheet and packaged on a DVD for use by decision makers and designers. The finished presentation tool contained 824 MB of data.
In the next section we describe how we used this presentation tool to facilitate consensus reaching activities by managers and designers .
Figure 1 An example of graphical network model, adapted from (Tuunanen et al. 2004). IMMEDIATE FEEDBACK Order Corfirmation R52 R463 R1075 Notices of Cancellation Space Available R233 R255 R259 Receival of Material R53 R303 R2294 Reminder Message R1300 R1741 Offer Pusher R1429 R1784 R2002 R2186 R2217 Heldesk Chat R2498 R2552 R2499 R2554 ABILITY TO MAKE CHANGES IN REAL TIME / FLEXIBLE IN
TIME/PLACE
Ability to Reuse Material in Archive R249 R281 R284 R291 R347 R348 R361 R967 R2321 Campaign Packages R909 R2410 R2562 R85 R87 R98 R355 R371 R841 R1294 R2366 R2559
Ability to Make Reservations R539 R589 R1311 R1324 R1708 R2193 R2407 R2545 Ability to Remove Ads R89 R100 R127 R353 See What is Available R88 R1006 R1073 R1699 R2126 R2394 R2443 R2540
Ability to Take Photo with Mobile
R145 R1398
System Would Take Care of Resolution Requirements R142 R1341
Upload Several Files at Once R852
DO THINGS ON THEIR OWN SCHEDULE Ability to Do When I Want R115 R570 R970 R1793 No Bandwidth etc. Bottlenecks R117
FIX MISTAKES EASIER
No Need to Remember Everything
R103 R1747 Ability to Fix Accurately R133 R367
R316 R843 R1303 R2330
ALLOWS TO TAILOR MESSAGES BETTER R858
Different for Each Day R914 ABLE TO REACT TO EVENTS R83 R350 R1016 R1085 R1433 R2133 R2397 R2451 TIME SAVING R131 R154 R365 IN CONTROL OF PROCESS R586 R2199 R2547 BETTER RETURN ON ADVERTISEMENTS (BETTER SALES) R598 R844 R1435 R1719 R2009 R2299 R2371 R2402 PERSONAL PRODUCTIVITY R845 R917 R975 R1020 R1310 R1318 R1327 R1344 R1756 R2192 R2411 R2455 Customer Satisfaction R121 R155 R289 R2331 R2558 R2566 PERSONAL FREE TIME R59 R95 R114 R137 R1080 HIGHER INCOME R123 R1796 ABILITY PLAN EASIER /
CAN MODIFY PLANS EASIER
R97 R595 R911 R1014 R1711 R1793 R2131 R2370 R2395 R2445
2.request for free space 2.request for free space Chain 6 0:28:05 Chain 7 0:29:50
1 Agility of Real Time 1 Agility of Real Time
R1073 I could check out own reservations --- ---R1074 C1 you would get a notification of your
own reservations
R1081 C1 if you ask some information in meeting
R1075 it would remind me to confirm advance reservations
R1082 otherwise I don't see any value in it
R1076 I could get a notification R1083 to be able to answer questions R1077 I could conform or cancel through it R1084 bring in additional information R1078 within limits of working time R1085 is it possible
R1079 It would free assistents memory capasity to something else
R1086 transparency
R1080 use of time R1087 it would not interrupt R1088 it would not disturb others
Figure 2 An example of a typical chain detail from the “agility of real time” theme. Adapted from (Tuunanen et al. 2004)
Understanding and consensus-reaching activities
We used the presentation tool to facilitate consensus reaching activities that included a manager/developer workshop and a post-elicitation user survey. Our objectives included presenting the tool to managers and developers, so that they
understood how it was an expression of customer preferences and reasoning (Griffin et al. 1993), training them in its use, so that they understood how to use it to obtain rich
information (Daft et al. 1986; Fazlollahi et al. 1991), and measuring the importance or value of the requirements that we had elicited from the user participants.
Workshop
The workshop was held on a single day in March 2003. Workshop participants included both managers and developers, including the project manager for project development, marketing director, a developer, system manager, business development manager, and the META-IS project manager. To help workshop participants understand the tool and become familiar with it, we presented the tool and gave them tasks to
complete. Starting slowly initially, the participants soon grasped the idea of the tool and could work quickly.
At the end of the workshop, participants completed we surveyed the participants about their views of the workshop usefulness and the features presented in the tool. The results suggested that the workshop participants were well satisfied that they now understood the goals of the customers as presented in the presentation tool (Tuunanen et al. 2004). One participant wrote that “the workshop showed us that we are going to the right direction and it helped us to formulate the features better.” Another expressed her happiness at being able to do something and said that the tool provided an easy and expressive way to describe and analyze the requirements. In general the participants seemed very happy with the richness and interactive design of the presentation tool. Requirements validation with a survey questionnaire
Next task was to conduct a post-elicitation survey of potential customers to determine the relative value of the requirements items that we had acquired and, secondarily, to validate the collected data.
We conducted the post-elicitation survey, using an independent sample of 33 people from the same end-user segments as previously. We contacted each survey participant by telephone and then three times by email. This resulted in 24 survey answers with one partially completed answer (73% response rate). We paid each of the participants an incentive of 50€ either as a gift certificate or as a charity donation in their name.
The results of the survey are summarized in tables 3 and 4, which was intended as part of a report to the managers and developers. Table 3 reports on the ten most valuable
second level subthemes or “features,” presented in descending order of value, according to the respondents, starting with the most valuable feature, “order confirmation.” The survey value score represents a weighted value, aggregated across the participants. It is a sum of weighted participant rankings, where a participant’s highest ranked feature was awarded 10 points, the next highest 9 points, and so on. On the right, the (first level) subtheme, e.g., “immediate feedback” in the first item, is indicated. In addition, for each feature the table also reports on a summary of participant reasoning for wanting the feature and the first level theme, or MAP, to which it belongs. Table 4 lists 11 other features that were rated at least 10th on average by participants.
Survey respondents also rated the five top level themes. The results are shown in table 5. The most important theme, or map, was clearly the Agility of Real Time followed by budget management and research-campaign planning in a near tie with each other. Business report
Based on the results of our study, we made the following recommendations in a business report to the firm: Focus resources to develop features mentioned in the top ten features list (table 3) and in the top three themes (table 5). These are the features and themes most valued by the customers.
Table 1 Results of the post-elicitation survey. Adapted from (Tuunanen et al. 2004)
RANK FEATURE DESCRIPTION REASONING VALUE
SCORE SUB -THEME THEME MAP 1. Order confirmation
It makes it easier to make and modify plans, to react to events. This leaves me better in control of the process and that helps me get a better return on my advertising investments.
120 Immediate Feedback Agility of Real Time 2. Ability to make changes in real time / flexible in Time and place
I can fix mistakes or modify plans easier. I can react to events easier. I can save time by working anywhere. This helps me to get a better return on my advertising investment and it improves my own personal productivity.
80 Ability to make changes in real time Agility of Real Time 3. Receipt for submitted material
I can fix mistakes or modify plans easier. I can react to events easier. I can save time by working anywhere. This helps me to get a better return on my advertising investment and it improves my own personal productivity.
77 Immediate Feedback Agility of Real Time 4. Ability to remove ads
I can fix mistakes easier and I would be able to fix accurately specific ads and also campaigns. This would save time for me and would enable me to react to events. This helps me to get a better return on my advertising investment and it improves my own personal productivity.
67 Ability to make changes in real time Agility of Real Time 5. Reusing material and making repetitions
I would be able to reuse material stored in the personal archive and this would empower me to create ads easier but in the same time keep the consistency of style and content. This would mean better, faster and cheaper ad creation that would save money and in the same time enable me to do better creative campaigns.
47 Personal archive Ad Creative Work 6. Circulation, readership information etc.
I would like to know more about reach information in order to get more effective placement for my ads or for finding best value for my ads purchase. This would enable me to easier to evaluate campaign performance and would make possible for me to be more flexible and create better campaigns. These would all save my time and money.
44 Reach Information
Research-Campaign Planning 7. Competitors’ ads I would like to see what my competitors are doing in advertising to have more knowledge of
effective campaigns and get creative ideas. This would enable me to easier to evaluate campaign performance and would make possible for me to be more flexible and create better campaigns. These would all save my time and money.
43 Ad Library
Research-Campaign Planning
8. Ability to make
reservations
I would like to reserve advertising space on-line and in real time. This would enable me to do things on my own time. This would also able me to plan easier be more in control of the process and raise my personal productivity. This would in the end result higher income or more personal free time.
41 Ability to make changes in real time Agility of Real Time
9. Helpdesk Chat I would not need to wait hours to receive an answer for a specific question and I could continue working. This would mean better personal productivity and customer satisfaction.
39 Immediate feedback Agility of Real Time 10. Who reads sections of newspaper
I would like to know more who is reading specific sections of the newspaper in order to get more effective placement for my ads or for finding best value for my ads purchase. This would enable me to easier to evaluate campaign performance and would make possible for me to be more flexible and create better campaigns. These would all save my time and money.
36 Reach Information
Research-Campaign Planning
Table 4 Additional features rated at least 10th average by participants. Adapted from (Tuunanen et al. 2004)
Background information Searchable by industry / company etc. Ability to reuse material in archive Searchable contact directory
Flexibility in pricing Notices of cancellation space available Automated tracking expenditure & usage
and cost structure
Ability to see pricing possibilities Tailored customer oriented information Add link to company information in ad WYSIWYG
Table 2 Weighted total ratings, based on ratings by 33 participants, where themes were awarded 5 points when ranked 1st, 4 points when rated 2nd, etc. Adapted from (Tuunanen et al. 2004)
Theme Mean of inverted ranks
Agility of Real Time 40.6
Budget Management 21.4
Research-Campaign planning 20.4
Ad Creative Work 15.3
Communication 8.6
Application roadmap
Using the WARE presentation tool, the META-IS project team developed a feature release roadmap for META-IS that described features, priorities, and development schedules for the next three years. It called for the release of version 2.0 by February 2004, version 2.1 in fall 2004, version 2.2 in winter 2004-2005, and version 3.0 in late 2005. Almost all of the features included in the roadmap can be traced back to the study data; 42 of the 59 functional features were specifically recommended in the business report along with seven that came from other sources. The system is currently on-line at http://medianetti.helsinginsanomat.fi.
Client Feedback
According to the client the study helped them in several ways:
1. It clarified the focus of the project by identifying features that the customers valued.
2. It helped to justify the project to the steering committee, by providing strong evidence that the developers were responding to “the voice of the customer.” 3. It provided priorities among features for development.
4. The results helped communication between business and technical people in the organization as the reports were referenced frequently in communications. 5. The drill down feature to listen to participants’ voice recordings was used by
technical staff involved in detailed design, who felt that it helped them acquire a deep intuitive feel for the user preferences.
R
EFERENCESDaft, R., and Lengel, R.H. "Organizational Information Requirements, Media Richness and Structural Design.," Management Science (33:5) 1986, pp 554-569.
Fazlollahi, B., and Tanniru, M.R. "Selecting a Requirement Determination Methodology-Contingency Approach Revisited," Information & Management (21:5), Dec 1991, pp 291-303.
Griffin, A., and Hauser, J.R. "The Voice of the Customer," Marketing Science (12:1), Win 1993, pp 1-27.
Peffers, K., and Gengler, C.E. "How to identify new high-payoff information systems for the organization," Communications of the ACM (46:1), Jan 2003a, pp 83-88. Peffers, K., Gengler, C.E., and Tuunanen, T. "Extending critical success factors
methodology to facilitate broadly participative information systems planning," Journal of Management Information Systems (20:1), Summer 2003b, pp 51-85. Peffers, K., and Tuunanen, T. "Using Rich Information to Plan Mobile Financial Services
Applications with Maximum Positive Impact: a Case Study," Mobile Round Table, Tokyo, 2002, p. 31.
Rogers, E.M. "New Product Adoption and Diffusion," Journal of Consumer Research (2), March 1976, pp 290-301.
Tuunanen, T. "Requirements Eliciation for Wide Audience End-Users," in: Department of Business Technology, Helsinki School of Economics, Helsinki, 2005.
Tuunanen, T., Peffers, K., and Gengler, C. "Wide Audience Requirements Engineering (WARE): a Practical Method and Case Study," W-378, Helsinki School of Economics, Helsinki, p. 52.
von Hippel, E. "Lead Users: A Source of Novel Product Concepts," Management Science (32:7), July 1986 1986, pp 791-805.
Watson, H.J., and Frolick, M.N. "Determining information requirements for an EIS," MIS Quarterly (17:3) 1993, pp 255-269.