ScholarWorks at WMU
ScholarWorks at WMU
Transactions of the International Conference onHealth Information Technology Advancement Center for Health Information Technology Advancement 11-2019
Does IT Spending Matter on Hospital Financial Performance and
Does IT Spending Matter on Hospital Financial Performance and
Quality?
Quality?
C. Christopher LeeCentral Connecticut State University, christopher@ccsu.edu Christopher Chagnon
Central Connecticut State University, chris.chagnon@my.ccsu.edu Robert Marfia
Central Connecticut State University, robertmarfia@my.ccsu.edu
Follow this and additional works at: https://scholarworks.wmich.edu/ichita_transactions Part of the Health Information Technology Commons
WMU ScholarWorks Citation WMU ScholarWorks Citation
Lee, C. Christopher; Chagnon, Christopher; and Marfia, Robert, "Does IT Spending Matter on Hospital Financial Performance and Quality?" (2019). Transactions of the International Conference on Health Information Technology Advancement. 62.
https://scholarworks.wmich.edu/ichita_transactions/62
This Article is brought to you for free and open access by the Center for Health Information Technology
Advancement at ScholarWorks at WMU. It has been accepted for inclusion in Transactions of the International Conference on Health Information
Technology Advancement by an authorized administrator of ScholarWorks at WMU. For more information, please contact maira.bundza@wmich.edu.
29
Does IT Spending Matter on Hospital Financial Performance and Quality?
C. Christopher Lee Department of Management
School of Business
Central Connecticut State University New Britain, Connecticut, USA
(860) 832-3288
christopher@ccsu.edu
Christopher Chagnon MBA Program School of Business
Central Connecticut State University New Britain, Connecticut, USA
(860) 416-2070
chris.chagnon@my.ccsu.edu
Robert Marfia MBA Program School of Business
Central Connecticut State University New Britain, Connecticut, USA
(860) 543-0802
robertmarfia@my.ccsu.edu
Abstract: This research explored impacts of IT spending on hospital financial performance and hospital quality. We developed two research hypotheses accordingly. The first hypothesis was that IT spending would be positively related to the hospital financial performance, and the second hypothesis was that hospitals with higher IT spending would have better quality metrics. We used the 2017 American Hospital Association Survey data and the HCAHPS dataset from Medicare website. We tested three hospital financials and three quality measures. We employed T-Tests and ANOVA models to test the hypotheses. Results were inconclusive for both hypotheses. Evidence showed statistical significance on two out of seven tests.
INTRODUCTION
IT expenses have ever been increasing in organizations. In compliance with Patient Protection and Affordable Care Act (2010), U.S. hospitals spent even more on IT. Much research was on the impact of IT spending in hospitals. It showed that there were financial benefits and a positive correlation between hospital financial performance and IT spending (Lee & Young, 2016). The literature also showed that higher IT use was related to high levels of expenses due to the associated costs of IT systems (Menachemi et al., 2006). However, no studies have done on the relationship between IT spending and hospital financial performance and quality using the 2017 American Hospital Association Annual Survey database and Medicare database. Therefore, this research filled the gap in the literature.
We used three variables to measure hospital financial performance: operating margin, total patient revenue and net income. We collected data on IT expenses and financials from the 2017 AHA Survey database. We also used three variables to measure hospital quality: hospital overall rating, patient experience rating, readmission rate, and serious complications. The quality data came from HCAHPS dataset from Medicare website. Our study grouped hospitals into two – high IT spending and low IT spending hospitals. Using T-Test and ANOVA models, we conducted hypothesis testing on the seven variables.
30
LITERATURE REVIEW
Lee & Young (2016) found that there was a significant and positive correlation between revenue and hospital information technology (HIT) expenses. It was concluded that an 8% increase in total revenue could be achieved by a 100% increase in HIT spending. Our hypothesis is aimed to test that research and see if it can be verified by the 2017 AHA data and financial metrics that we have. Numerous studies investigated the relationship between IT spending and hospital financial performance (Agha, 2014; Encinosa & Bae, 2012; Kohli et al., 2012; Li & Collier, 2000; Lee, McCullough & Town 2013; Menachemi et al., 2006; Walker, 2017; Wang et al., 2003; Williams et al., 2015; Zhivan & Diana, 2011). Therefore, we hypothesized a positive relationship between IT spending and financial performance.
H1: If a hospital spends more on IT then the hospital will see increased financial performance.
McCullough, Casey, Moscovice and Prasad (2010) collected data from 3,401 non-federal acute care U.S. hospitals from 2004-2007 to measure the quality of patient care following the adoption of EHR. Using this data they focused on six categories to measure quality and using multivariate regression they found that average quality was higher for hospitals with EHR by 1-2% in each category. Another big finding was that health IT value is context-dependent, with larger effects in academic hospitals. There have been numerous studies on the role of IT compared to the quality that it brings to the hospital (Agha, 2014; Kohli et al., 2012; Li & Collier, 2000; Meyer & Degoulet, 2008; Parente & McCullough, 2009). Therefore, we hypothesized a positive relationship between IT spending and hospital quality outcome.
H2: If a hospital spends more on IT then the hospital will see increased quality metrics.
METHODOLOGY
From the 2017 Annual AHA Survey data and HCAHPS database on the Medicare website, we collected our sample data. Variables were selected from the datasets. The variables were described below.
IT Operating Expenses
This variable was taken from IT Operating Expenses (ITEXP) in the 2017 Annual AHA Survey data. The variable represents total IT operating expenses at the end of the reporting period. We used this metric to calculate our primary grouping variable, IT Proportion.
Total Operating Expenses
This variable was taken from FY1 Total Operating Expenses (TOE) in the 2017 Annual AHA Survey data. The variable represents total operating expenses at the end of the reporting period. We used this metric to calculate our primary grouping variable, IT Proportion.
Number of Beds
This variable was taken from Number of Beds (BDTOT) in the 2017 Annual AHA Survey data. The variable represents total facility beds set up and staffed at the end of the reporting period. We used this metric to calculate the total patient revenue per bed and the net income per bed in order to help standardize the values between hospitals of different sizes.
Total Patient Revenue
This variable was taken from FY1 Total Patient Revenue (TPR) in the 2017 Annual AHA Survey data. The variable represents total patient revenue at the end of the latest reporting period (FY1).
31
Net Income (NI)
This variable was taken from FY1 Net Income from service to patients (NI) in the 2017 Annual AHA Survey data. The variable represents total hospital net income from service to patients at the end of the latest reporting period (FY1).
Operating Margin
This variable was taken from FY1 Operating Margin (TOM) in the 2017 Annual AHA Survey data. The variable represents total operating margin at the end of the latest reporting period (FY1).
Total Patient Revenue per bed (TPR_PB)
This variable was calculated with data from the 2017 Annual AHA Survey. We calculated this metric by dividing total patient revenue by number of beds. This variable represents standardized total patient revenues between hospitals of different sizes at the end of the reporting period.
Net Income per bed (NI_PB)
This variable was calculated with data from the 2017 Annual AHA Survey. We calculated this metric by dividing net income (NI) from services to patients by number of beds. This variable represents standardized hospital net income from services to patients between hospitals of different sizes at the end of the reporting period.
Hospital Overall Rating (HospOverall)
This variable was taken from the hospital overall rating (HospOverall) field in the HCAHPS database on the Medicare website. We adopted “Hospital overall rating” as a quality measure. The patient survey responses in the database had ratings of 1 thru 5. We re-coded 1 and 2 as “low quality” and 4 and 5 as “high quality.”
Patient Experience Rating (PatientExperienceRating)
This variable was taken from the patient experience rating (PatientExperienceRating) field in the HCAHPS database on the Medicare website. We adopted “Patient experience national comparison” as the quality measure. This variable was reported as: “Below the national average”, “Same as the national average” or “Above the national average.” We coded the values numerically as 1, 2 and 3 respectively.
Readmission Rate (30IPF)
This variable was taken from the 30IPF field in the HCAHPS database on the Medicare website. We adopted “READM-30-RPF Rate” as a readmission rate variable. The readmission measures are estimates of unplanned readmission to an acute care hospital in the 30 days after discharge from a hospitalization. Patients may have had an unplanned readmission for any reason.
Serious Complications (PSI90)
This variable was taken from the PSI90 in the HCAHPS database on the Medicare website. We adopted “PSI_90_SAFETY” as a quality measure. The measure name was “Serious Complications” and was compared to the national average. The variable was reported as “No Different than the National Value”, “Worse than the National Value” and “Better than the National Value.” We coded the values numerically as 1, 2 and 3 respectively.
IT Proportion (ITPROP)
This variable was calculated by dividing total operating expenses by IT operating expenses to generate what proportion of total expenses were spent on IT operations. The spending groups were derived from “ITPROP.” To get this variable
32
into a form that would make sense for our analysis, we had to clean up the data. Our original sample size was originally 6,282 hospitals but looking at the data more closely there were values that needed to be excluded. We removed 2,673 hospitals that had a value of “0%” and another 448 hospitals where data was not reported. Extreme values such as ITPROP over 100% were also removed as that did not make sense in this study and would skew our means.
Once those values were removed, we wanted to find which would represent the High Spend and which would represent the Low Spend. To figure this out, we ran descriptive statistics on our data set until we found a spot where the mean and the median of the sample were closest and easiest to analyze further without have outliers that would skew our results. Between 98% and 5% there were only about 600 hospitals of the 3100 that remained. We decided to exclude any hospitals with over 5% ITPROP and narrow our focus to hospitals 5% and below, which was represented as 82% of the data that was left after cleansing. We were left with 2541 hospitals for grouping.
The groups were represented as High IT Spend and Low IT Spend. The high spend group was made up of hospitals where the ITPROP was between 2.5% and 5%. The low spend group was made up of hospitals where the ITPROP was between 0.01% and 2.49%. Running descriptive statistics on this, we found the mean and median to be close as well as the standard deviation appropriate. High spend was made up of 1,249 hospitals and Low Spend was made up of 1,292 hospitals for further analysis.
Our research framework was presented in Figure 1.
Figure 1: Research Framework
Sample Data
The 2017 AHA Survey dataset had over 6,000 hospital responses. Among them, less than half reported IT expenses. We merged the hospital attribute data with financial data in the AHA dataset. We ended up 2,541 hospital cases. The descriptive statistics were presented in Table 1. In addition, we used about 2,000 hospital cases in HCAHPS database on the Medicare website.
33
Table 1: Descriptive Statistics of Sample Data
Variable N Minimum Maximum Mean Std. Deviation
IT Operating Expenses 2541 $1,182.00 $175,781,646.00 $6,302,496.76 $13,066,309.09 Total operating expenses 2541 $1,925,624.00 $5,269,382,408.00 $210,736,035.43 $385,419,659.38
Number of Beds 2541 6 2877 167.74 216.662
Total patient revenues (TPR) 2541 $1,068,528.00 $16,863,431,079.00 $730,493,445.87 $1,334,424,944.06 Net income (NI) 2541 $(1,157,897,865.00) $1,347,363,833.00 $(7,590,072.43) $84,903,160.78
IT Spend Proportion 2541 0.01% 5.00% 2.46% 1.35%
Operating margin 2541 $(1,965.97) $775.78 $(9.19) $68.60 TPR per bed (TPR_PB) 2541 $28,761.56 $132,974,874.73 $3,645,022.46 $4,767,088.31 NI per bed (NI_PB) 2541 $(17,749,345.83) $4,334,971.00 $(31,188.39) $455,643.46
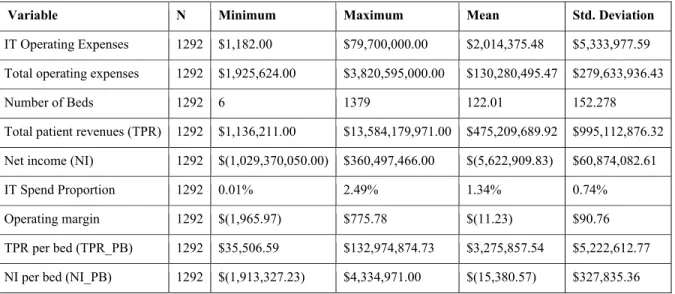
The descriptive statistics for Group 1 (hospitals with low IT spending proportion) were reported in Table 2:
Table 2: Descriptive Statistics of Group 1 (Low IT Spending Hospitals)
Variable N Minimum Maximum Mean Std. Deviation
IT Operating Expenses 1292 $1,182.00 $79,700,000.00 $2,014,375.48 $5,333,977.59 Total operating expenses 1292 $1,925,624.00 $3,820,595,000.00 $130,280,495.47 $279,633,936.43
Number of Beds 1292 6 1379 122.01 152.278
Total patient revenues (TPR) 1292 $1,136,211.00 $13,584,179,971.00 $475,209,689.92 $995,112,876.32 Net income (NI) 1292 $(1,029,370,050.00) $360,497,466.00 $(5,622,909.83) $60,874,082.61
IT Spend Proportion 1292 0.01% 2.49% 1.34% 0.74%
Operating margin 1292 $(1,965.97) $775.78 $(11.23) $90.76 TPR per bed (TPR_PB) 1292 $35,506.59 $132,974,874.73 $3,275,857.54 $5,222,612.77 NI per bed (NI_PB) 1292 $(1,913,327.23) $4,334,971.00 $(15,380.57) $327,835.36
34
Table 3: Descriptive Statistics of Group 2 (High IT Spending Hospitals)
Variable N Minimum Maximum Mean Std. Deviation
IT Operating Expenses 1249 $114,923.00 $175,781,646.00 $10,738,247.52 $16,712,767.53 Total operating expenses 1249 $4,155,187.00 $5,269,382,408.00 $293,961,461.86 $455,863,150.98
Number of Beds 1249 6 2877 215.05 259.13
Total patient revenues (TPR) 1249 $1,068,528.00 $16,863,431,079.00 $994,565,994.06 $1,569,246,362.41 Net income (NI) 1249 $(1,157,897,865.00) $1,347,363,833.00 $(9,624,959.60) $104,066,122.92
IT Spend Proportion 1249 2.50% 5.00% 3.61% 0.71%
Operating margin 1249 $(563.23) $64.03 $(7.08) $32.35
TPR per bed (TPR_PB) 1249 $28,761.56 $110,979,851.43 $4,026,896.83 $4,212,952.02 NI per bed (NI_PB) 1249 $(17,749,345.83) $1,983,904.46 $(47,540.44) $557,526.79
RESULTS
We performed T-Test to test the first main hypothesis on the impacts of IT spending on hospital financial performance. T-Test models tested if there was a statistically significant difference in financial performance between hospitals with a lower spending on IT proportion compared to a hospital with a higher IT spend proportion. We used total operating margin, total patient revenue per bed (TPR_PB), and net income per bed as the test variables in T-Test models while IT spend proportion as the grouping variable.
High IT spending hospitals reported higher operating margin than the low IT spending hospitals, but the difference was not significant [t = -1.55, p = .122]. In contrast, total patient revenue per bed showed statistical significance on the difference between the two groups [t = -4.00, p = .000]. Evidence showed marginal significance on net income per bed [t = 1.779, p = 0.075]. While high IT spending hospitals reported higher operating margin and the standardized total patient revenue averages of high IT spending hospitals were higher than the low IT spending hospitals, the standardized net income from patient services showed the reverse. T-Test model results are shown in Table 4.
Table 4: T-Test Results on Financial Performance
Test Variable Group Spending N Mean Std. Dev. df t statistics p-value
Operating Margin Low IT Spend 1292 -11.2284 90.7613 1623.56 -1.55 .122 High IT Spend 1249 -7.0769 32.3476
TPR_PB Low IT Spend 1292 3275857.5 522612.7 2460.64 -4.00 .000 High IT Spend 1249 4026896.8 4212952.0
NI_PB Low IT Spend 1292 -15380.57 327835.3 2539 1.779 .075 High IT Spend 1249 -47540.44 557526.8
Note: TPR_PB indicates total patient revenue per bed. NI_PB indicates net income per bed.
For the second hypothesis testing, we ran four ANOVA models to see if there was a significant difference in quality metrics between hospitals with a lower spending on IT proportion and hospitals with a higher IT spend proportion. We used hospital overall rating (HospOverall), patient experience rating (PatientExpRating), patient 30 day readmission rate (30IPF), and safety/complications (PSI90) as the test variables, and IT spend proportion as the grouping variable.
35
ANOVA results showed no statistical significance on the HospOverall variable [F = 1.666, p = .198]. Patient experience rating show no signficiance [F = .224, p = .636]. Readmission rate showed no significance [F = .000, p = .986]. In contrast, we found statistical significance on safety/complications [F = 4.044, p = .045]. A summary of the ANOVA results were presented in Table 5.
Table 5: ANOVA Results on Quality
Test Variable df F statistics p-value
HospOverall 1, 1875 1.660 .198
PatientExpRating 1, 1722 .224 .636
30IPF 1, 643 .000 .986
PSI90 1, 1562 4.044 .045
Note: HospOverall=hospital overall rating, PatientExpRating = patient experience rating, 30IPF = patient 30 day readmission rate, and PSI90 = safety/complications (PSI90)
DISCUSSION
IT Spending and Financial Performance
Operating margin of the hospitals was not different whether the hospital was high or low spending on IT (p = .122). The results were consistent with Kohli et al. (2012) who found that that IT’s influence on hospital value might not be evident if solely profitability measures such as operating income were deployed. Therefore, employing a market value based measure combined with traditional accounting performance measures can provide valuable insights for hospital managers.
Standardized total patient revenue of the hospitals is difference whether the hospital was a high or low spending on IT (p = .000). The results were fairly consistent with Lee & Young (2016) who found that there was a significant and positive correlation between revenue and HIT expenses, reporting that an 8% increase in total revenue could be achieved by a 100% increase in HIT spending. Our results were also in line with Agha (2014), which reported that HIT was associated with a 1.3% increase in billed charges.
Standardized net income from services to patients of the hospitals was marginally significant (p = 0.075). Contrary to operating margin and total patient revenue, low IT spending hospitals reported higher net income on average than high IT spending hospitals. Our findings here are consistent with Menachemi et al. (2006) who found thateven though higher IT use had a positive relationship with higher values of hospital finances, it was shown that it is also related to high levels of expenses due to the associated costs with IT systems.
IT Spending and Quality
Hospital overall rating was not different whether the hospital had a high or low IT spending proportion (p = .198). Patient experience rating also showed no significant difference (p = .636). Readmission showed no significance (p = .986). In contrast, safety/complications variable was different whether the hospital had a high or low IT spending proportion (p = .045). Therefore, 1 out of 4 quality variables tested showed significance between the IT spending groups. Since we weren't able to prove our hypothesis correct across all of the quality variables that we used, we found that our results were consistent with Agha (2014) who analyzed the impact of HIT on the quality and intensity of medical care. HIT is associated with a 1.3% increase in billed charges (p = 0.056), and there was no evidence of cost savings even five years after adoption of HIT. Additionally, it was found that HIT adoption appears to have little impact on the quality of care, measured by patient mortality, adverse drug events, and readmission rates.
36
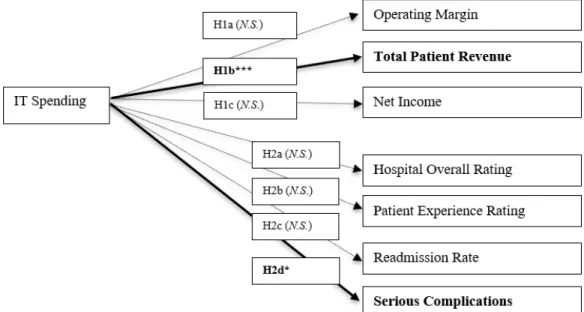
Figure 2: Summary of Results
Managerial Implications
We were able to make some key findings that the community should take into account, but with further research and more data we could prove more of our hypothesis correct and help hospitals and hospital administrators. Our research was intended to help hospitals and also help the patients that received care at these hospitals. Patient care was of utmost importance, even though the executives at hospitals seemed to only care about the profitability. We feel that given our research, hospitals could have it all and the implementation of a strong IT department could help them get where they wanted to be.
CONCLUSION
In our study, we hoped that we could show that hospitals have increased financial performance if they have higher amounts of IT spending while also improving the quality of care that patients receive. We felt that the results from comparing IT spending groups and financial performance yielded good results showing that standardized total patient revenue was higher when IT spending was higher. Differences in complications were also found between the high and low IT spending groups, as related to quality.
In the future study, tweaking the IT spend proportion could be explored, as we used 5% as our cut-off on the high end. In addition, we could investigate any control effects of hospital attributes such as teaching hospital, ownership control, location. We felt this quality study could also be improved by finding more measures of quality.
REFERENCES
Agha, L. (2014). The effects of health information technology on the costs and quality of medical care. Journal of Health Economics, 34, 19. doi:http://dx.doi.org.ccsu.idm.oclc.org/10.1016/j.jhealeco.2013.12.005
37
American Hospital Association (2017). 2017 AHA Annual Survey Database. Retrieved from
https://www.aha.org/data-insights/aha-data-products
Byrne, C. M., Mercincavage, L.M., Pan, E.C., Vincent, A.G., Johnston, D. S., & Middleton, B. (2010). The value from investments in health information technology at the US Department of Veterans Affairs. Health Affairs, 29(4), 629-638.
Encinosa, W. E., & Bae, J. (2012). Health information technology and its effects on hospital costs, outcomes, and patient safety. Inquiry - Excellus Health Plan, 48(4), 288-303.
Horwitz, J. R. (2005). Making profits and providing care: comparing nonprofit, for-profit, and government hospitals.
Health Affairs, 24(3), 790-801.
Koenig, L., Dobson, A., Ho, S., Siegel, J.M., Blumenthal, D., & Weissman, J. S. (2003). Estimating the mission-related costs of teaching hospitals. Health Affairs, 22(6), 112-122.
Kohli, R., Devaraj, S., & Ow, T.T. (2012). Does information technology investment influences firm’s market value? The case of non-publicly traded healthcare firms. Mis Quarterly.
Li, L. X., & Collier, D. A. (2000). The role of technology and quality on hospital financial performance an exploratory analysis. International Journal of Service Industry Management, 11(3), 202-224.
Lee, J., & Jae-Young, C. (2016). Texas hospitals with higher health information technology expenditures have higher revenue: A longitudinal data analysis using a generalized estimating equation model. BMC Health Services Research, 16, Article number:117. Accessed
https://bmchealthservres.biomedcentral.com/articles/10.1186/s12913-016-1367-9
Lee, J., McCullough, J. S., & Town, R. J. (2012). The impact of health information technology on hospital productivity.National Bureau of Economic Research, Inc. Working Paper 18025, Retrieved from https://www.nber.org/papers/w18025.pdf
Menachemi, N., Burkhardt, J., Richard Shewchuk, Darrell Burke, & Robert G. Brooks. (2006). Hospital Information Technology and Positive Financial Performance: A Different Approach to Finding an ROI. Journal of
Healthcare Management, 51(1), 40–58.
Menachemi, N., Saunders, C., Chukmaitov, A., Matthews, M.C., Brooks, R.G., & Pietrodangelo, K. (2007). Hospital adoption of information technologies and improved patient safety: A study of 98 hospitals in Florida.
Journal of Healthcare Management, 52(6), 398-409.
Meyer, Rodolphe & Degoulet, Patrice (2008). Assessing the Capital Efficiency of Healthcare Information Technologies Investments: An Econometric Perspective. IMIA Yearbook of Medical Informatics, 17(1), 114-127.
McCullough, J.S., Casey, M., Moscovice, I., & Prasad, S. (2010). The effect of health information technology on quality in US hospitals. Health Affairs, 29(4), 647-654.
Parente, S.T., & McCullough, J.S. (2009). Health information technology and patient safety: Evidence from panel data. Health Affairs, 28(2), 357-60.
Parente, S.T., & Van Horn, R.L. (2006). Valuing hospital investment in information technology: does governance make a difference? Health Care Financing Review, 28(2), 31–43.
Walker, D.M. (2018). Does participation in health information exchange improve hospital efficiency? Health Care Management Science, 21(3), 426-438.
38
Wang, S.J., Middleton, B., Prosser, L.A., Bardon, C.G., Spurr, C.D., Carchidi, P.J., & Bates, D.W. (2003). A cost-benefit analysis of electronic medical records in primary care. The American Journal of Medicine, 114(5), 397-403.
Williams, C., Asi, Y., Raffenaud, A., Bagwell, M., & Zeini, I. (2016). The effect of information technology on hospital performance. Health Care Management Science, 19(4), 338-346.
Zhivan, N. A., & Diana, M. L. (2012). U.S. hospital efficiency and adoption of health information technology.